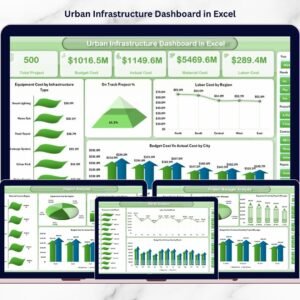
The Urban Infrastructure Dashboard in Excel transforms how municipalities and infrastructure firms monitor projects. This ready-to-use, interactive Excel dashboard centralizes cost tracking, labor allocation, material usage, equipment expenses, inspection scores, and budget performance into one powerful reporting system.
No complexity. No expensive BI tools. Just structured clarity.
🚀 Key Feature of Urban Infrastructure Dashboard in Excel
📊 5 Interactive Analytical Pages – Overview, Infrastructure Type, Project Manager, Region & Month Analysis.
💰 Budget vs Actual Tracking – Instantly detect cost variance.
👷 Labor, Material & Equipment Monitoring – Full operational visibility.
📈 Inspection Score & On-Track % Tracking – Maintain quality and timelines.
🧭 Page Navigator – Smooth navigation across pages.
🔎 Smart Slicers – Filter by Region, City, Infrastructure Type, Manager & Month.
⚡ Pivot-Based Dynamic Reporting – Update data and refresh instantly.
📦 What’s Inside the Urban Infrastructure Dashboard in Excel
This structured Excel file includes 5 fully interactive dashboard pages plus dedicated Data and Support sheets for seamless reporting.
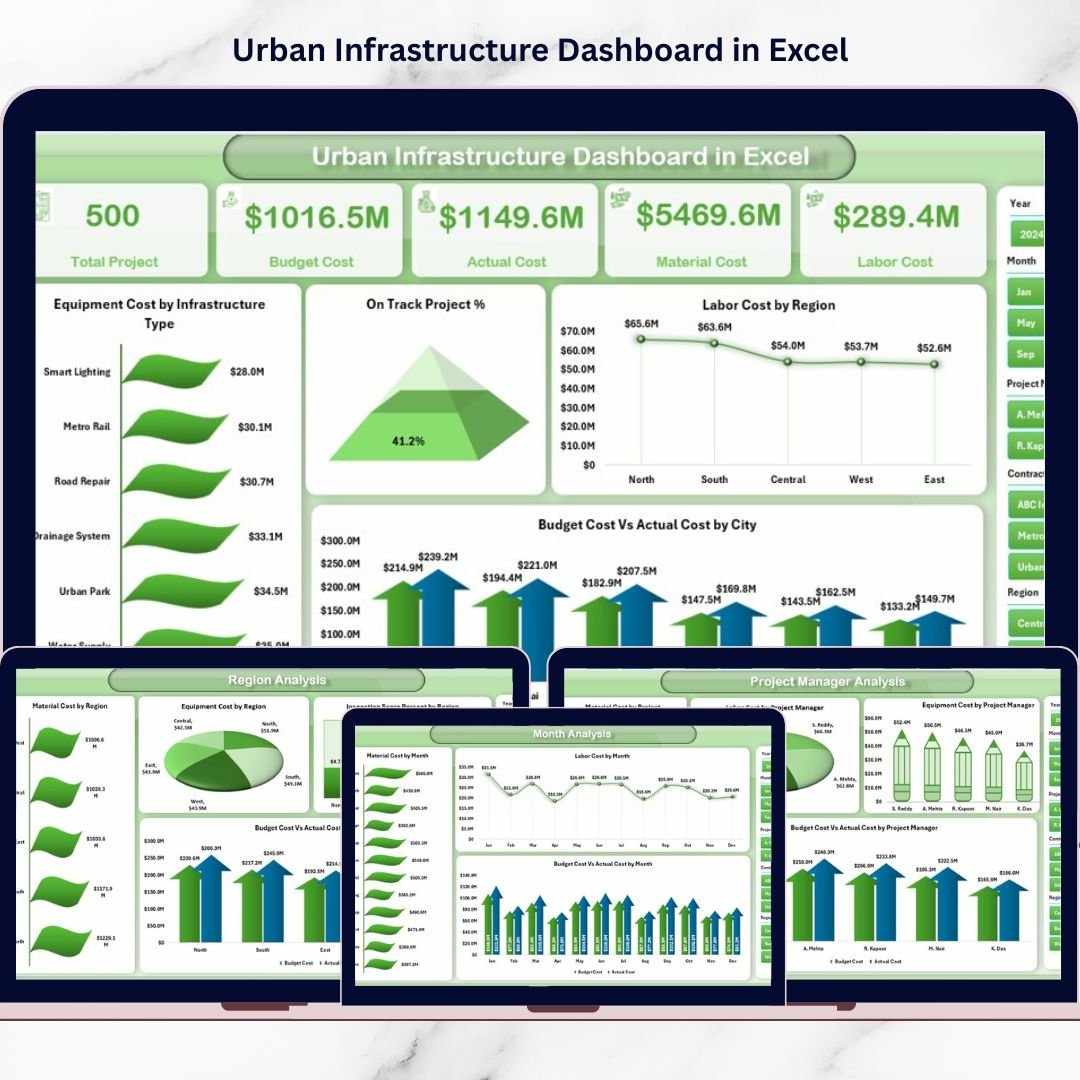
1️⃣ Overview Page – Your Urban Command Center
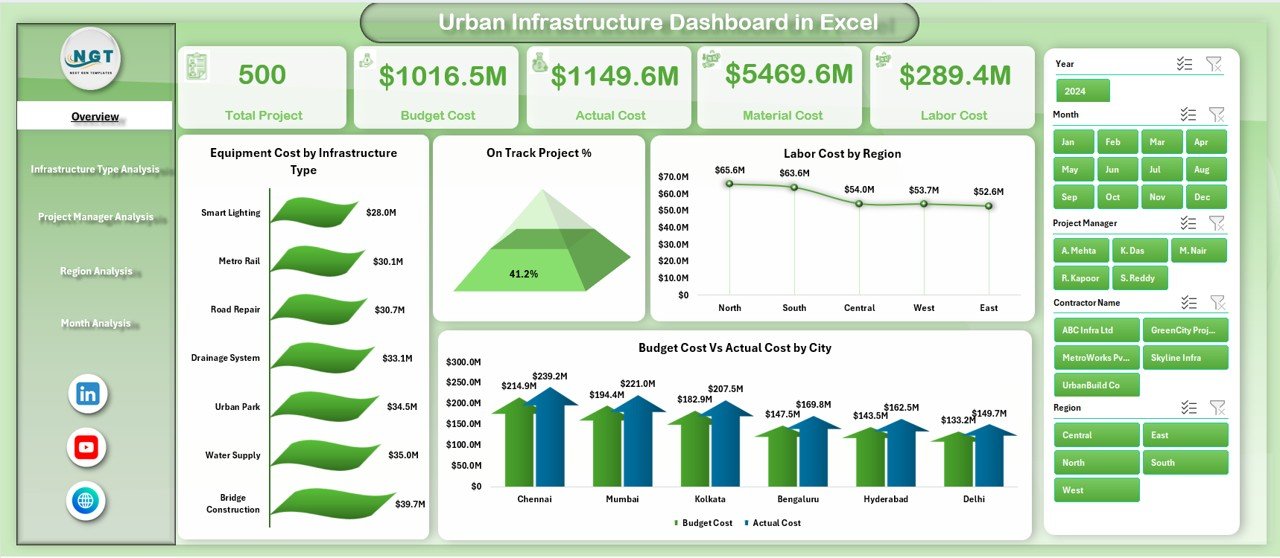
The Overview page provides an instant snapshot of infrastructure performance.
🔹 KPI Highlights
Budget vs Actual Cost
On-Track Project %
Labor Cost by Region
Equipment Cost by Infrastructure Type
🔹 Analytical Charts
Equipment Cost by Infrastructure Type
On-Track Project %
Labor Cost by Region
Budget Cost vs Actual Cost by City
Within seconds, leadership can detect cost overruns, quality risks, or project delays.
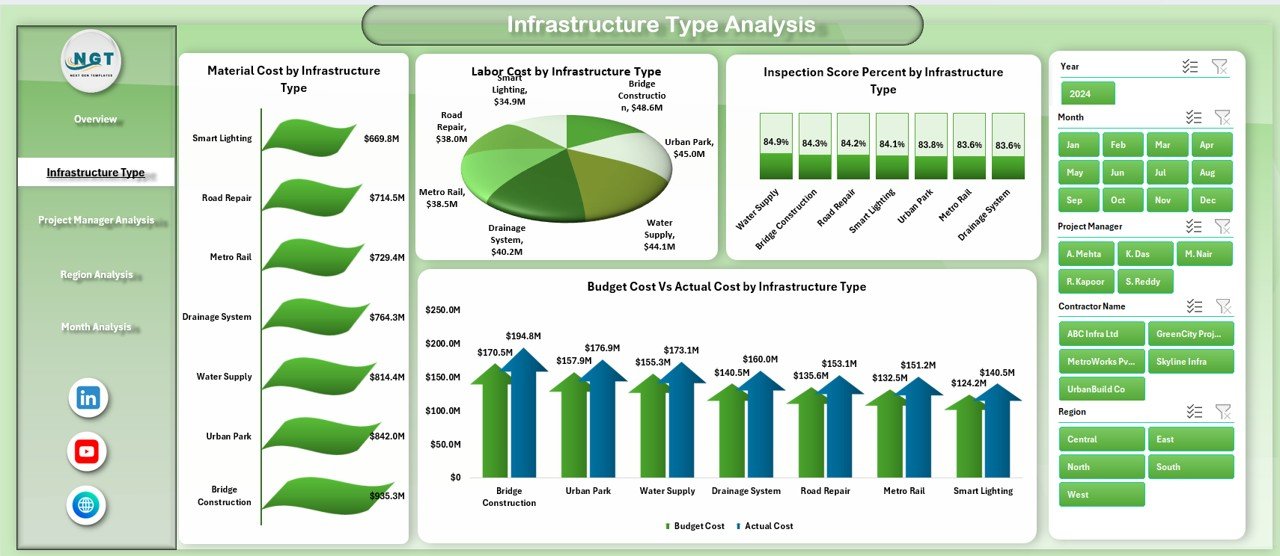
2️⃣ Infrastructure Type Analysis – Cost & Quality by Category
Urban projects vary widely:
Roads
Bridges
Utilities
Public Buildings
Transit Systems
🔹 Charts Included
Labor by Infrastructure Type
Material Cost by Infrastructure Type
Inspection Score % by Infrastructure Type
Budget vs Actual by Infrastructure Type
Identify which infrastructure category consumes the most resources and which maintains the highest inspection standards.
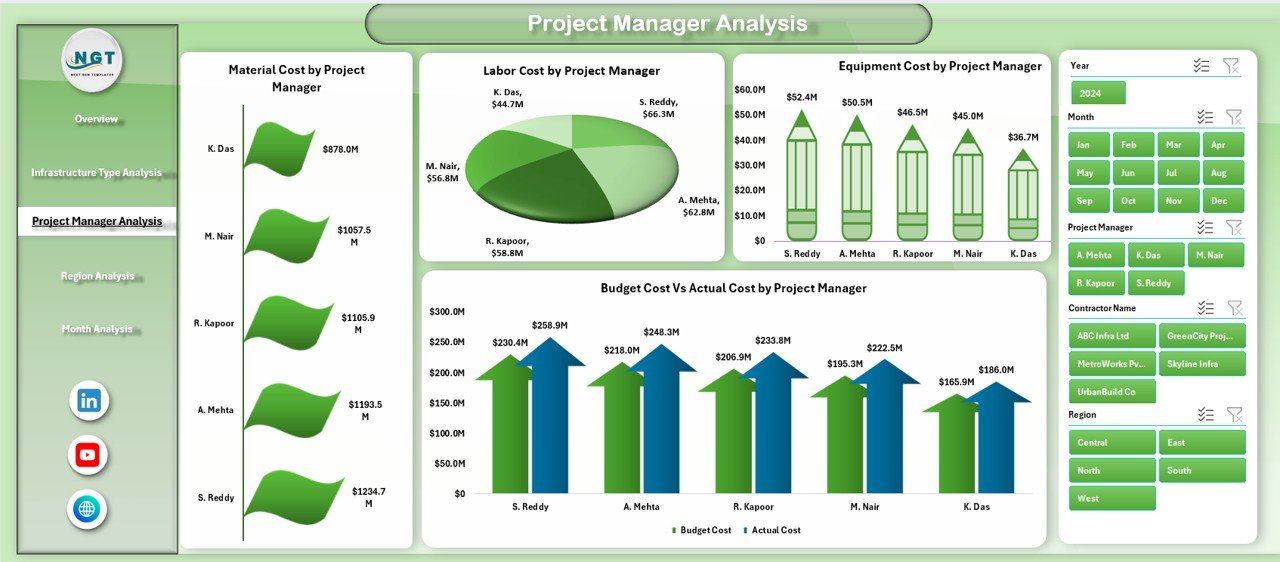
3️⃣ Project Manager Analysis – Accountability & Performance
Strong leadership drives project success.
🔹 Charts Included
Labor by Project Manager
Material Cost by Project Manager
Equipment Cost by Project Manager
Budget vs Actual by Project Manager
Compare managerial efficiency, cost discipline, and budget control transparently.
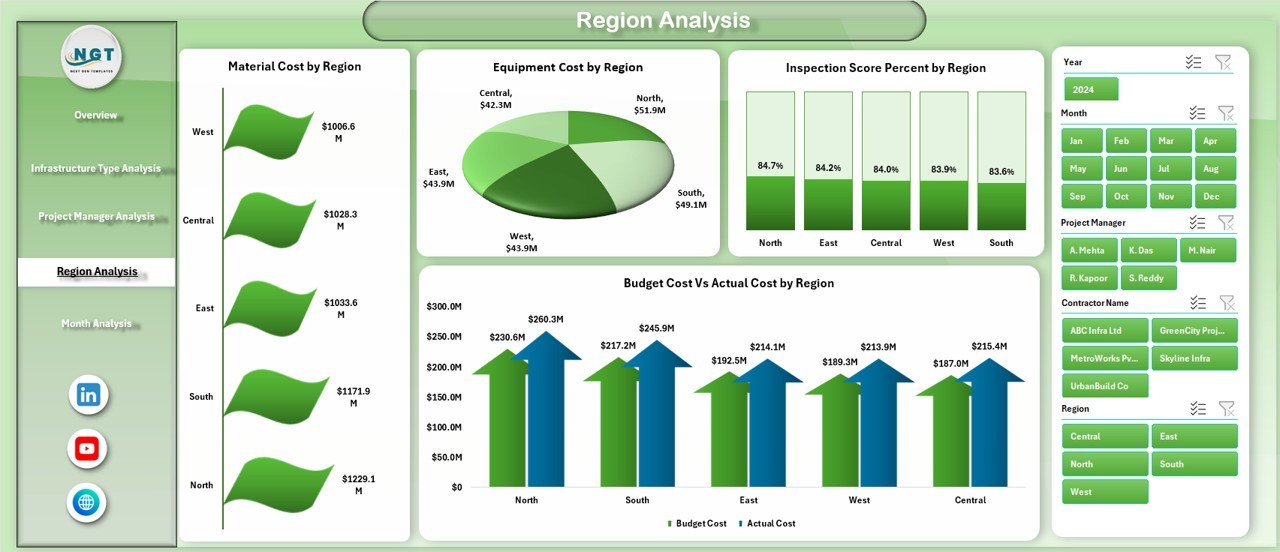
4️⃣ Region Analysis – Performance by Geography
Regional differences impact cost and quality.
🔹 Charts Included
Inspection Score % by Region
Material Cost by Region
Equipment Cost by Region
Budget vs Actual by Region
Quickly detect regional inefficiencies and allocate resources strategically.
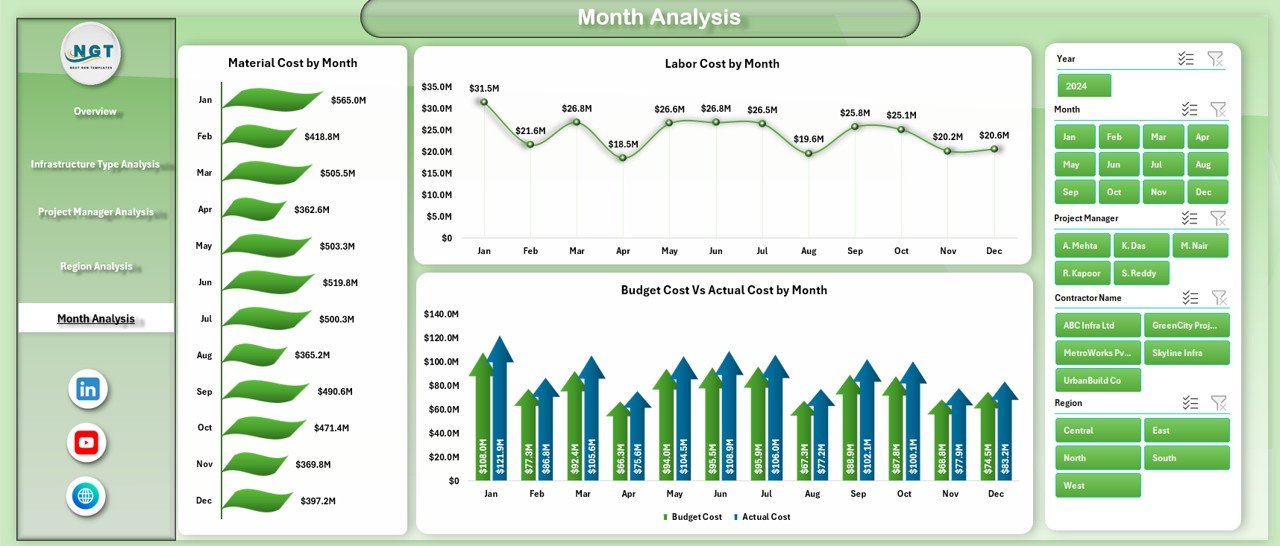
5️⃣ Month Analysis – Trend & Variance Monitoring
Infrastructure projects evolve over months or years.
🔹 Charts Included
Material Cost by Month
Labor Cost by Month
Budget vs Actual by Month
Identify seasonal spikes, cost patterns, and budget deviations before they escalate.
🛠 How to Use the Urban Infrastructure Dashboard in Excel
1️⃣ Enter structured project data in the Data Sheet.
2️⃣ Click “Refresh All.”
3️⃣ Use slicers to filter by region, type, manager, or month.
4️⃣ Review KPI cards and variance charts.
5️⃣ Conduct monthly or quarterly review meetings using the dashboard.
Simple. Structured. Powerful.
📊 Data Structure Included
Data Sheet Columns:
Project ID
City
Region
Infrastructure Type
Project Manager
Budget Cost
Actual Cost
Labor Cost
Material Cost
Equipment Cost
Inspection Score %
Project Status
Month
Support Sheet:
Pivot backend tables
Helper formulas
Data validation lists
Clean backend ensures smooth performance.
👥 Who Can Benefit from This Dashboard?
✔ Municipal Corporations
✔ Urban Planning Authorities
✔ Infrastructure Development Firms
✔ Public Works Departments
✔ Finance Controllers
✔ Project Directors
✔ Regional Heads
If you manage city growth, this dashboard gives you clarity and control.
💡 How This Dashboard Improves Profitability & Efficiency
Urban infrastructure budgets often run into crores. Even a small variance matters.
✔ Early detection of budget overruns
✔ Improved labor allocation
✔ Better equipment utilization
✔ Reduced material waste
✔ Higher inspection score consistency
For example, reducing project cost variance by just 3% on a ₹100 crore portfolio saves ₹3 crore.
That’s not reporting — that’s strategic control.
🎯 Why Choose Excel?
✔ No additional BI investment required
✔ Easy to customize
✔ Familiar interface for most teams
✔ Fast implementation
✔ Powerful pivot-based analytics
Perfect for both small municipalities and large infrastructure firms.
Upgrade from scattered reports to structured intelligence.
Take control of your city projects today.
Click here to read the Detailed blog post
Visit our YouTube channel to learn step-by-step video tutorials
👉 YouTube Channel – PKAnExcelExpert