
Managing multiple projects without clear visibility often leads to missed deadlines, budget overruns, and poor decision-making. When project data is scattered across files, emails, or tools, PMO teams struggle to maintain control. That is exactly where the Project Management Office (PMO) Dashboard in Excel becomes a game-changing solution.
This ready-to-use PMO Dashboard in Excel transforms raw project data into powerful visual insights. Instead of spending hours on manual reporting, you can instantly track budgets, costs, timelines, priorities, and performance across departments, clients, and project managers. Built entirely in Microsoft Excel, this dashboard is flexible, cost-effective, and easy to use—without the need for complex software.
Whether you manage a few projects or a full project portfolio, this PMO Dashboard gives you clarity, control, and confidence in every decision.
## 🚀 Key Features of Project Management Office (PMO) Dashboard in Excel
📊 Centralized Project Visibility – Monitor all projects from a single dashboard
💰 Budget vs Actual Cost Tracking – Instantly identify cost overruns and savings
⏱ Planned vs Actual Duration Analysis – Track delivery performance accurately
📈 Department & Manager-Level Insights – Compare performance across teams
🧭 Priority & Status Monitoring – View project distribution by priority and status
📅 Monthly Trend Analysis – Identify spending and variance patterns over time
🎯 Interactive Slicers – Filter data by department, client, manager, or month
🧩 Fully Customizable in Excel – Modify KPIs, charts, and layouts easily

## 📦 What’s Inside the Project Management Office (PMO) Dashboard in Excel
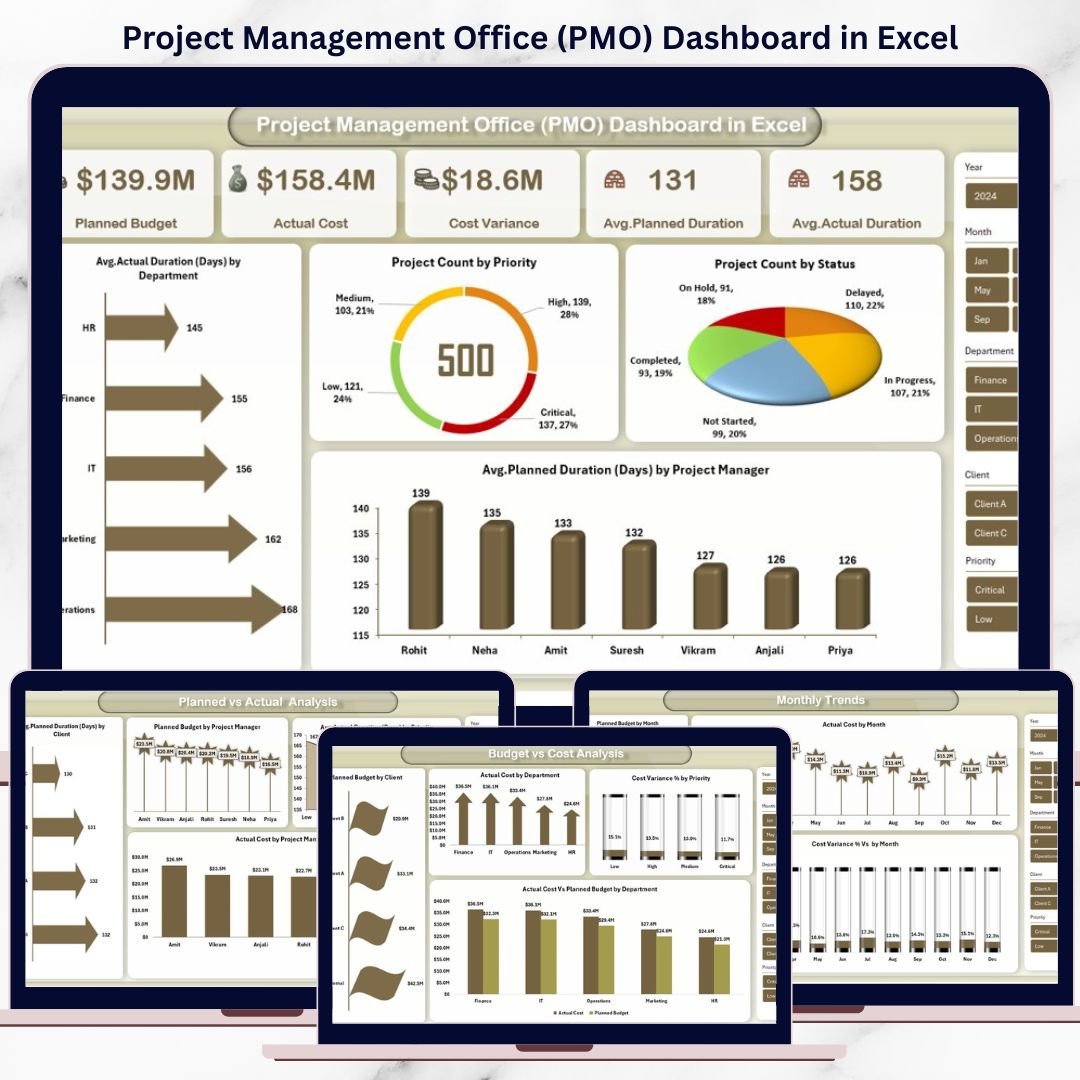
This PMO Dashboard includes multiple structured analytical sheets designed for complete portfolio-level analysis:
📌 Overview Sheet
Planned Budget
Actual Cost
Cost Variance
Avg. Planned Duration (Days)
Avg. Actual Duration (Days)
Avg. Actual Duration by Department
Project Count by Priority
Project Count by Status
Avg. Planned Duration by Project Manager
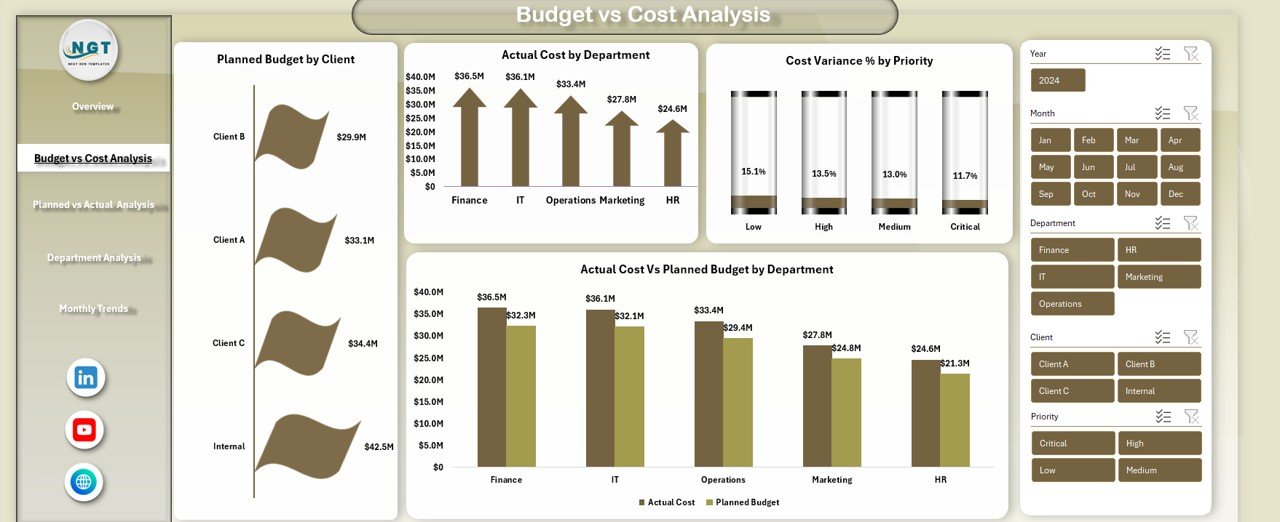
📌 Budget vs Cost Analysis Sheet
Planned Budget by Client
Actual Cost by Department
Cost Variance % by Priority
Actual Cost vs Planned Budget by Department
📌 Planned vs Actual Analysis Sheet
Planned Duration by Client
Planned Budget by Project Manager
Actual Cost by Project Manager
Actual Duration by Priority
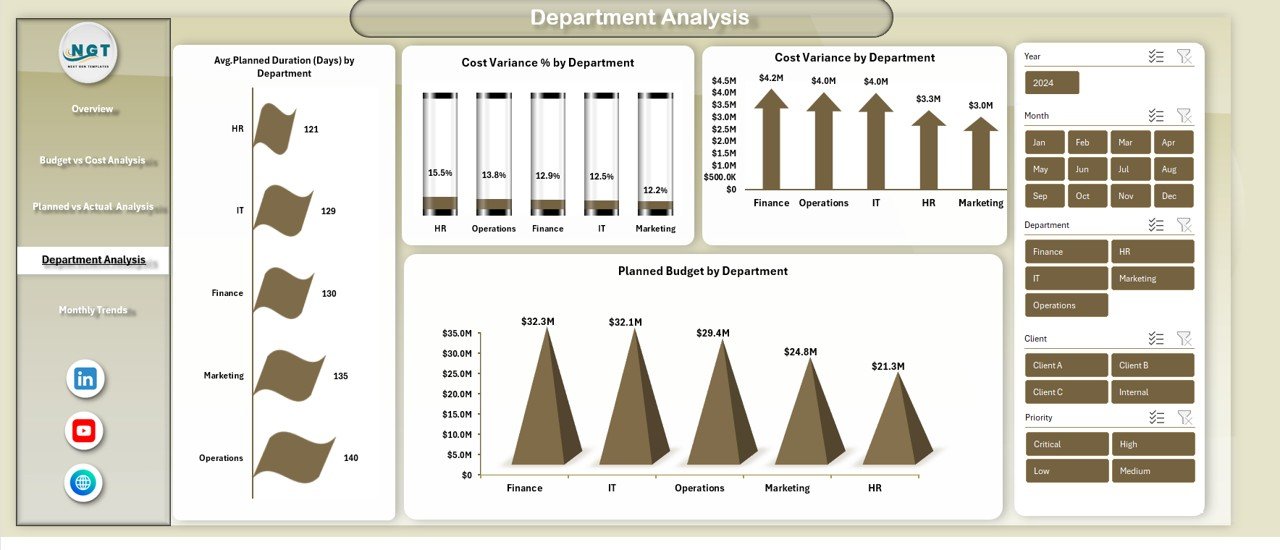
📌 Department Analysis Sheet
Avg. Planned Duration by Department
Cost Variance % by Department
Cost Variance by Department
Planned Budget by Department
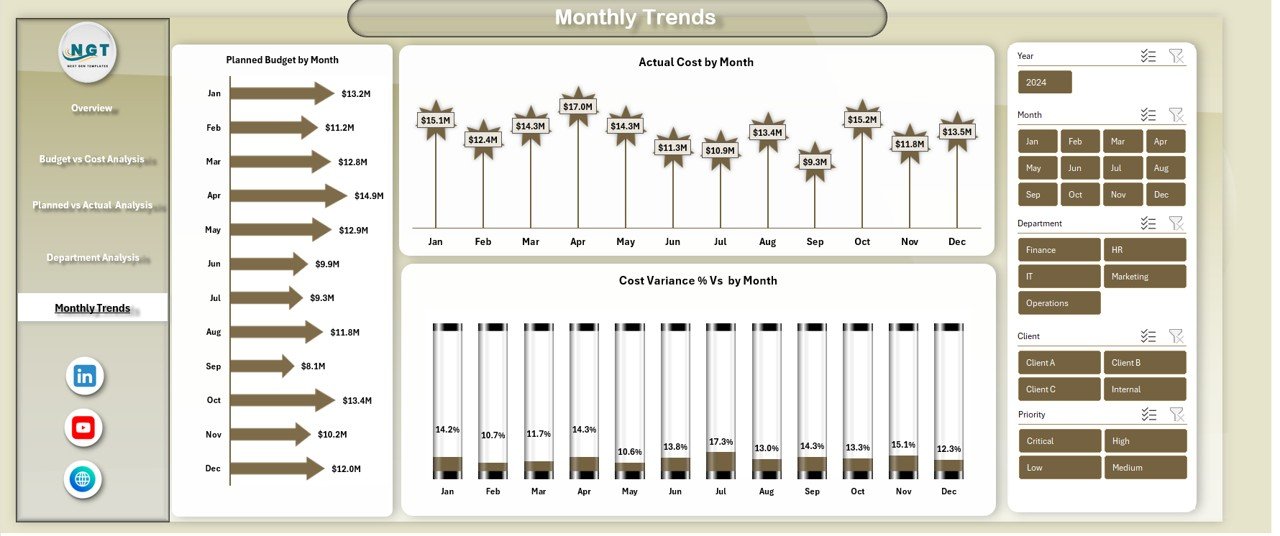
📌 Monthly Trends Sheet
Planned Budget by Month
Actual Cost by Month
Cost Variance % by Month
Each sheet is designed to answer critical PMO questions quickly and visually.
## 🛠 How to Use the Project Management Office (PMO) Dashboard in Excel
1️⃣ Enter or import your project data into the structured Excel tables
2️⃣ Update planned budget, actual cost, and duration fields
3️⃣ Refresh pivot tables with one click
4️⃣ Use slicers to filter by department, client, manager, or time
5️⃣ Analyze KPIs and trends directly on the dashboard
No advanced Excel skills are required. Basic Excel knowledge is enough to start using this dashboard confidently.
## 👥 Who Can Benefit from This Project Management Office (PMO) Dashboard in Excel
🏢 PMO Heads and Directors
📋 Project Managers and Portfolio Managers
💼 Finance and Cost Control Teams
⚙ Operations and Delivery Leaders
🏗 IT, Engineering, and Consulting Firms
📊 Organizations managing multi-project environments
If your organization wants transparency, control, and faster reporting—this dashboard is built for you.
Click here to read the Detailed Blog Post
Watch the step-by-step video tutorial: