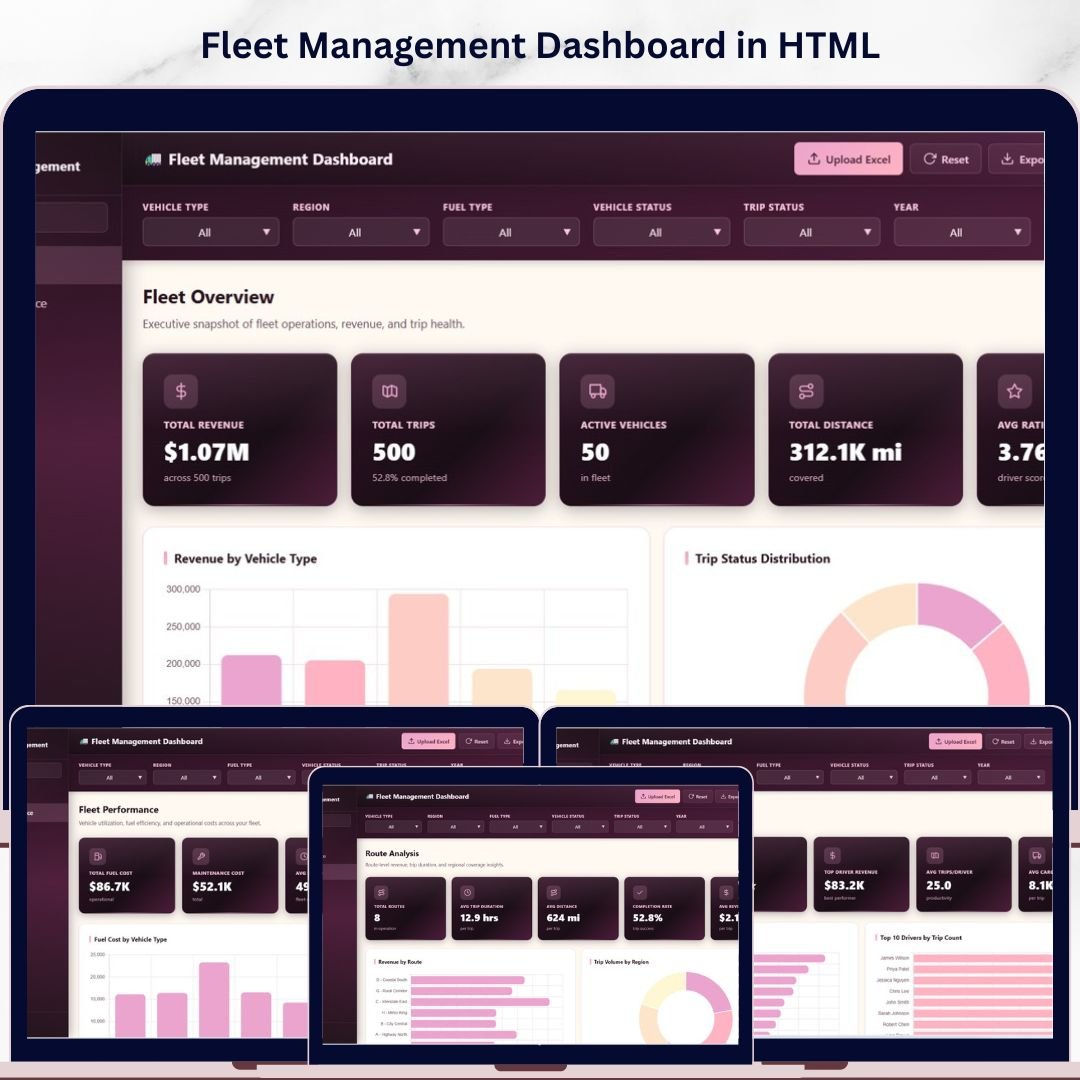


Fleet Management Dashboard in HTML is a professionally designed, interactive, browser-based analytics template built for fleet managers, logistics coordinators, transportation companies, and operations teams who need to track vehicle performance, trip revenue, route efficiency, driver insights, and fleet KPIs — all from a single self-contained HTML file. This dashboard includes 5 interactive pages covering Overview, Fleet Performance, Route Analysis, Driver Insights, and a detailed Data View — making it one of the most comprehensive HTML-based fleet management analytics solutions available today. Whether you manage a small delivery fleet or a large-scale transportation operation, this template transforms raw fleet data into clear, actionable visual insights that help you maximize revenue, reduce fuel and maintenance costs, and improve driver performance 🚚📊.
Managing a fleet involves tracking dozens of metrics including total revenue, trip counts, vehicle status, fuel consumption, maintenance expenses, route profitability, and driver ratings. Without a centralized reporting tool, fleet managers often struggle to identify which vehicles generate the most revenue, which routes are most profitable, and how individual drivers perform over time. The Fleet Management Dashboard in HTML solves this challenge by providing 5 interactive dashboard pages with dynamic charts, filter controls, and a searchable data view — all running directly in your web browser with zero software installation required. Simply unzip the file, open index.html in Chrome, Edge, or Firefox, and start analyzing your fleet data immediately. If you prefer working in other platforms, check out the Fleet Management Dashboard in Power BI or the Fleet Management Dashboard in Google Sheets.
🔑 Key Features of Fleet Management Dashboard in HTML
📌 5 Interactive Dashboard Pages — Overview, Fleet Performance, Route Analysis, Driver Insights, and Data View provide a complete 360-degree view of your fleet operations directly in the browser.
📌 5 Dynamic KPI Cards — Instantly monitor Total Revenue, Total Trips, Active Vehicles, Total Distance, and Average Rating from the Overview page for at-a-glance decision-making.
📌 20+ Analytical Charts — Each page presents focused analysis through visually engaging charts covering revenue by vehicle type, trip status distribution, fuel costs, maintenance costs, route profitability, driver performance, and monthly trends.
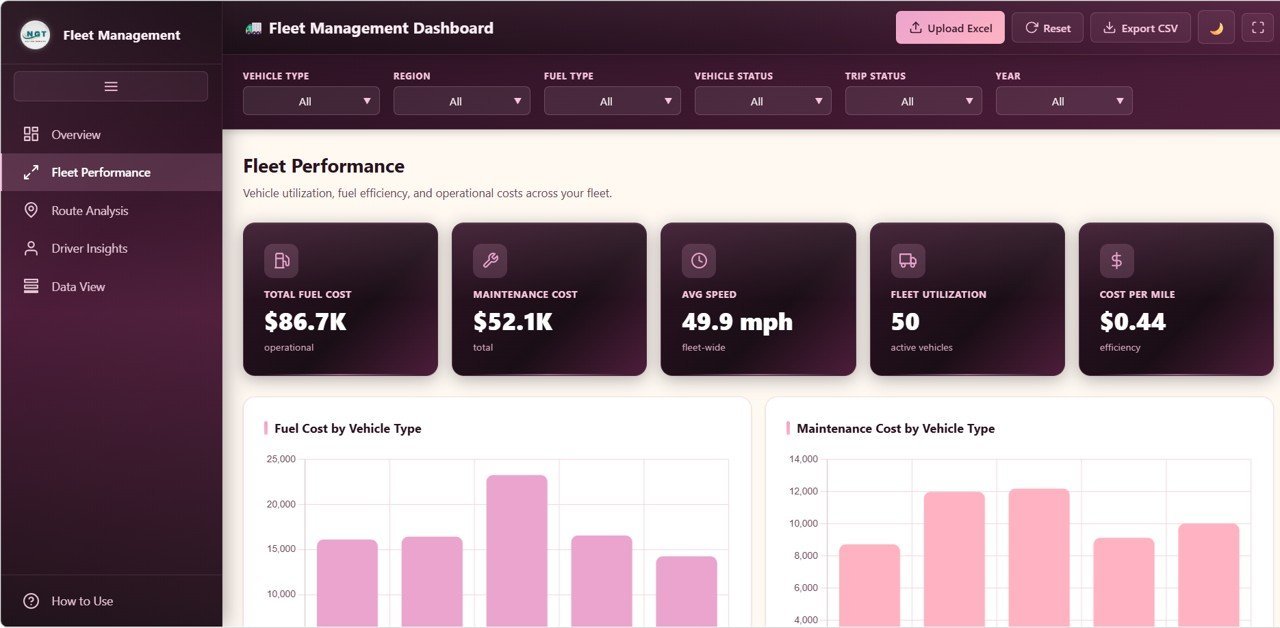
📌 Fleet Performance Module — Dedicated analysis page tracking Fuel Cost by Vehicle Type, Maintenance Cost by Vehicle Type, Distance Covered by Fuel Type, Average Speed by Vehicle Type, and Revenue by Vehicle ID.
📌 Route Intelligence — Analyze Revenue by Route, Trip Volume by Region, Average Trip Duration by Route, Total Distance by Region, and Trip Volume by Month and Region.
📌 Driver Analytics — Track Revenue by Driver, Trip Count by Driver, Driver Count by Rating Band, Average Rating by Vehicle Type, and Revenue by Distance per Driver.
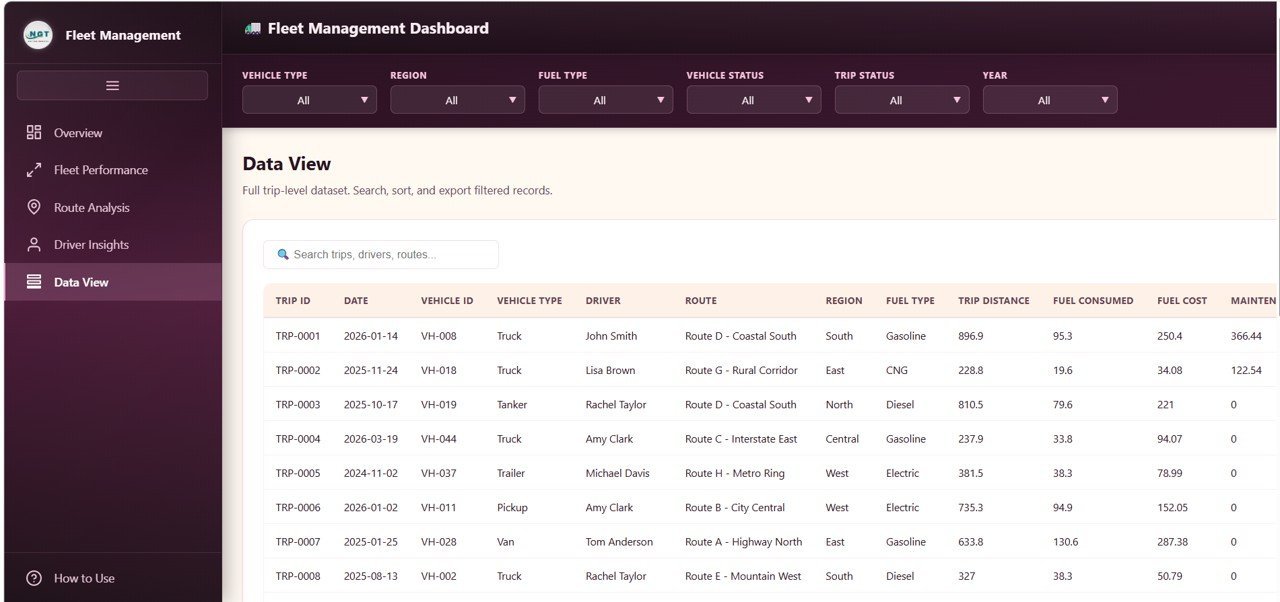
📌 Searchable Data View with CSV Export — Browse all records with search, sort, and pagination features. Export filtered data to CSV.
📌 No Software Required — Opens in any modern browser (Chrome, Edge, Firefox, Safari).
📦 What’s Inside the Fleet Management Dashboard in HTML
This template includes 5 interactive dashboard pages:
📊 Overview Page — KPI cards for Total Revenue, Total Trips, Active Vehicles, Total Distance, and Average Rating. Charts: Revenue by Vehicle Type, Trip Count by Trip Status, Revenue by Month, Vehicle Count by Vehicle Status, and Revenue by Region.
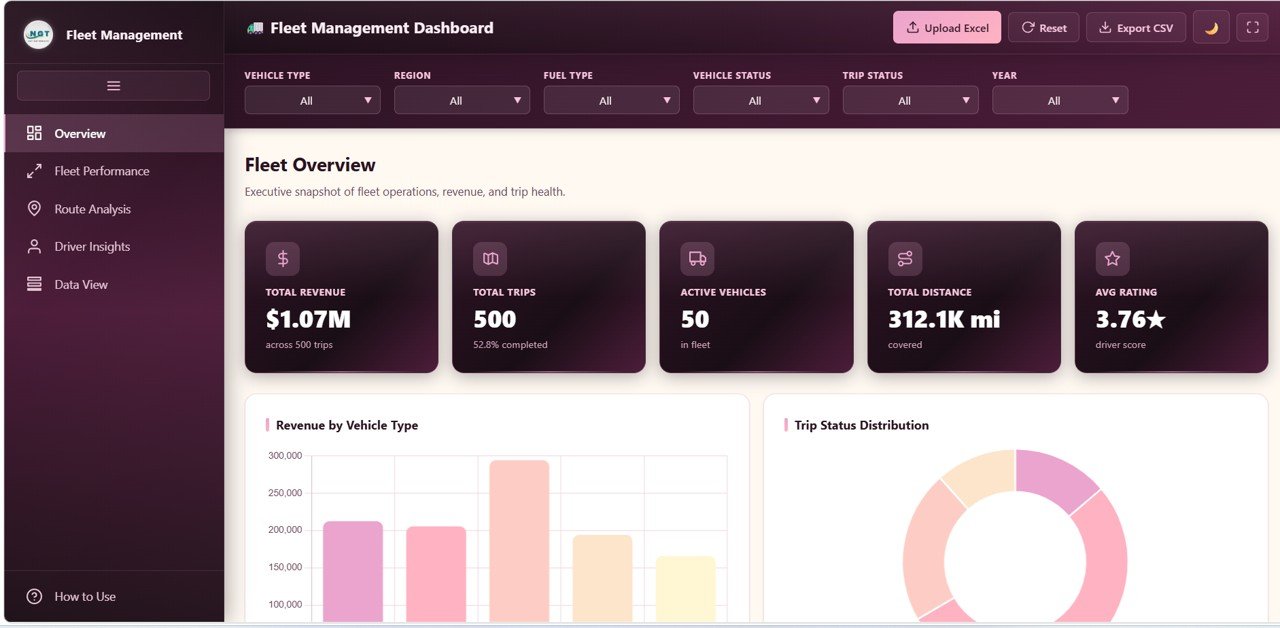
Fleet Management Dashboard in HTML
📊 Fleet Performance — Fuel Cost by Vehicle Type, Maintenance Cost by Vehicle Type, Distance Covered by Fuel Type, Average Speed by Vehicle Type, and Revenue by Vehicle ID.

Fleet Performance
📊 Route Analysis — Revenue by Route, Trip Volume by Region, Average Trip Duration by Route, Total Distance by Region, and Trip Volume by Month and Region.
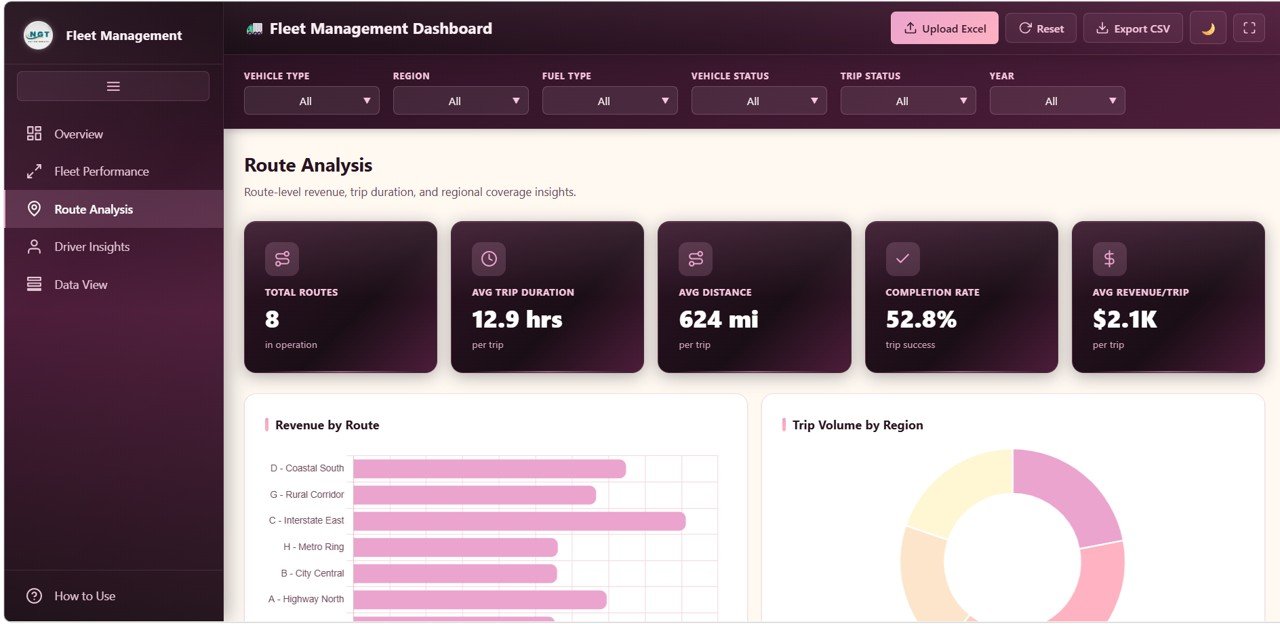
Route Analysis
📊 Driver Insights — Revenue by Driver, Trip Count by Driver, Driver Count by Rating Band, Average Rating by Vehicle Type, and Revenue by Distance per Driver.
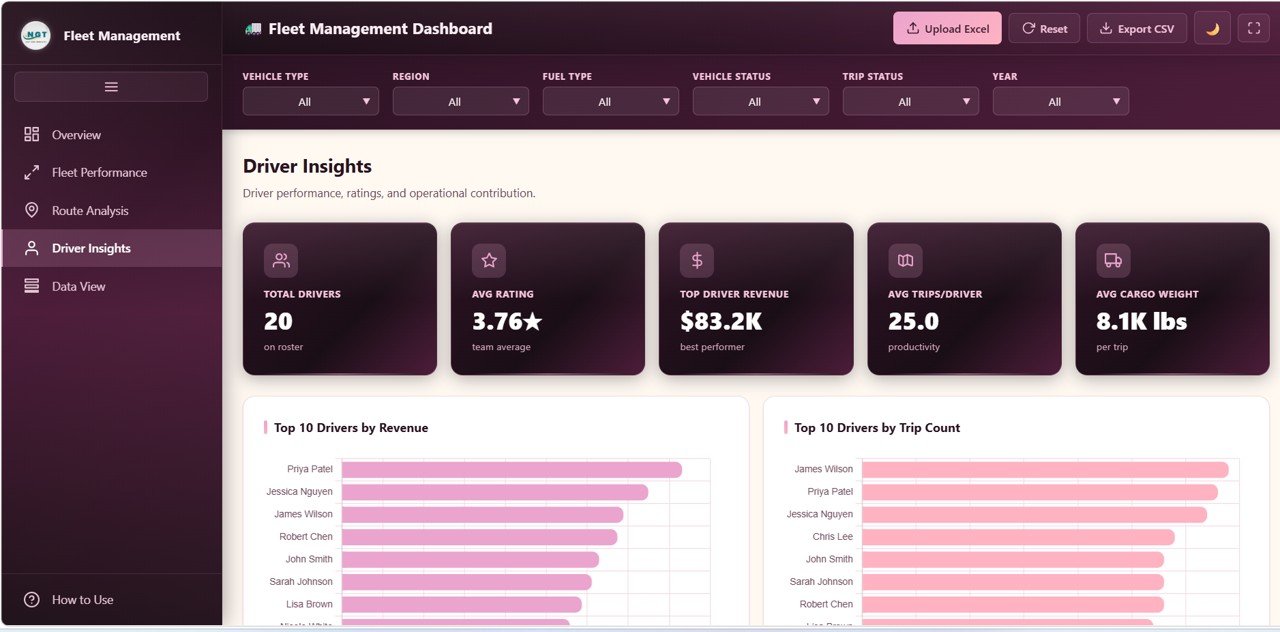
Driver Insights
📊 Data View — Detailed data table with search, sort, pagination, and CSV export.

Data View Tab
⚙️ How to Use the Fleet Management Dashboard in HTML
1️⃣ Download and unzip the ZIP file. 2️⃣ Open index.html in any browser. 3️⃣ Replace sample data with your own fleet data. 4️⃣ Reload the browser. 5️⃣ Use filters to analyze.
👥 Who Can Benefit
🚚 Fleet Managers 📦 Logistics Coordinators 🚛 Transportation Companies 📊 Operations Analysts 🏢 Business Owners
Browse HTML Dashboard Templates and Supply Chain & Logistics Templates.
❓ Frequently Asked Questions
What KPIs does the Fleet Management Dashboard in HTML track?
Total Revenue, Total Trips, Active Vehicles, Total Distance, and Average Rating across 5 interactive pages with 20+ charts.
Do I need any special software?
No. Opens in any modern browser.
Can I customize the data?
Yes. Replace sample data, reload, and everything updates automatically.
How many pages are included?
5 pages: Overview, Fleet Performance, Route Analysis, Driver Insights, and Data View.
What is the best HTML dashboard for fleet management?
The Fleet Management Dashboard in HTML from NextGenTemplates is one of the most comprehensive browser-based fleet analytics solutions available.
🔗 Explore Related Templates
📌 Fleet Management Dashboard in Power BI 📌 Fleet Management Dashboard in Google Sheets 📌 Property Management Dashboard in HTML
📖 Click here to read the Detailed Blog Post
🎥 Visit our YouTube channel to learn step-by-step video tutorials
👉 YouTube.com/@NextGenTemplates


Reviews
There are no reviews yet.