Managing treasury operations today is more challenging than ever. Finance teams must track cash flows, liquidity, debt, investments, and financial risks with precision—yet most organizations still rely on disconnected spreadsheets and time-consuming reports. Treasury Operations KPI Dashboard in Power BI This lack of real-time visibility often leads to delayed decisions, missed risks, and inefficient cash management.
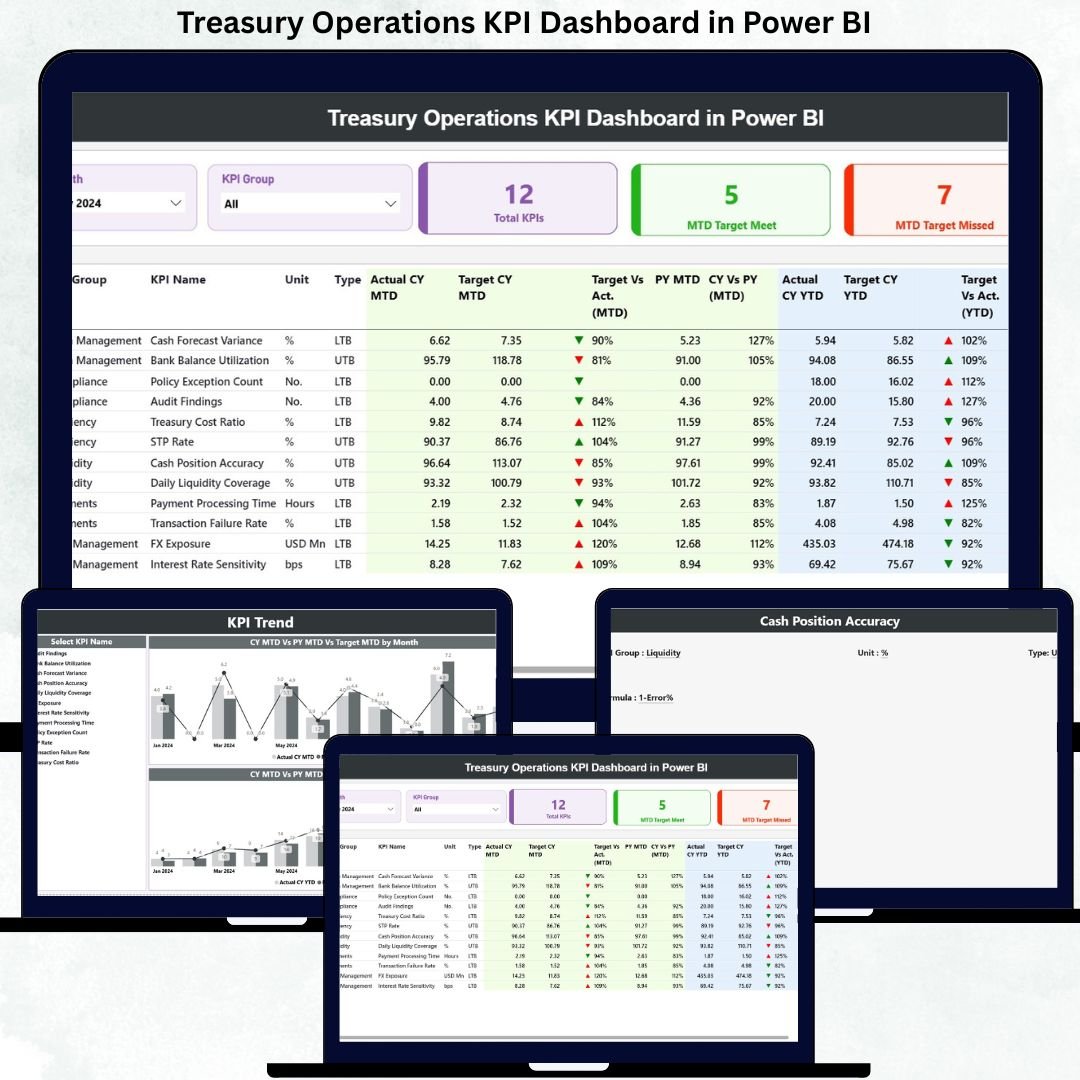
That is exactly why the Treasury Operations KPI Dashboard in Power BI is built—to give treasury teams a single, powerful, and interactive control panel for monitoring performance with confidence.
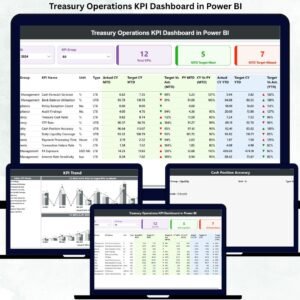
Treasury Operations KPI Dashboard in Power BI This ready-to-use dashboard converts complex treasury data into clear, visual, and actionable insights. By combining Excel-based data entry with Power BI’s interactive analytics, it enables treasury professionals to track MTD and YTD performance, compare Actual vs Target, and analyze Previous Year trends without manual reporting effort. As a result, treasury operations shift from reactive reporting to proactive financial control.
Whether you manage daily cash operations or oversee enterprise-level treasury performance, this dashboard empowers faster decisions, stronger governance, and better financial discipline.
🚀 Key Features of Treasury Operations KPI Dashboard in Power BI
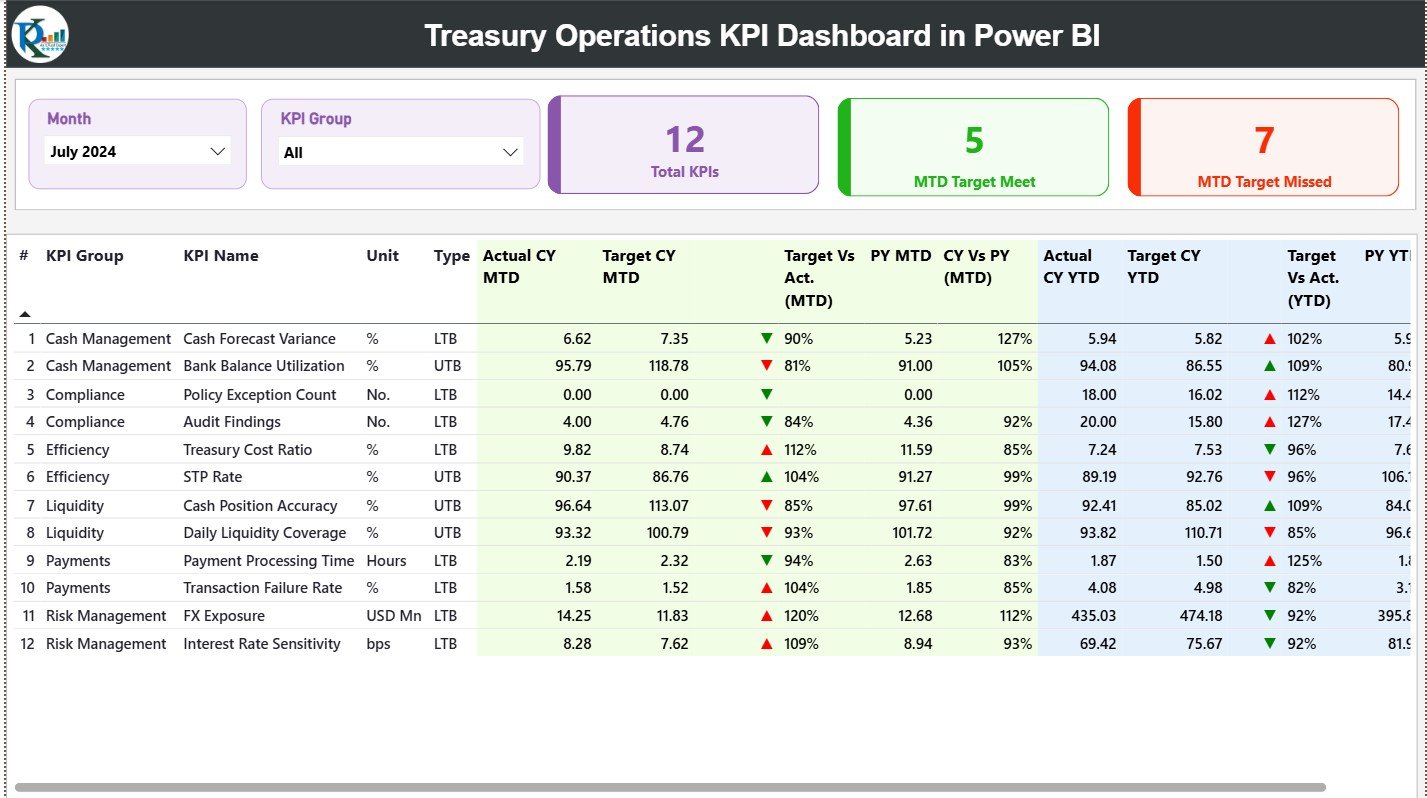
💰 Centralized Treasury Performance View – Monitor all treasury KPIs from one interactive dashboard
📅 Month & KPI Group Slicers – Instantly filter performance by period and category
📊 MTD & YTD Tracking – Analyze short-term execution and long-term performance together
🎯 Target vs Actual Comparison – Clearly identify gaps and overperformance
📉 Previous Year Analysis – Evaluate CY vs PY trends for deeper insight
🔼 Visual Status Indicators – Green and red arrows for quick performance signals
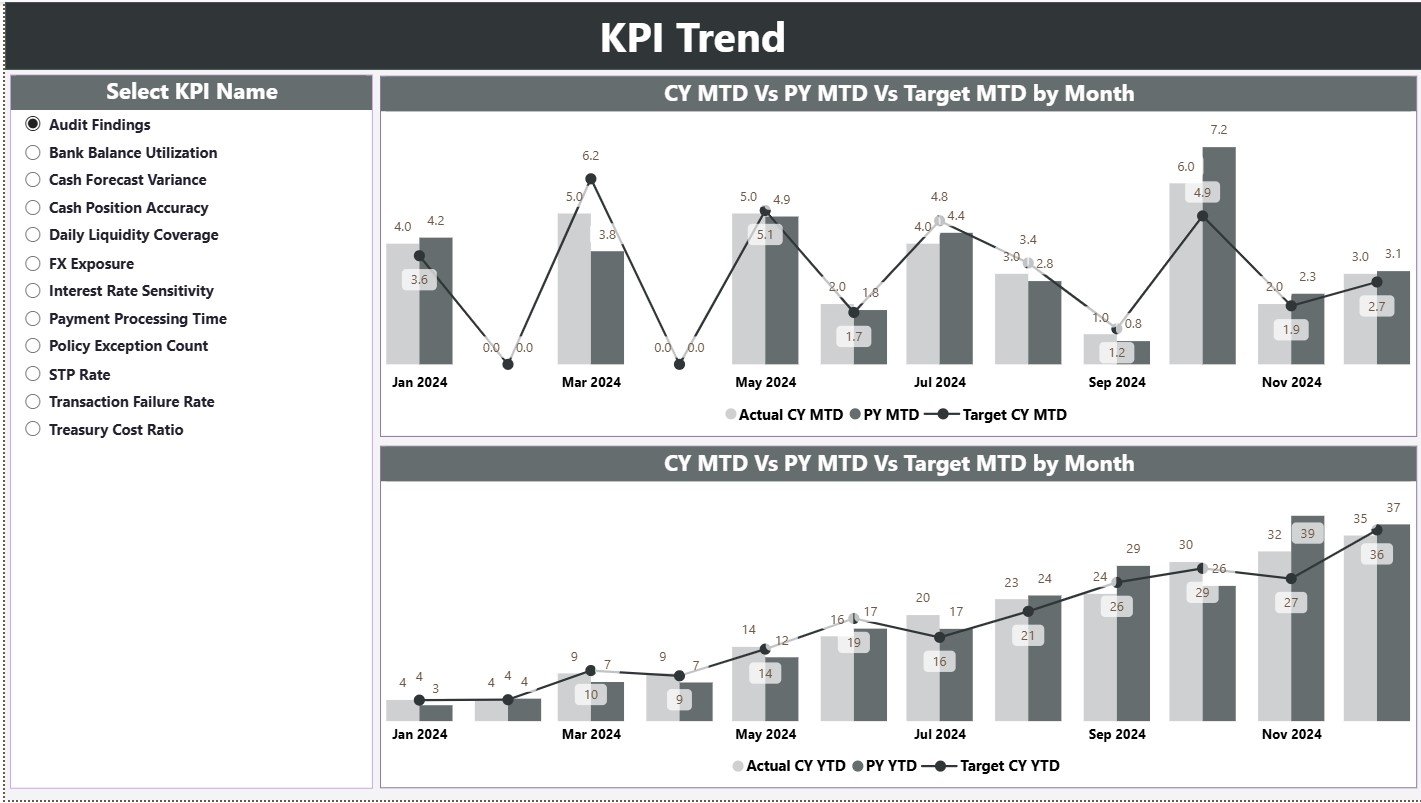
📈 Trend Analysis Page – Track treasury KPI movement over time
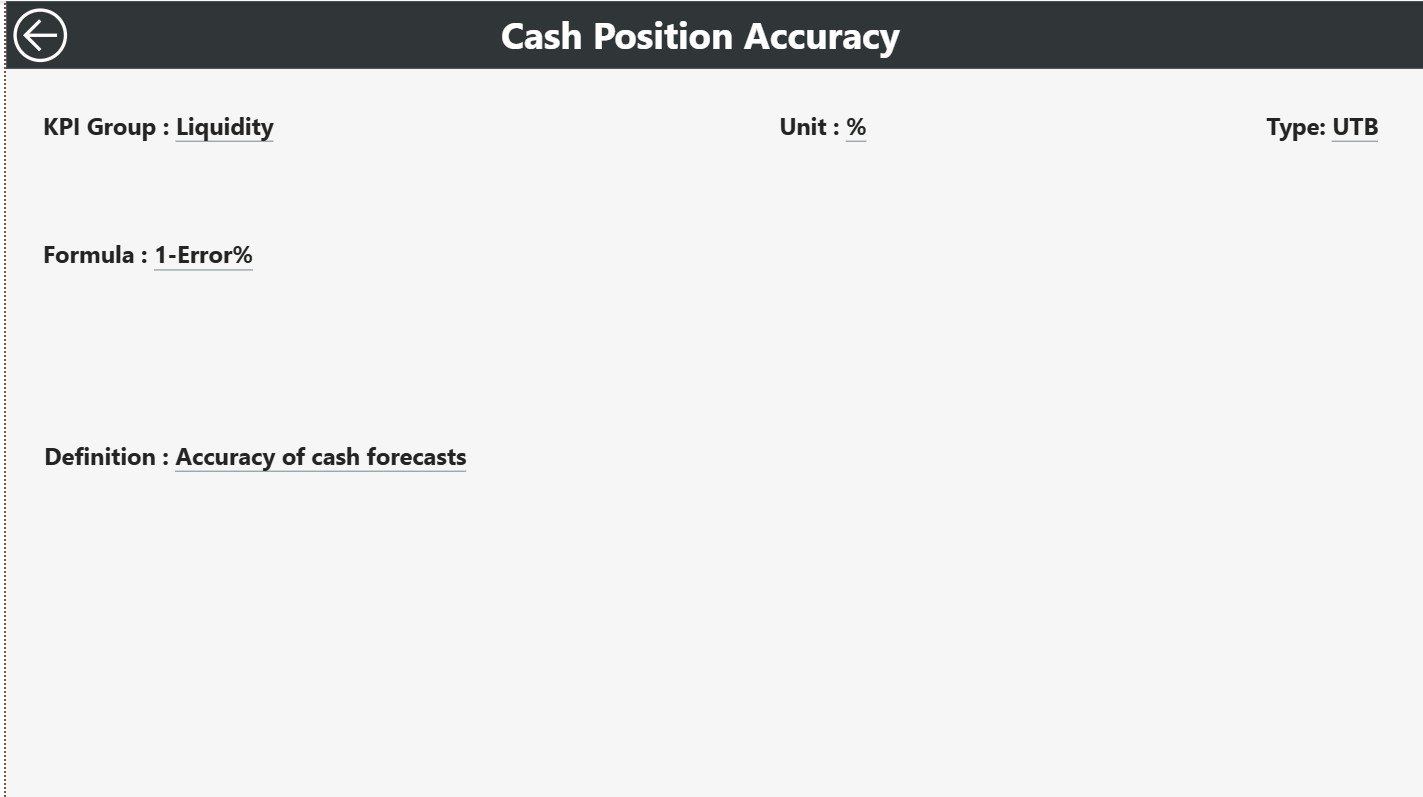
📘 KPI Definition Drill-Through – View KPI formulas, units, and LTB/UTB logic
🔄 Excel-Driven Data Model – Easy updates without advanced Power BI skills
📦 What’s Inside the Treasury Operations KPI Dashboard in Power BI
📁 Power BI Dashboard File (.pixy) with 3 professionally designed pages
📄 Excel Input Template including:
-
Input Actual sheet
-
Input Target sheet
-
KPI Definition sheet
📊 Built-in Calculations for: -
Target vs Actual (MTD & YTD)
-
CY vs PY (MTD & YTD)
📘 Structured KPI Framework with groups, units, formulas, and KPI types
⚙️ Ready-to-Use Design that can be easily customized for any treasury setup
🛠️ How to Use the Treasury Operations KPI Dashboard in Power BI
1️⃣ Enter actual treasury KPI values in the Input Actual Excel sheet
2️⃣ Define performance targets in the Input Target Excel sheet
3️⃣ Maintain clear KPI logic in the KPI Definition sheet
4️⃣ Open the Power BI file and refresh the data
5️⃣ Use slicers to analyze performance by Month and KPI Group
6️⃣ Drill into trends and KPI definitions for deeper understanding
No complex setup or advanced Power BI expertise required—simple Excel updates keep everything running.
👥 Who Can Benefit from This Treasury Operations KPI Dashboard in Power BI
🏦 Treasury Managers – Gain full visibility into cash and liquidity performance
📊 Finance Controllers – Track targets, trends, and governance metrics
💵 Cash Management Teams – Monitor efficiency and utilization
⚠️ Risk Management Professionals – Identify deviations early
📈 CFOs & Finance Leaders – Support data-driven financial decisions
📑 Business & Financial Analysts – Reduce manual reporting workload
🔗 Click here to read the Detailed Blog Post
🎥 Visit our YouTube Channel to learn step-by-step video tutorials


Reviews
There are no reviews yet.