

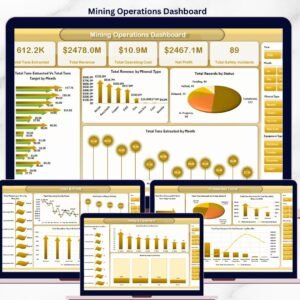
The Integrated Mining Operations Dashboard in Google Sheets brings 4 headline KPI cards (Total Cost, Revenue, Profit, Processing Cost), 20 pre-built charts and 5 interactive analysis pages into one connected Google Sheets file. Slicers at the top of every page let you filter by mine site, company, equipment type, ore type or country and watch every chart and card recalculate instantly.
🌍 Join 8,400+ teams in 40+ countries using NextGenTemplates to replace paid SaaS tools with one-time-purchase Excel, Google Sheets, Power BI and HTML templates.Integrated Mining Operations Dashboard in Google Sheets
✅ Instant download · One-time payment · No subscription · No per-user fees · Lifetime access
🔑 Key Features of the Integrated Mining Operations Dashboard in Google Sheets
📊 This dashboard tracks 4 financial KPIs — Total Cost, Revenue, Profit and Processing Cost — and renders 20 charts spread across 5 analysis pages covering production, downtime, safety, ESG and profitability.
🎚️ Every page carries slicers so you can isolate a single mine site, company, ore type, department or piece of equipment and the whole view filters together in real time.
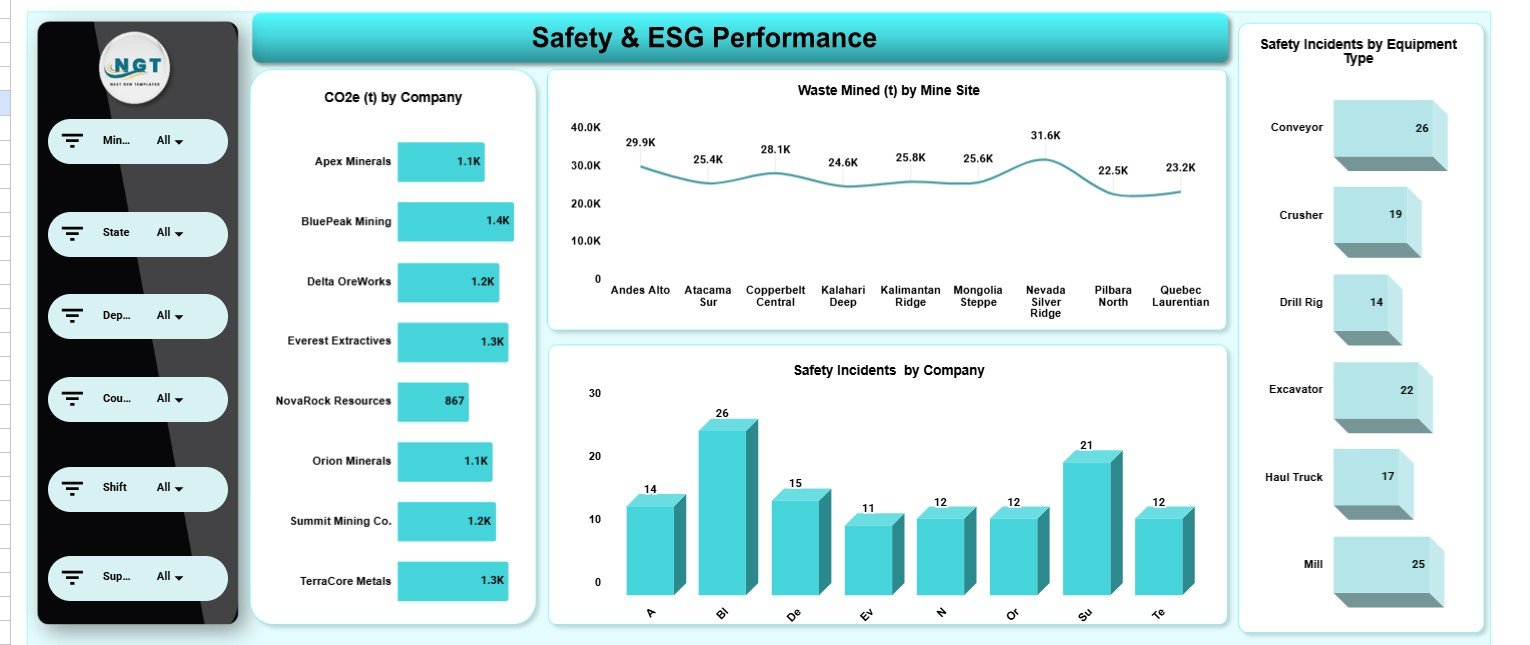
🌱 A dedicated Safety & ESG page reports CO2e (t) by company, safety incidents by company and by equipment type, and waste mined by mine site — the exact metrics auditors and ESG reporting frameworks ask for.
⚙️ Because it is built on native Google Sheets, there are no add-ons or macros to install; it opens in any browser on desktop or mobile and shares with your team through a single Google Drive link.
🔄 Replace the rows on the Data sheet with your own production records and every card, chart and slicer updates automatically — no formula editing required.
📦 What’s Inside the Integrated Mining Operations Dashboard in Google Sheets
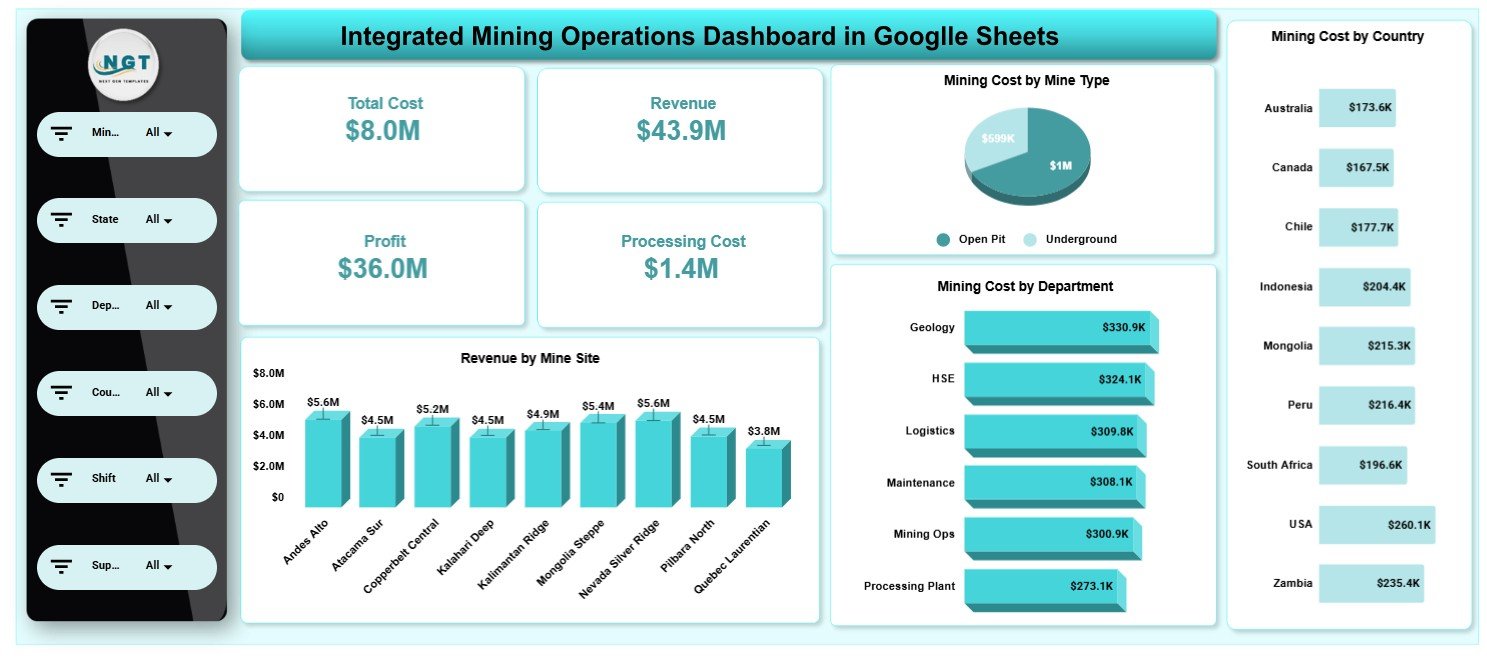
Page 1: Overview
The Overview page shows four high-level KPI cards — Total Cost, Revenue, Profit and Processing Cost — above charts for Mining Cost by Mine Type, Mining Cost by Department, Mining Cost by Country and Revenue by Mine Site. Slicers let you filter the entire page instantly.
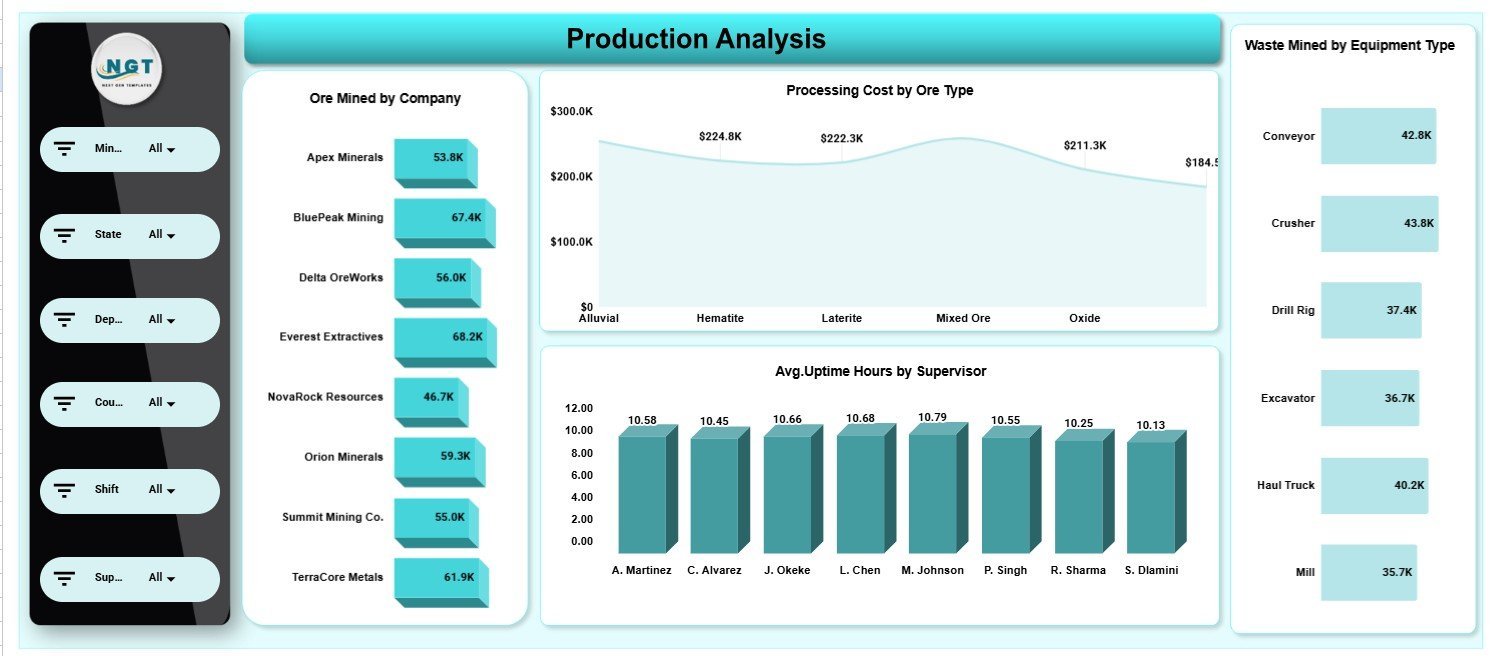
Page 2: Production Analysis
This page breaks down output and efficiency with Ore Mined by Company, Processing Cost by Ore Type, Avg. Uptime Hours by Supervisor and Waste Mined by Equipment Type — so you can see which crews and machines deliver the most usable ore.

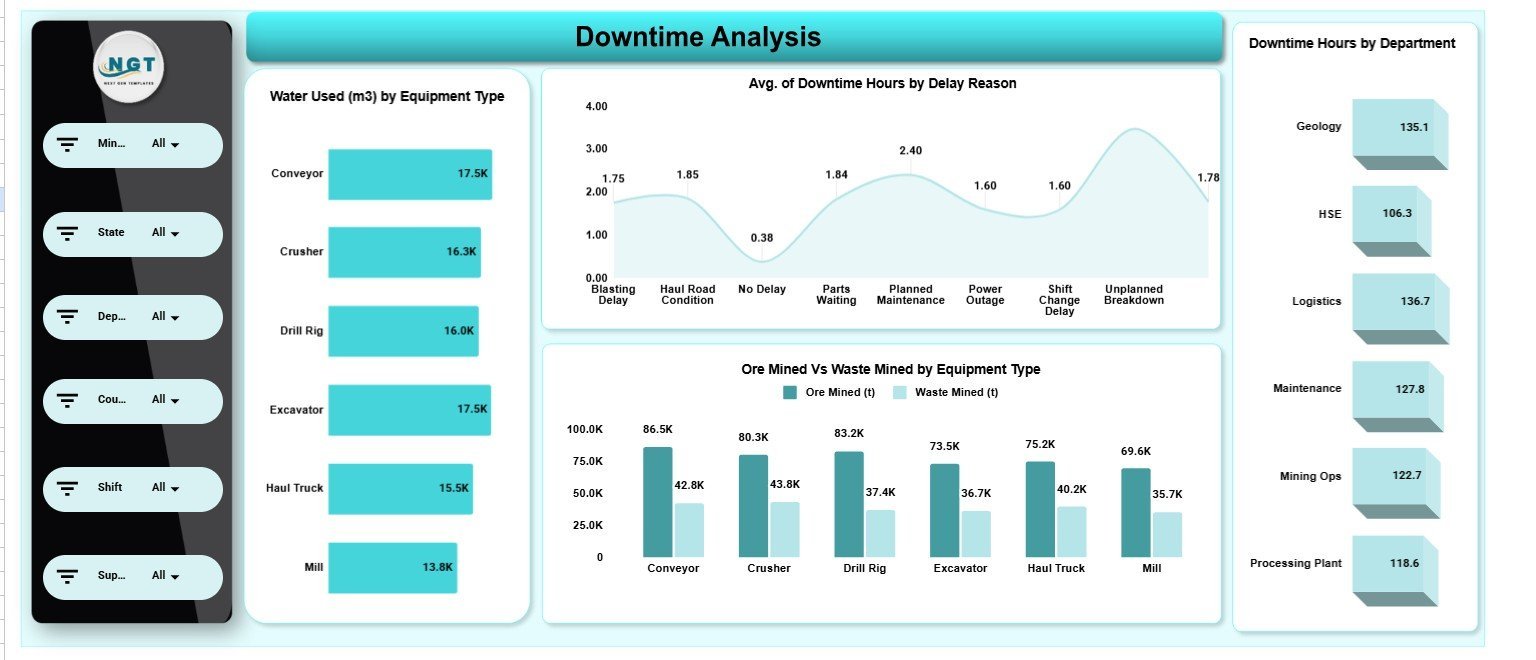
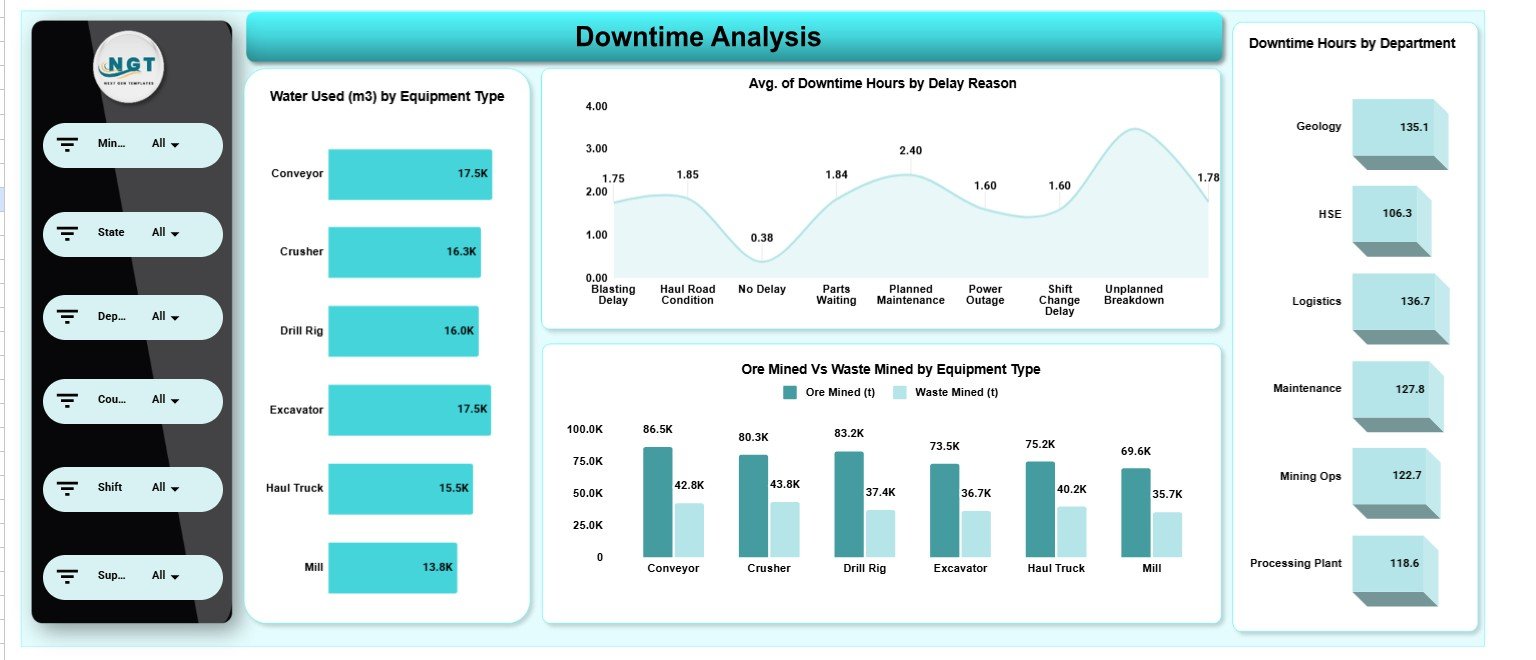
Page 3: Downtime Analysis
The Downtime Analysis page tracks Water Used (m3) by Equipment Type, Avg. of Downtime Hours by Delay Reason, Ore Mined vs Waste Mined by Equipment Type and Downtime Hours by Department, pinpointing where lost hours and resource use concentrate.
Page 4: Safety & ESG Performance
This page reports CO2e (t) by Company, Waste Mined (t) by Mine Site, Safety Incidents by Company and Safety Incidents by Equipment Type — the core environmental, social and governance metrics for mining compliance reporting.
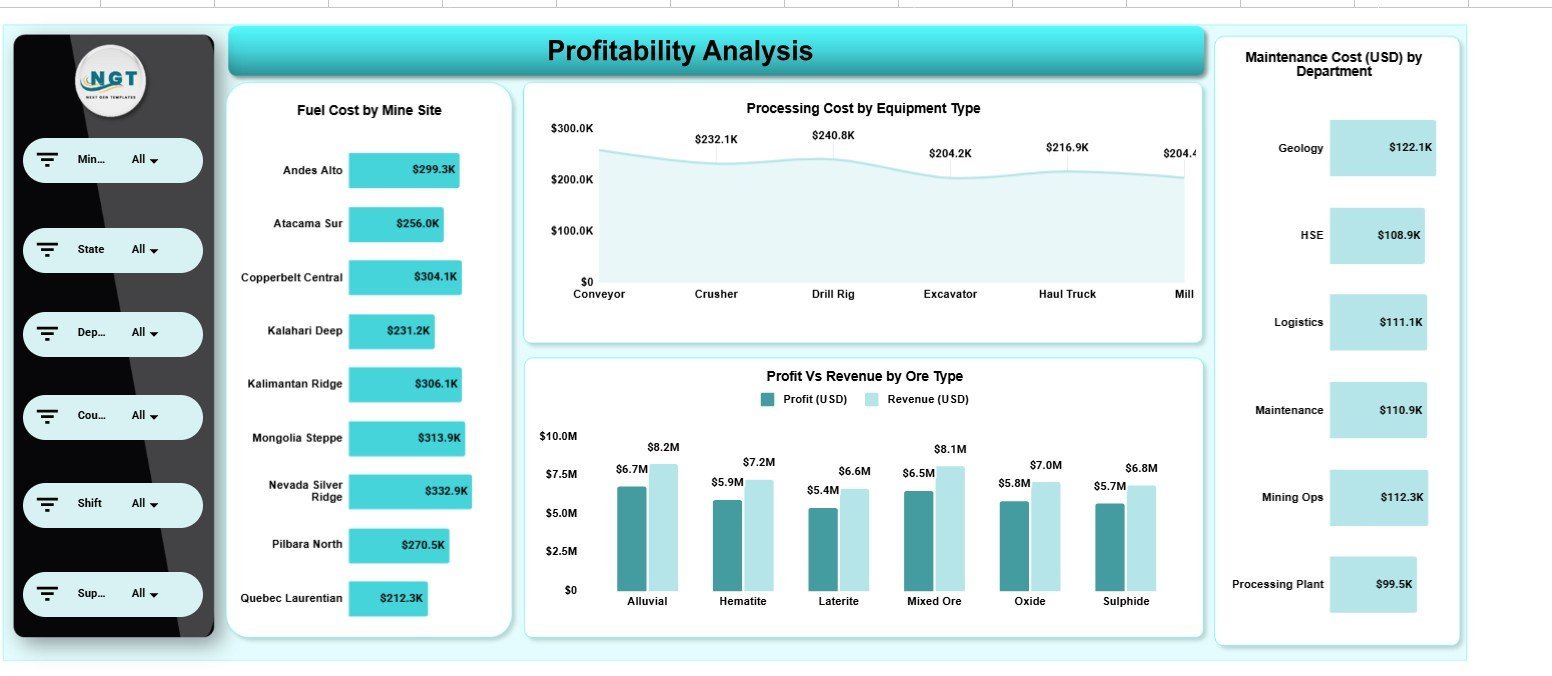
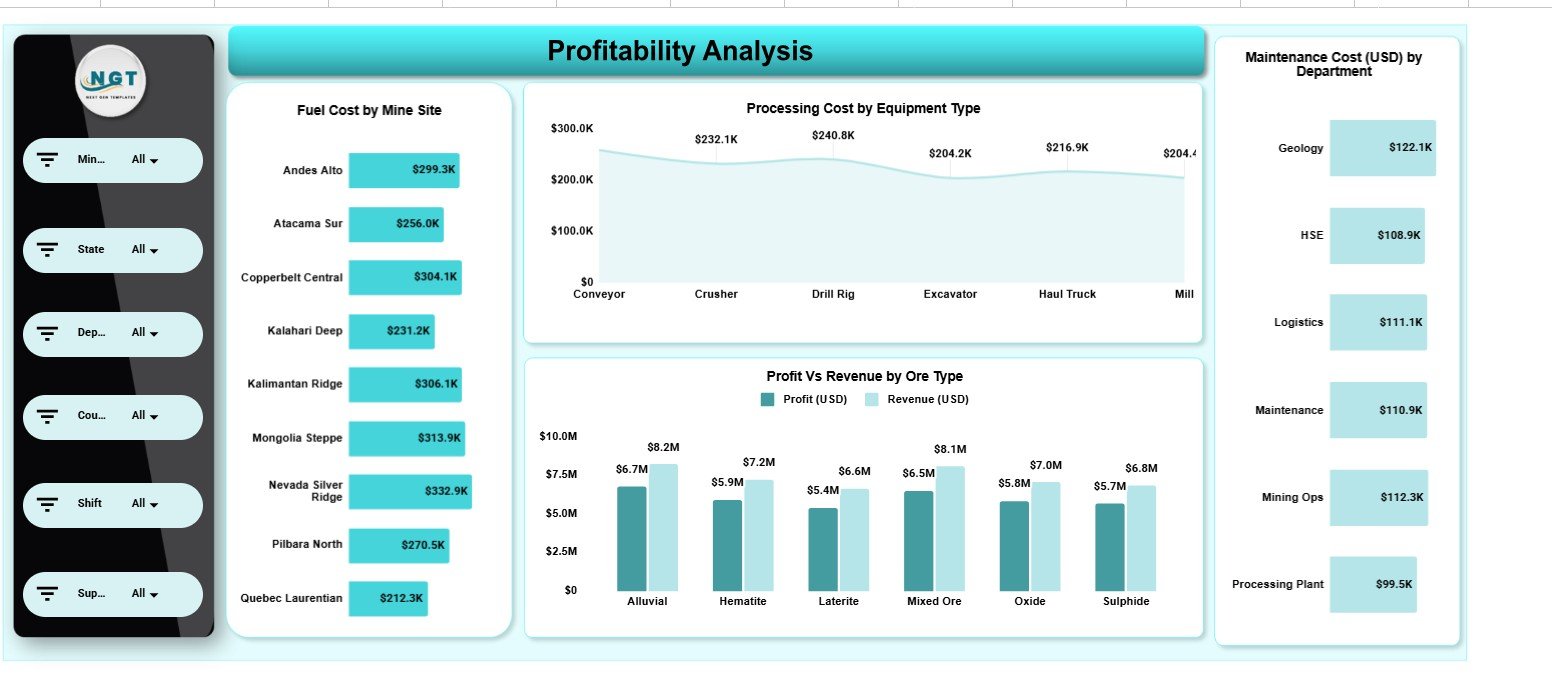
Page 5: Profitability Analysis
The Profitability Analysis page links cost and return with Fuel Cost by Mine Site, Processing Cost by Equipment Type, Profit vs Revenue by Ore Type and Maintenance Cost (USD) by Department, showing which sites and ore types actually drive margin.
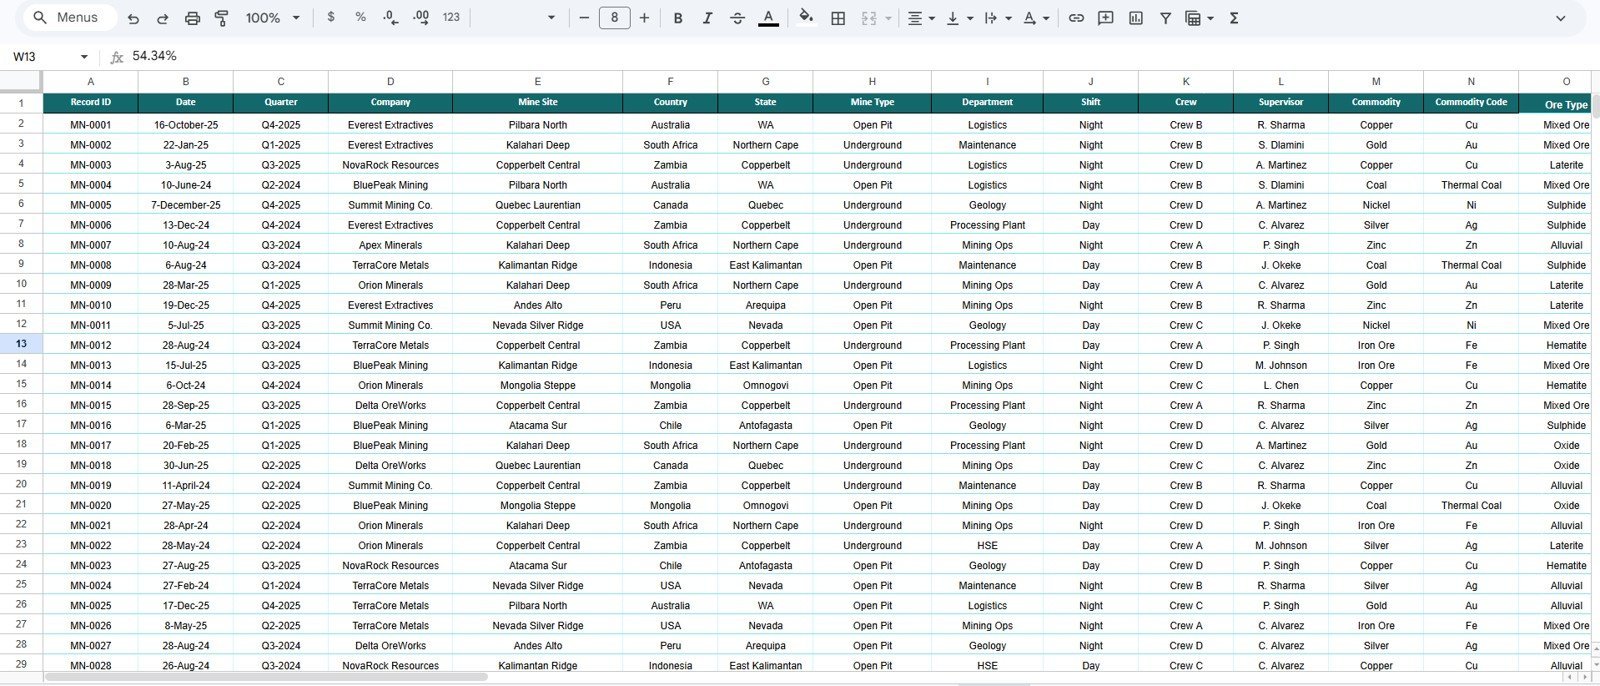
Data Sheet
The Data sheet holds every record in a clean, structured format. Add your own mining operations data in the same column layout and all five analysis pages, KPI cards and slicers refresh automatically.
📊 Integrated Mining Operations Dashboard in Google Sheets vs Microsoft Excel vs Paid BI SaaS — Where This Fits
| Feature | Integrated Mining Operations Dashboard (Google Sheets) | Microsoft Excel Dashboard | Paid BI SaaS (Tableau / Power BI Premium) |
|---|---|---|---|
| Cost | $9.99 one-time | $10–25 one-time + Office licence | $15–75 / user / month |
| Platform | Native Google Sheets (browser) | Desktop Excel | Cloud BI platform |
| Setup time | Under 10 minutes ✅ | Under 15 minutes | Days to weeks |
| Real-time team collaboration | Built in ✅ | Limited | ✅ |
| Mobile access | Any browser ✅ | Excel mobile only | ✅ |
| Slicer filtering | On every page ✅ | ✅ | ✅ |
| Share with a link | ✅ Google Drive link | File transfer needed | ✅ |
| Year-1 cost at 5 users | $9.99 total ✅ | Office licences ×5 | $900–4,500 |
For mining teams that want a connected production, cost, safety and ESG view without paying per-user BI fees, the Integrated Mining Operations Dashboard in Google Sheets sits in the sweet spot.
👥 Who This Template Is For — and Who It’s Not For
✅ This template is built for:
- Mine managers and operations leads tracking cost, output and uptime across multiple sites
- HSE and ESG officers reporting CO2e, safety incidents and waste
- Finance and cost controllers analysing profit, fuel and maintenance by site and ore type
- Small and mid-size mining and quarrying operators who want analytics without a BI subscription
❌ This template is NOT for:
- Enterprises needing a live IoT/SCADA feed from sensors into the dashboard
- Teams requiring row-level security, SSO and audit logging across thousands of users
- Operations that cannot use Google Workspace at all
⚙️ How to Use the Integrated Mining Operations Dashboard in Google Sheets
- Open the PDF in your download and click the Google Sheets copy link to create your own editable copy in Google Drive.
- Go to the Data sheet and replace the sample rows with your own mining records, keeping the same column order.
- Return to the Overview page — the 4 KPI cards and charts update automatically.
- Use the slicers on any page to filter by mine site, company, equipment type, ore type or country.
- Review the Production, Downtime, Safety & ESG and Profitability pages and share the file with your team via a Google Drive link.
💼 Real-World Use Cases
Daniel runs operations for a three-site aggregates company. He uses the Integrated Mining Operations Dashboard in Google Sheets to compare Mining Cost by Mine Type and Revenue by Mine Site each month, then drills into Downtime Hours by Department to decide where to add a maintenance shift.
Priya is the HSE lead at a metals miner. She filters the Safety & ESG page by company to report CO2e (t) and Safety Incidents by Equipment Type to her board — without paying for a separate ESG platform.
Marcus is a cost controller at a coal operation. He uses the Profitability Analysis page to see Profit vs Revenue by Ore Type and Maintenance Cost by Department, spotting the ore types that quietly erode margin.
❓ Frequently Asked Questions
What KPIs does the Integrated Mining Operations Dashboard in Google Sheets track?
The Integrated Mining Operations Dashboard in Google Sheets tracks 4 headline KPIs — Total Cost, Revenue, Profit and Processing Cost — plus 20 charts covering production, downtime, fuel, maintenance, safety incidents, CO2e and waste across companies, sites and equipment.
Do I need Excel or any add-ons to use it?
No. The Integrated Mining Operations Dashboard in Google Sheets runs natively in Google Sheets with no add-ons or macros. You only need a free Google account and any modern browser on desktop or mobile.
How long does setup take?
Setup takes under 10 minutes. Make your own copy of the Integrated Mining Operations Dashboard in Google Sheets, paste your records into the Data sheet in the same format, and every card, chart and slicer recalculates automatically.
How does this compare to a paid BI tool like Tableau or Power BI Premium?
Paid BI platforms cost $15–75 per user each month. The Integrated Mining Operations Dashboard in Google Sheets is a one-time $9.99 purchase with no per-user fees, covering production, cost, safety, ESG and profitability in one shareable file.
Can my whole team use it at once?
Yes. Because the Integrated Mining Operations Dashboard in Google Sheets lives in Google Drive, multiple team members can view and edit it together in real time, and you can share it with a single link.
Can I customise the charts and add my own mine sites?
Yes. The Integrated Mining Operations Dashboard in Google Sheets is fully editable. Add new mine sites, companies, ore types or equipment to the Data sheet and the slicers and charts expand to include them.
👤 About the Author
Built by PK — Microsoft Certified Professional with 15+ years of Excel, Google Sheets and Power BI experience. Founder of NextGenTemplates, reaching 300K+ subscribers across YouTube channels (@PK-AnExcelExpert, @NextGenTemplates, @NeoTechNavigators). Every template is hand-built and tested before release.
🔗 Explore Related Templates
Browse more Google Sheets Dashboards or stay in the mining family:
- Mining Dashboard in Google Sheets — a lighter mining analytics view in Google Sheets.
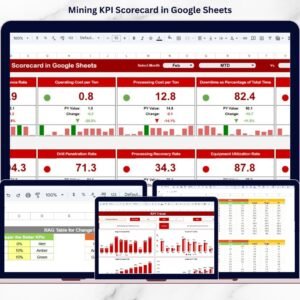
- Mining KPI Scorecard in Google Sheets — actual-vs-target scorecard for mining KPIs.
- Supply Chain Management Dashboard in Google Sheets — extend analytics downstream of the pit.
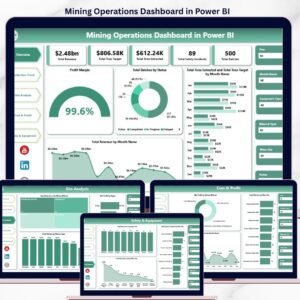
Also available as: Mining Operations Dashboard in Power BI and Mining Operations Dashboard in Excel.
📖 Click here to read the Detailed Blog Post<
Watch the step-by-step video Demo:
🎥 Visit our YouTube channel for step-by-step video tutorials
👉 YouTube.com/@NextGenTemplates
📅 Last updated: June 2026


Reviews
There are no reviews yet.