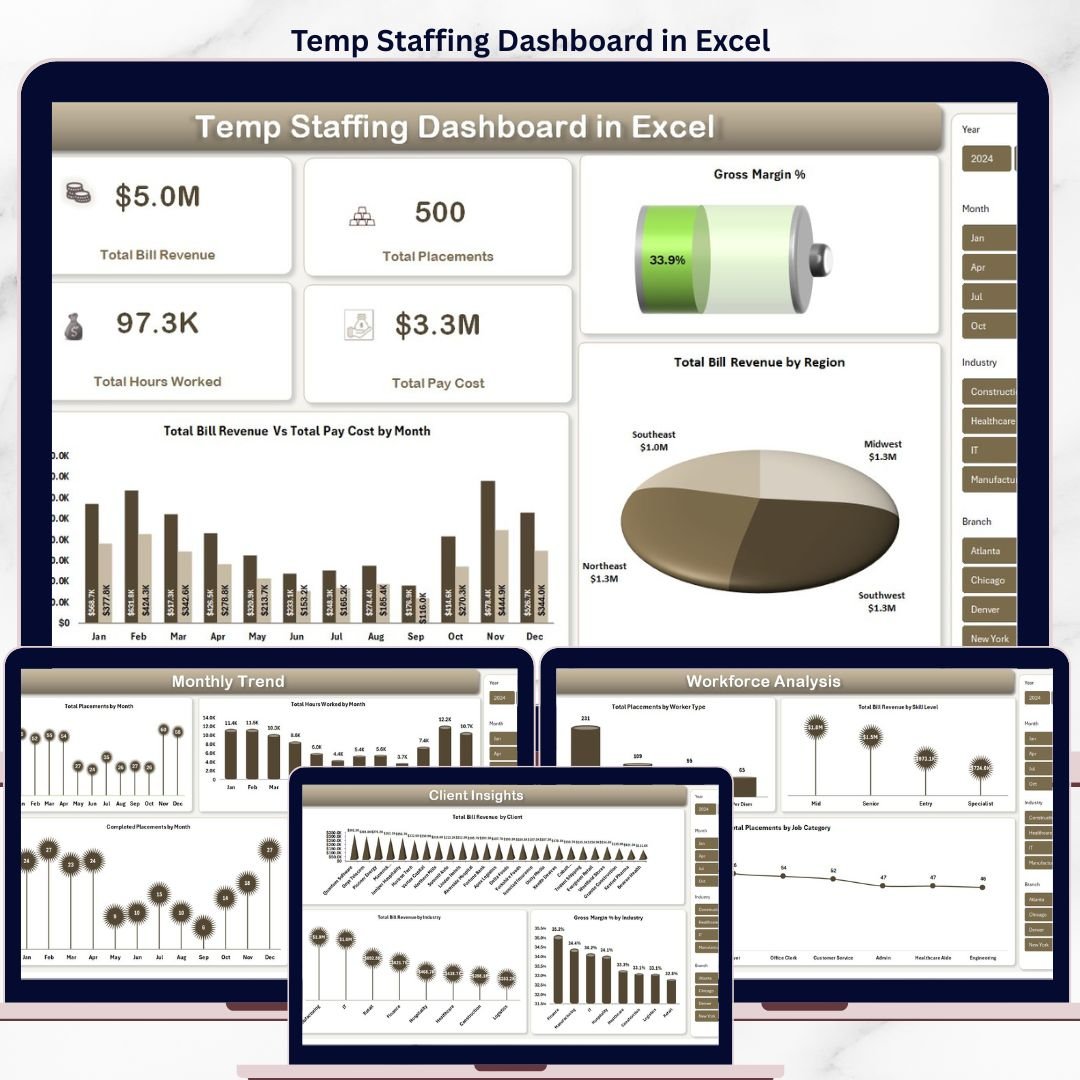


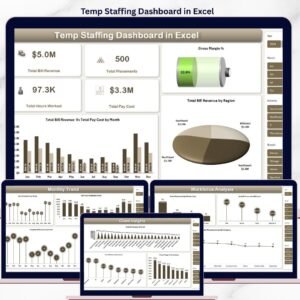
The Temp Staffing Dashboard in Excel tracks 5 headline KPIs and 16 dynamic charts across 5 interactive analysis pages, all driven by pivot tables and slicers. Replace the sample data and the entire workbook refreshes in under 10 minutes — no formulas to rebuild, no macros to enable.
🌍 Join 8,400+ teams in 40+ countries using NextGenTemplates to replace paid SaaS tools with one-time-purchase Excel, Google Sheets, Power BI, and HTML templates.
✅ Instant download · One-time payment · No subscription · No per-user fees · Lifetime access
🔑 Key Features of the Temp Staffing Dashboard in Excel
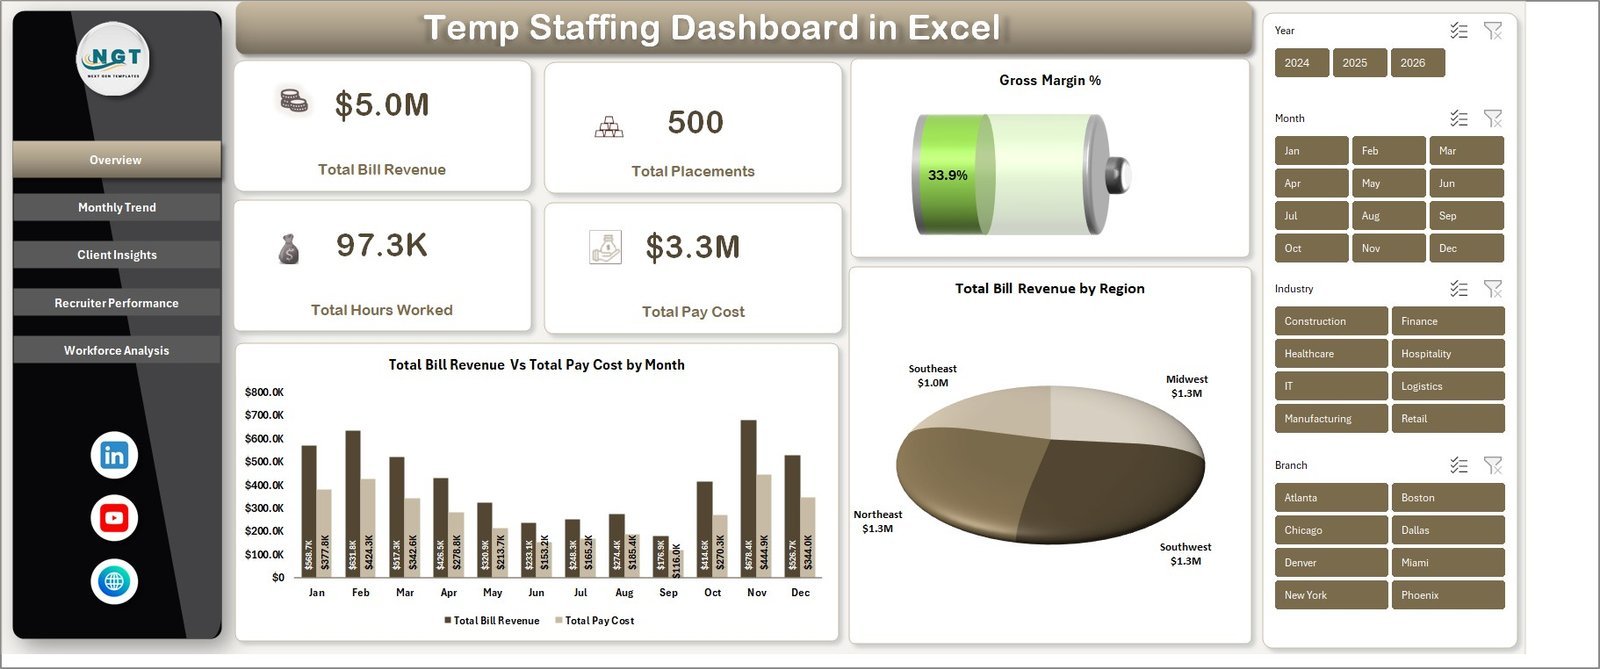
📊 5 KPI cards on the Overview page — Total Bill Revenue, Total Placements, Total Hours Worked, Total Pay Cost, and Gross Margin % — give you a one-screen view of agency performance the moment the file opens.
📈 16 pivot-driven charts across 5 analysis pages covering monthly trends, client and industry profitability, recruiter productivity, and workforce composition by skill level, worker type, and job category.
🔄 Multiple slicers on every page let you filter by region, client, industry, recruiter, worker type, or skill level — every visual refreshes instantly with no formula edits.
🛠️ No VBA, no macros, no add-ins — works in Excel 2016, 2019, 2021, 365, and Excel for Mac. Pivot-table powered Support Sheet refreshes the entire dashboard with one click on Data → Refresh All.

Temp Staffing Dashboard in Excel
📦 What’s Inside the Temp Staffing Dashboard in Excel
📌 Overview Page — 5 KPI cards plus Total Bill Revenue Vs Total Pay Cost by Month and Total Bill Revenue by Region charts. Slicers filter the entire dashboard.
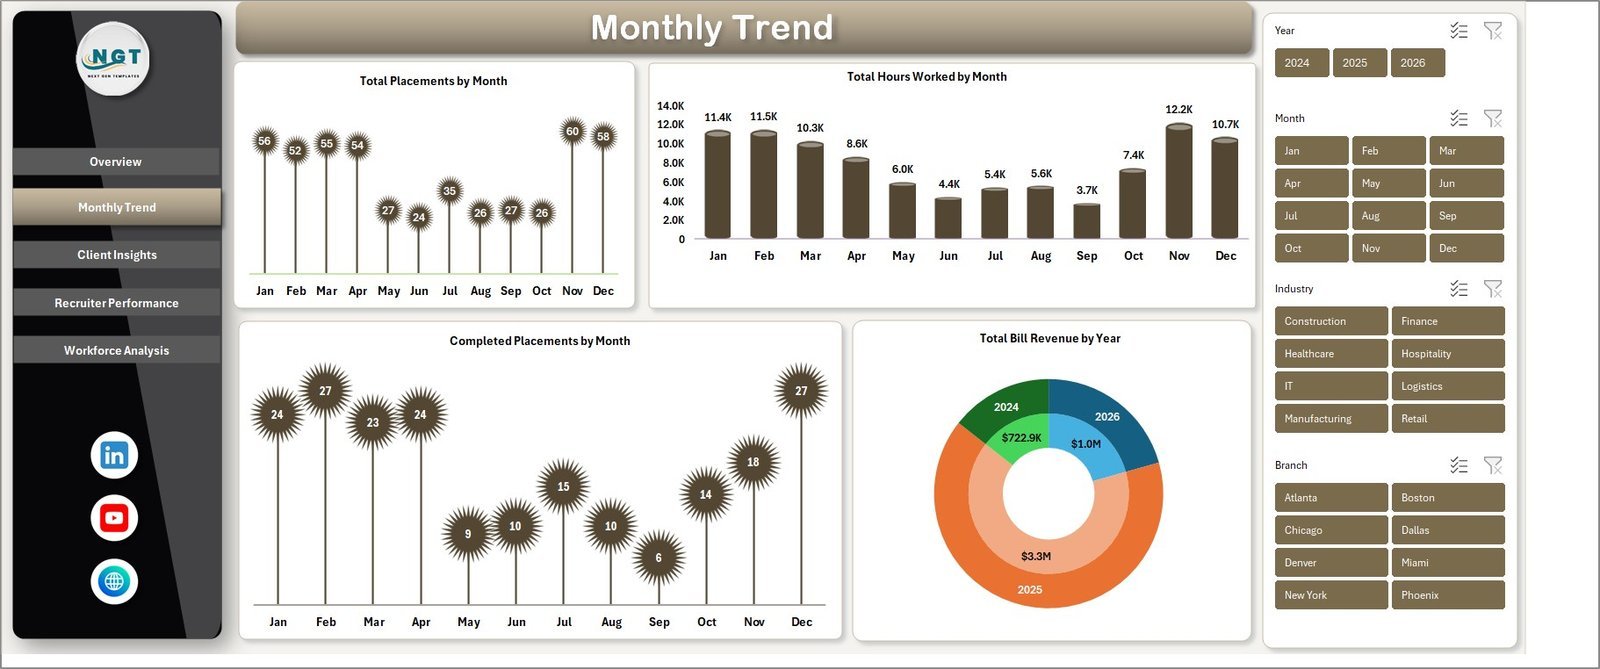
📌 Monthly Trend — Total Placements by Month, Total Hours Worked by Month, Completed Placements by Month, and Total Bill Revenue by Year. Spot seasonality and capacity gaps.

Monthly Trend
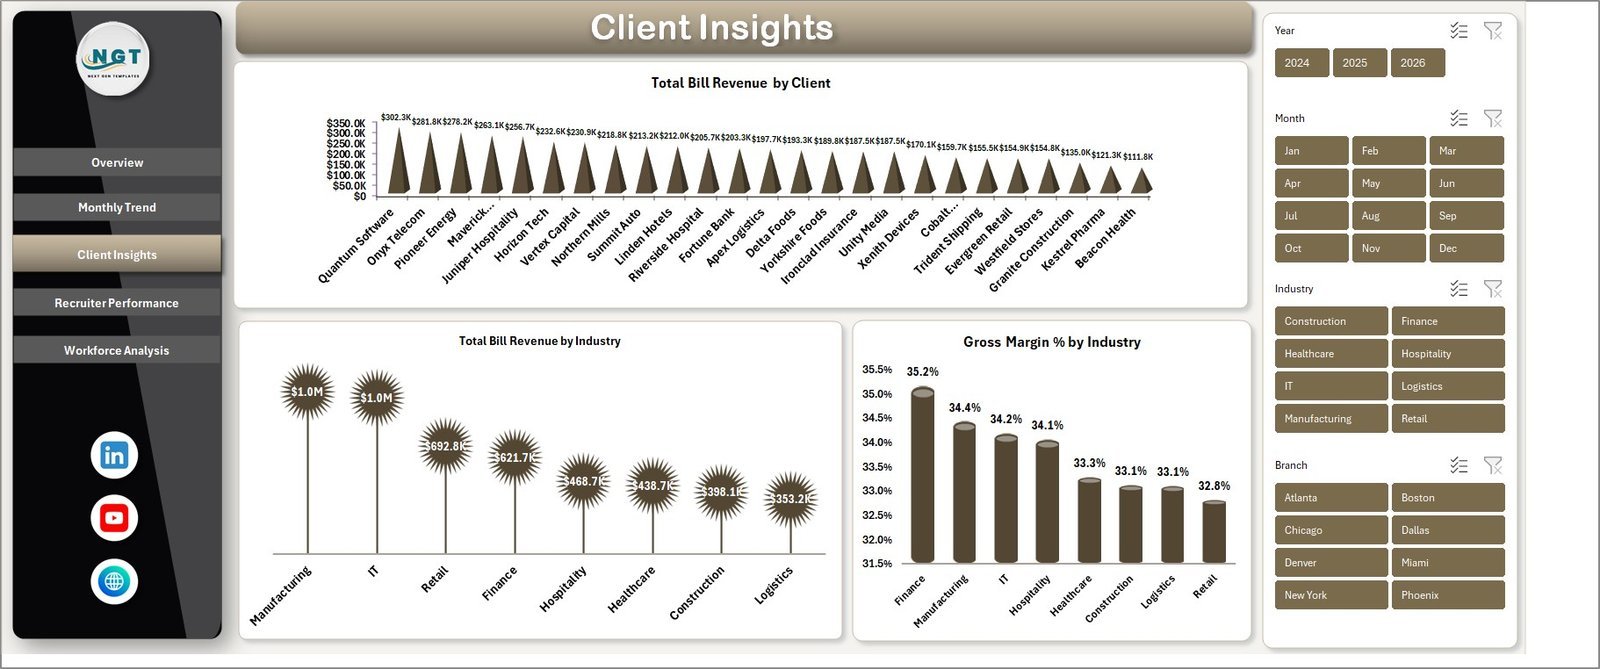
📌 Client Insights — Total Bill Revenue by Client, Total Bill Revenue by Industry, and Gross Margin % by Industry. Identify which accounts and verticals carry the highest profit margin.

Client Insights
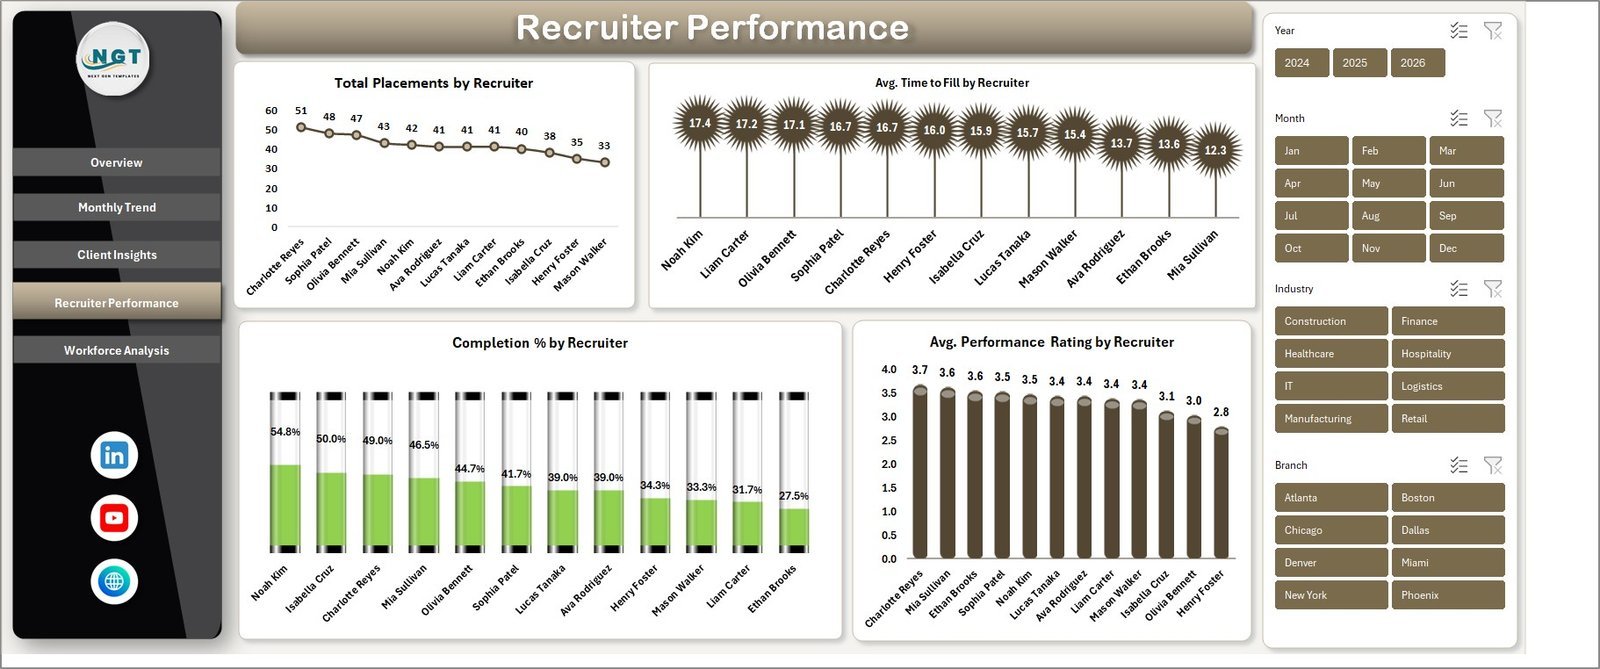
📌 Recruiter Performance — Total Placements by Recruiter, Avg. Time to Fill, Completion %, and Avg. Performance Rating by Recruiter. Coach and reward with the same data.

Recruiter Performance
📌 Workforce Analysis — Total Placements by Worker Type, Total Bill Revenue by Skill Level, and Total Placements by Job Category.
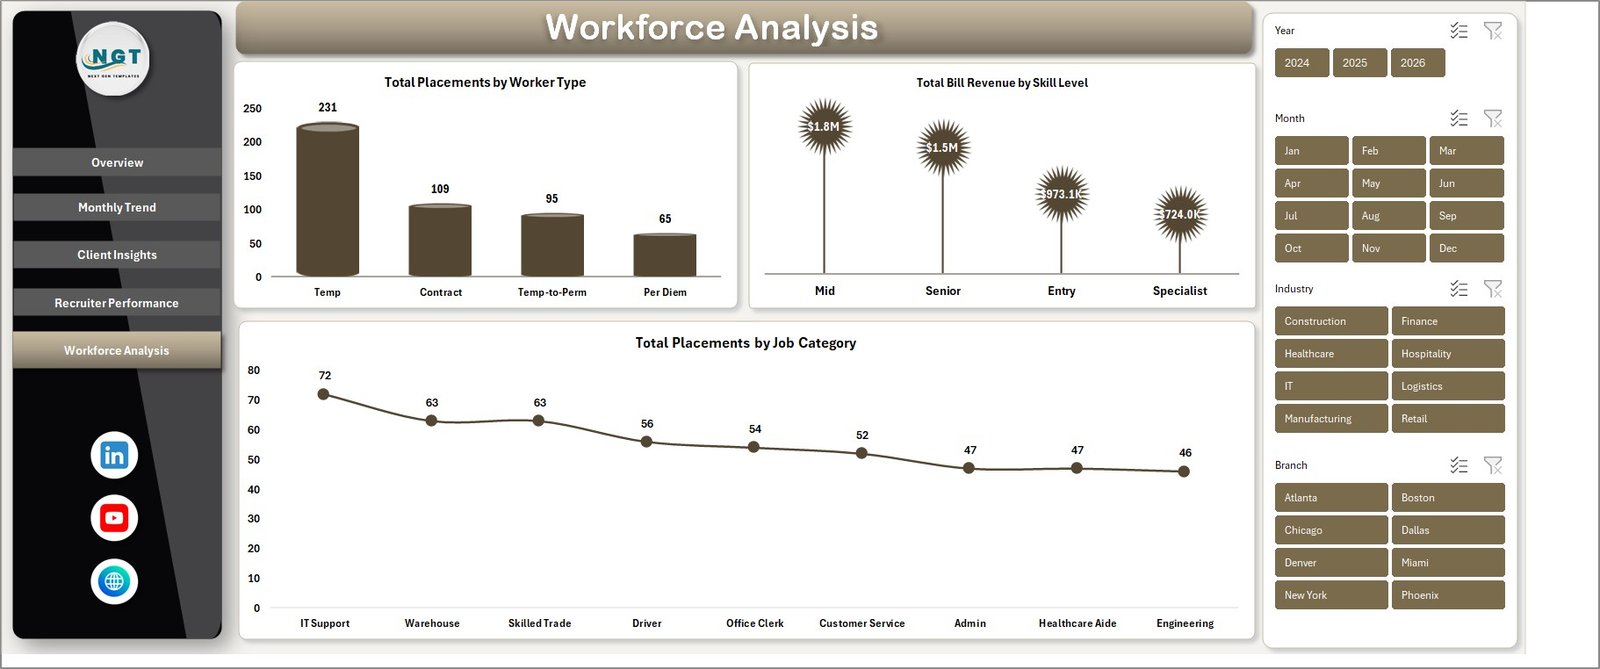
Workforce Analysis
📌 Data Sheet — central data entry. Add temp placement records in the same column format and every page updates after a refresh.
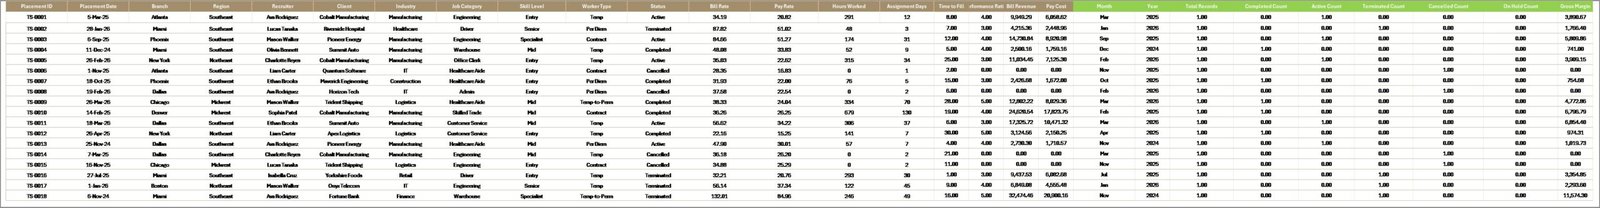
Data Sheet tab
📌 Support Sheet — holds every pivot table powering the dashboard. Hide it once setup is complete.
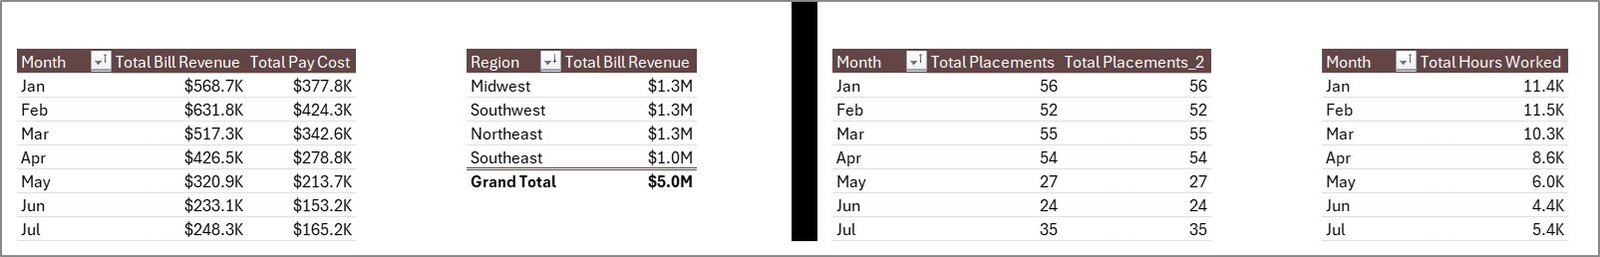
Support sheet tab
📊 Temp Staffing Dashboard in Excel vs. Google Sheets vs. Bullhorn / Avionté — Where This Fits
| Feature | Temp Staffing Dashboard in Excel | Google Sheets Equivalent | Bullhorn / Avionté / TempWorks |
|---|---|---|---|
| Cost | $17.99 one-time ✅ | $9.99 one-time | $99–$200 / user / month |
| Platform | Microsoft Excel (offline) ✅ | Google Sheets (cloud) | Web SaaS |
| Setup time | Under 10 minutes ✅ | Under 10 minutes | 2–6 weeks |
| Real-time team collaboration | Via OneDrive / SharePoint | ✅ Native multi-user | ✅ Native multi-user |
| Mobile access | Excel mobile app | ✅ Browser / Sheets app | ✅ iOS / Android |
| Pivot-driven slicers | ✅ Built-in | Pivot tables only | Built-in dashboards |
| Customizable fields | ✅ Full edit access | ✅ Full edit access | Limited / admin-only |
| Year-1 cost at 5 users | $17.99 total ✅ | $9.99 total | $5,940–$12,000+ |
For agencies that want recruiter-level and client-level profitability tracking without paying $99+ per user per month, the Temp Staffing Dashboard in Excel sits in the sweet spot.
👥 Who This Template Is For — and Who It’s Not For
✅ Built for:
- Owners and operations leads at temp / contract staffing agencies (5–100 internal staff)
- Recruitment managers tracking weekly placement and bill rate metrics
- Branch managers running multi-region temp desks who need by-region revenue splits
- Finance teams calculating gross margin on bill rate vs. pay rate
❌ NOT for:
- Enterprise staffing groups needing SOC 2, SSO, and audit logs — choose Bullhorn or Avionté
- Agencies needing automated VMS / MSP integrations or candidate ATS workflows
- Teams without Microsoft Excel 2016 or later — try the Google Sheets version
⚙️ How to Use the Temp Staffing Dashboard in Excel
1️⃣ Download and unzip — open the .xlsx file in Microsoft Excel 2016 or later.
2️⃣ Open the Data Sheet — replace the sample placement records with your own data, keeping column headers intact.
3️⃣ Refresh all pivots — click Data → Refresh All on the Ribbon. Every page updates automatically.
4️⃣ Apply slicers — filter by region, recruiter, client, industry, worker type, or skill level on each page.
5️⃣ Hide the Support Sheet — right-click the tab and select Hide once pivots are working.
💼 Real-World Use Cases
Maria runs a 12-person temp staffing agency in Atlanta. She uses the Temp Staffing Dashboard in Excel every Monday to review last week’s placement count, billed hours, and gross margin by client — replacing a 3-hour spreadsheet routine with a 10-minute pivot refresh.
James is the regional manager for a contract IT staffing firm. He filters the Recruiter Performance page by region to compare Avg. Time to Fill across his three branches, then uses Workforce Analysis to identify which skill levels drive the highest bill rates.
Priya runs finance at a healthcare temp agency. She uses Client Insights to flag accounts where Gross Margin % falls below 18%, then renegotiates bill rates the same quarter.
❓ Frequently Asked Questions
What KPIs does the Temp Staffing Dashboard in Excel track?
The Temp Staffing Dashboard in Excel tracks 5 headline KPIs on the Overview page — Total Bill Revenue, Total Placements, Total Hours Worked, Total Pay Cost, and Gross Margin %. Avg. Time to Fill, Completion %, Avg. Performance Rating, and revenue splits by client, industry, region, worker type, and skill level appear across the other 4 pages.
How does this compare to Bullhorn or Avionté?
Bullhorn and Avionté are full ATS / CRM platforms with VMS integrations and per-user subscription pricing of $99–$200 monthly. The Temp Staffing Dashboard in Excel costs $17.99 once, focuses on reporting and analytics rather than candidate management, and is the right fit for teams that already track placements in Excel or a separate ATS.
Do I need advanced Excel skills to use this dashboard?
No. The Temp Staffing Dashboard in Excel uses standard pivot tables, charts, and slicers — no VBA, no macros, no Power Query. If you can paste data into a sheet and click Refresh All, you can run this dashboard. Setup typically takes under 10 minutes.
How long does setup take?
Most users have the Temp Staffing Dashboard in Excel running on their own data in under 10 minutes. Replace the sample rows on the Data Sheet, click Data → Refresh All on the Ribbon, and every chart and KPI updates immediately.
Is this template compatible with Excel for Mac and Excel 365?
Yes. The Temp Staffing Dashboard in Excel works on Excel 2016, 2019, 2021, Microsoft 365 (Windows and Mac), and renders correctly in Excel for the web for read-only review. Slicers and pivot refresh work natively across all supported versions.
What’s the difference between this and the Staffing Agency Dashboard in Excel?
The Staffing Agency Dashboard in Excel focuses on permanent placement metrics — net gross profit, satisfaction scores, and pipeline by candidate source. The Temp Staffing Dashboard in Excel is built specifically around contract / temp KPIs like Total Hours Worked, Completion %, Bill Rate vs. Pay Rate, and worker-type splits.
👤 About the Author
Built by PK — Microsoft Certified Professional with 15+ years of Excel, Google Sheets, and Power BI experience. Founder of NextGenTemplates, reaching 300K+ subscribers across YouTube channels (@PK-AnExcelExpert, @NextGenTemplates, @NeoTechNavigators). Every template is hand-built and tested before release.
🔗 Explore Related Templates
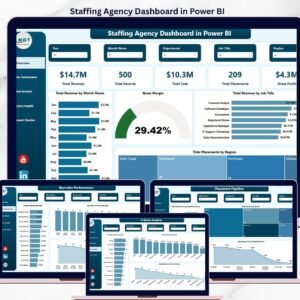
🔹 Staffing Agency Dashboard in Excel — Full-cycle staffing analytics with placement pipeline and recruiter, client, and industry insights
🔹 Staffing Agency Dashboard in Google Sheets — Browser-based version for cloud-first teams
🔹 Staffing Agency Dashboard in Power BI — Power BI version for executive-level reporting
🔹 Recruitment KPI Scorecard in Excel — Lightweight scorecard for recruitment teams
🔹 Browse all HR & Payroll Templates and Excel Dashboard Templates.
📖 Click here to read the Detailed Blog Post
Watch the step-by-step video tutorial:
🎥 Visit our YouTube channel for step-by-step video tutorials
👉 YouTube.com/@NextGenTemplates


Reviews
There are no reviews yet.