

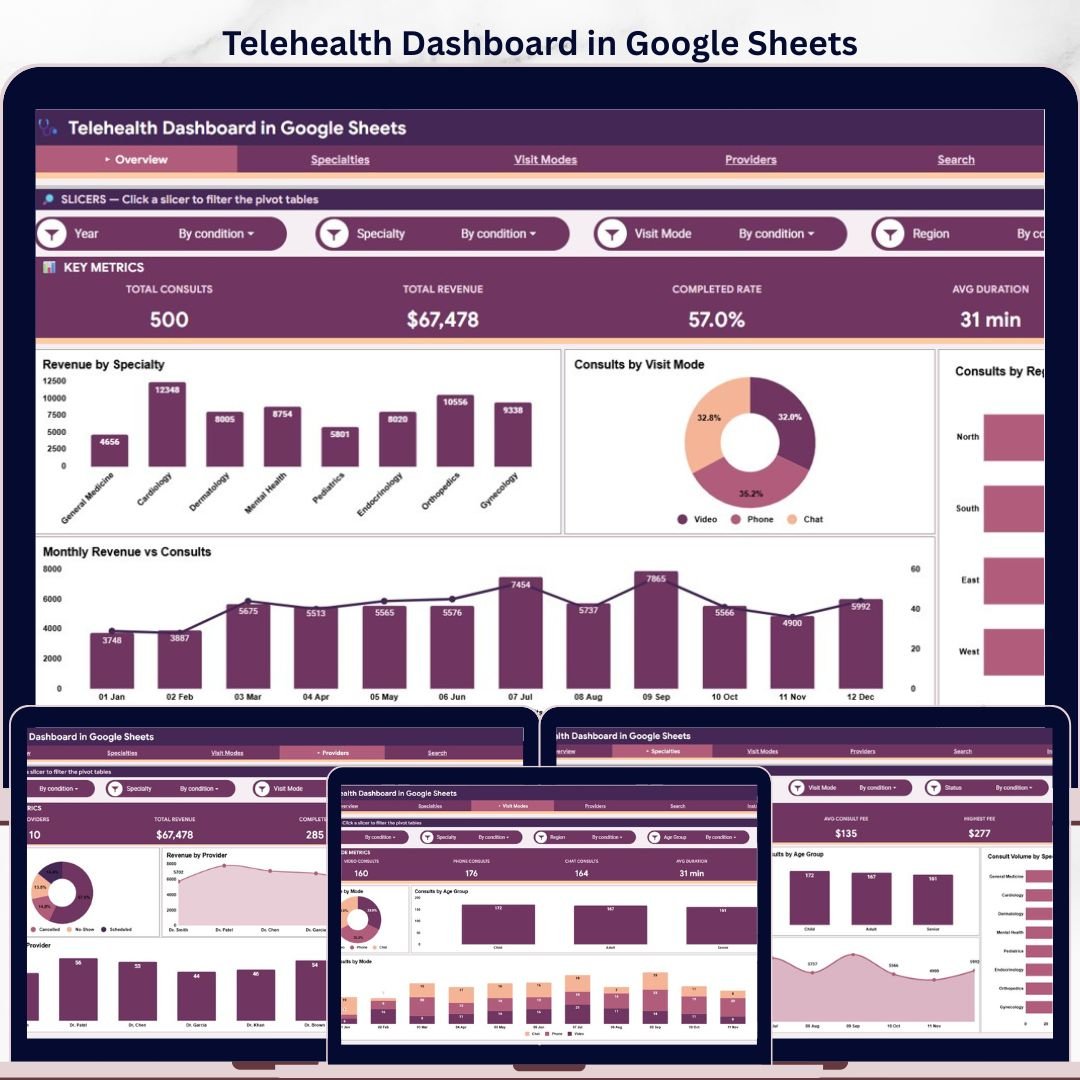

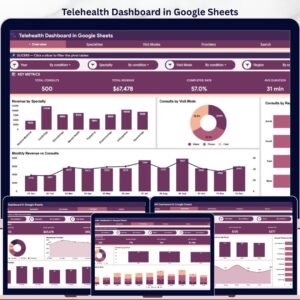
The Telehealth Dashboard in Google Sheets tracks 4 executive cards, 6 worksheet tabs, a consult lookup, and 10+ analysis charts for virtual care teams that need fast visibility without a paid healthcare analytics subscription. In under 10 minutes, you can replace the sample consult data, filter by specialty, visit mode, region, provider, status, or month, and review revenue, volume, completion rate, and duration from one shareable Google Sheet. Join 8,400+ teams in 40+ countries using NextGenTemplates to replace recurring SaaS reporting with editable templates. One-time payment, no per-user fees, lifetime access, and a familiar spreadsheet workflow.
Key Features of Telehealth Dashboard in Google Sheets
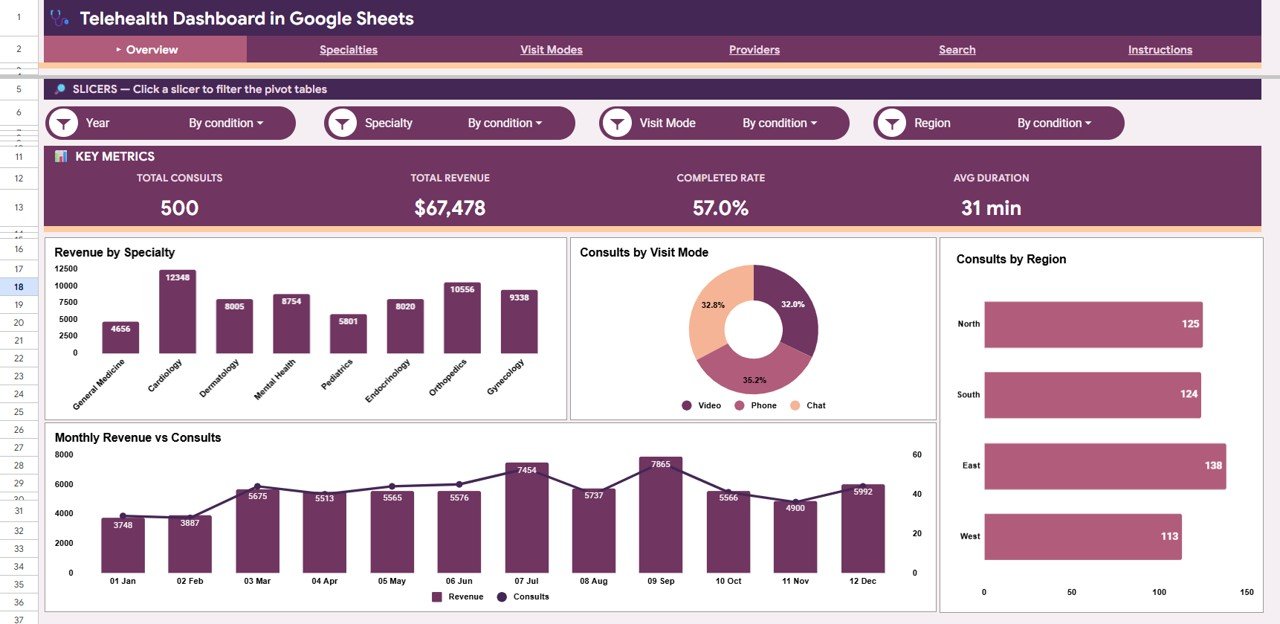
- 4 KPI cards on the Overview page – Total Consults, Total Revenue, Completed Rate, and Avg Duration summarize telehealth performance at a glance.
- 6 practical worksheet tabs – Overview, Specialties, Visit Modes, Providers, Search, and Data Sheet cover leadership reporting, clinical mix, channel mix, provider performance, record lookup, and raw data entry.
- Interactive slicers – Filter the dashboard quickly by the available reporting dimensions and see charts update without editing formulas.
- Revenue and consult analysis – Track revenue by specialty, monthly revenue vs consult volume, consults by region, and consult share by visit mode.
- Provider performance view – Compare status mix, revenue by provider, and consult volume by provider for weekly operations reviews.
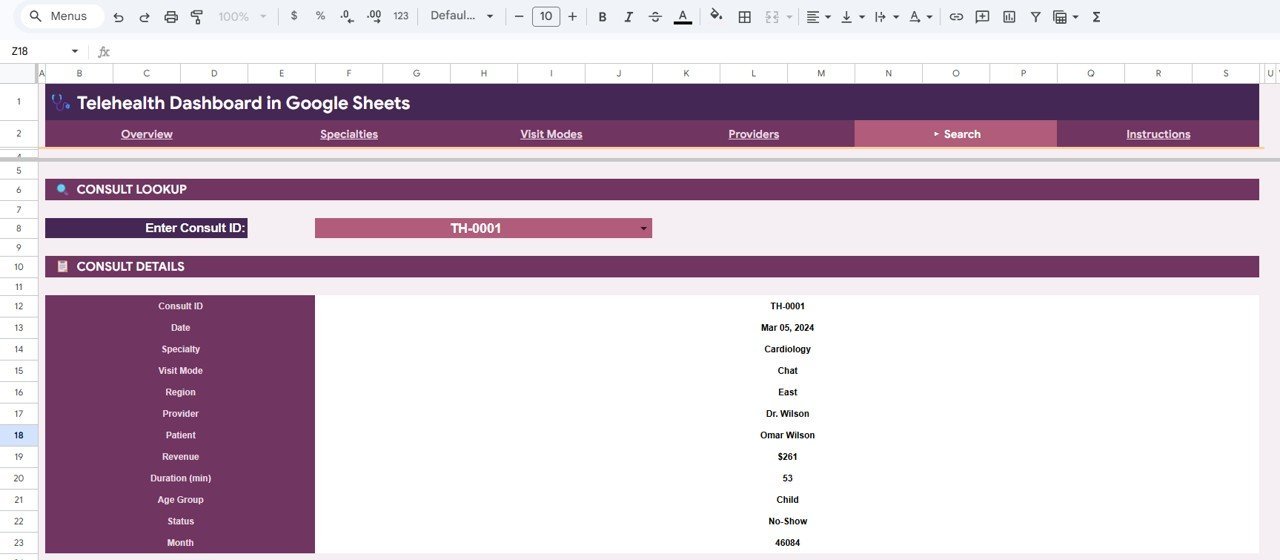
- Consult lookup sheet – Enter a Consult ID and instantly retrieve date, specialty, visit mode, region, provider, patient, revenue, duration, age group, status, and month.
- Google Sheets collaboration – Share the dashboard with managers, providers, or analysts using Google Drive permissions.
What’s Inside the Telehealth Dashboard in Google Sheets
The template is organized around the way telehealth teams usually review performance: an executive Overview first, then drill-down sheets for specialties, visit modes, providers, individual consult lookup, and the structured data table.
Overview Page
The Overview page shows Total Consults, Total Revenue, Completed Rate, and Avg Duration at the top. Revenue by Specialty shows which clinical service lines drive the most billings. Consults by Visit Mode shows how patients prefer to connect, such as video, phone, or chat. Consults by Region helps operations teams spot geographic demand, while Monthly Revenue vs Consults compares financial performance against visit volume.
Telehealth Dashboard in Google Sheets
Specialties
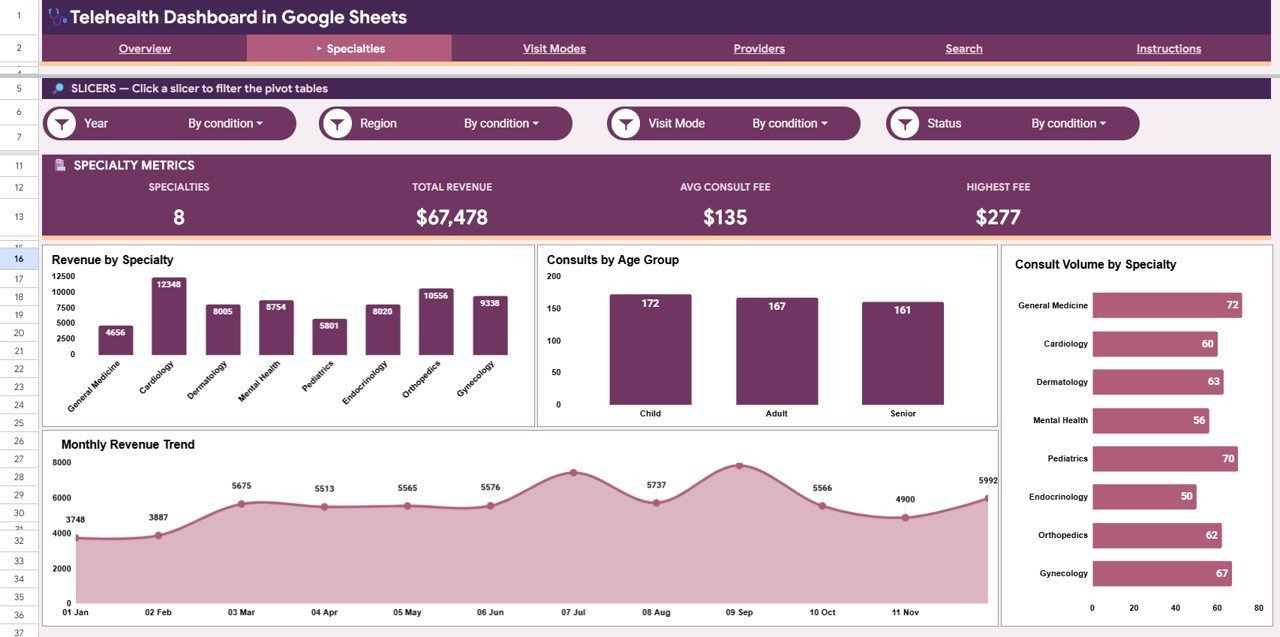
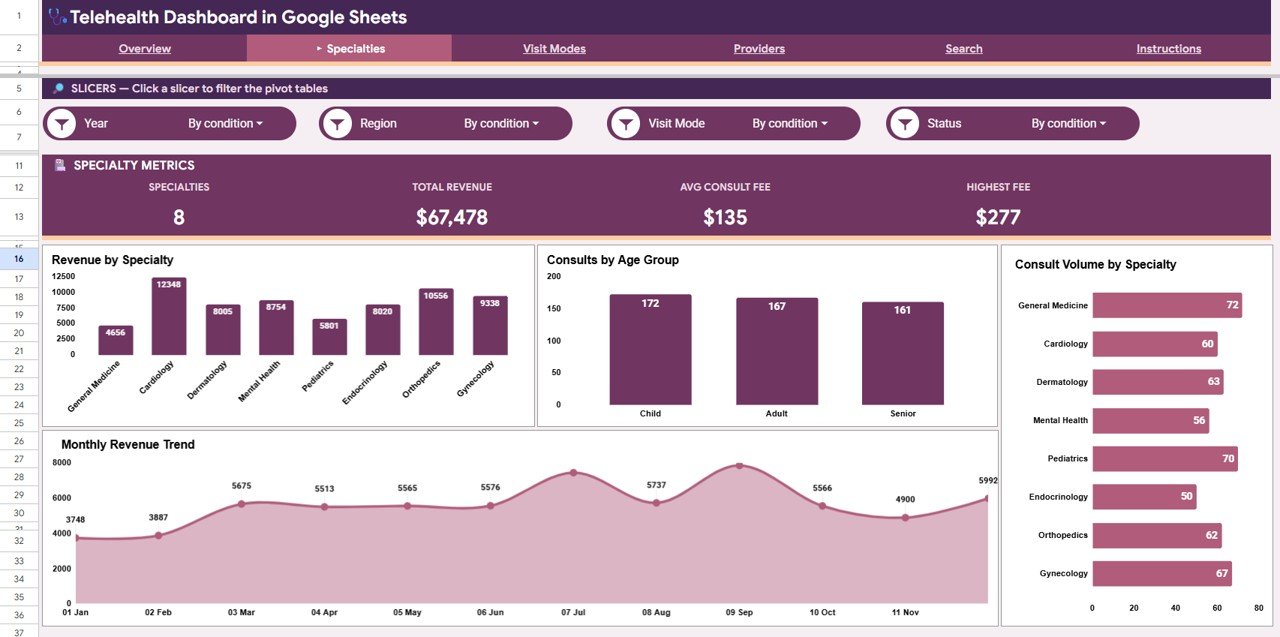
The Specialties tab analyzes Revenue by Specialty, Consults by Age Group, Consult Volume by Specialty, and Monthly Revenue Trend. Clinical leads can see which specialties are growing, which age groups use the service most, and whether revenue is moving with consult demand.
Specialties
Visit Modes
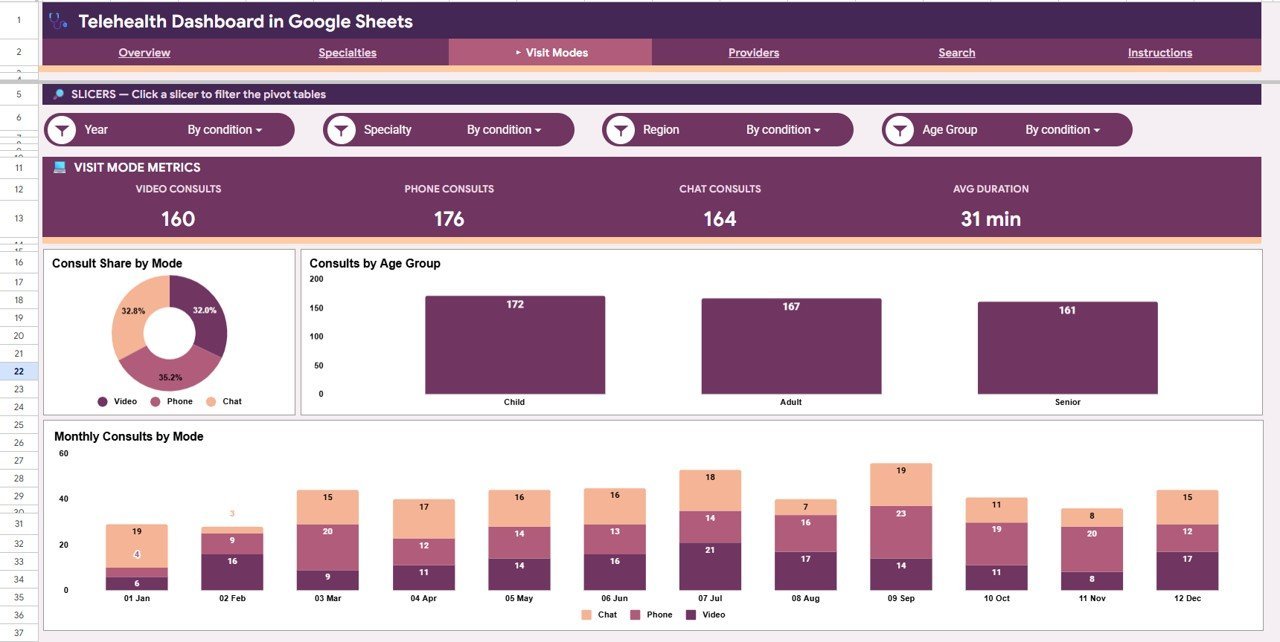
The Visit Modes sheet explains how consults are distributed by delivery channel. Consult Share by Mode highlights the dominant visit format. Consults by Age Group shows patient adoption across demographics. Monthly Consults by Mode helps product and operations teams decide where to improve capacity.
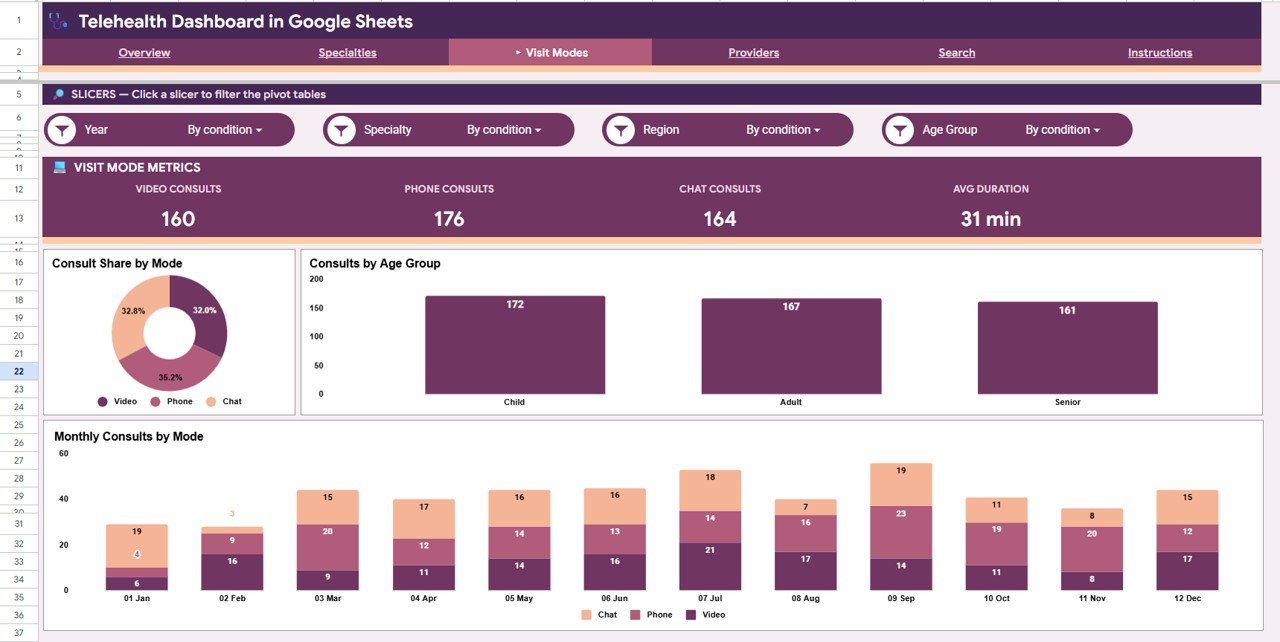
Visit Modes
Providers
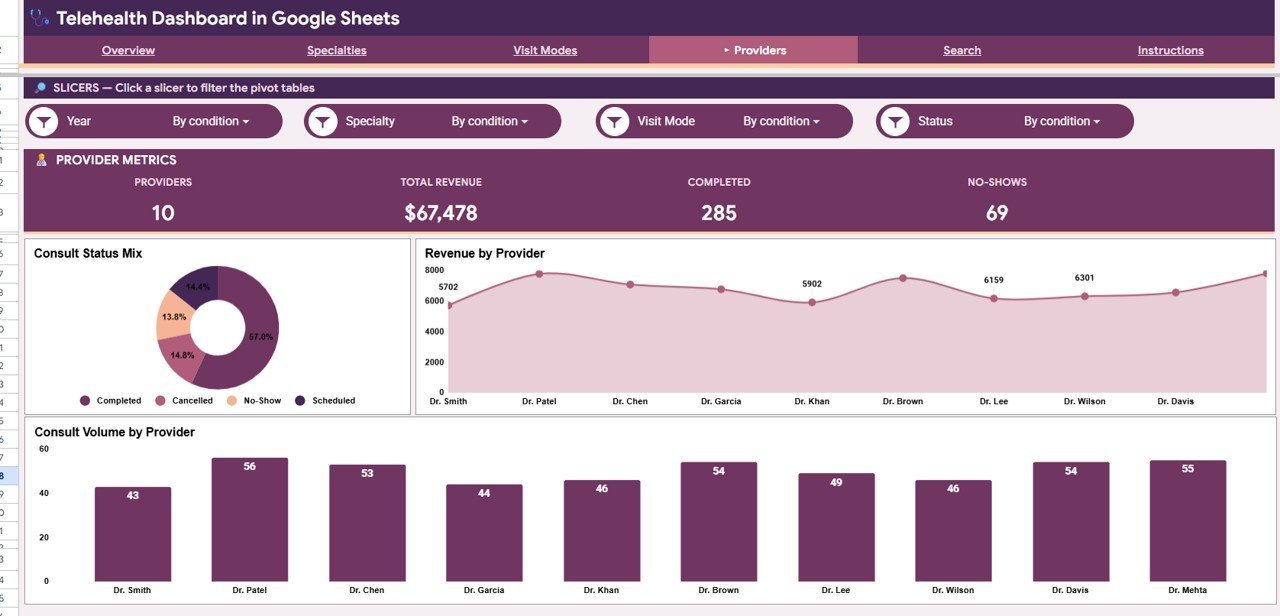
The Providers tab focuses on execution. Consult Status Mix separates completed, cancelled, pending, and other outcomes. Revenue by Provider compares financial contribution, while Consult Volume by Provider helps managers review workload distribution.
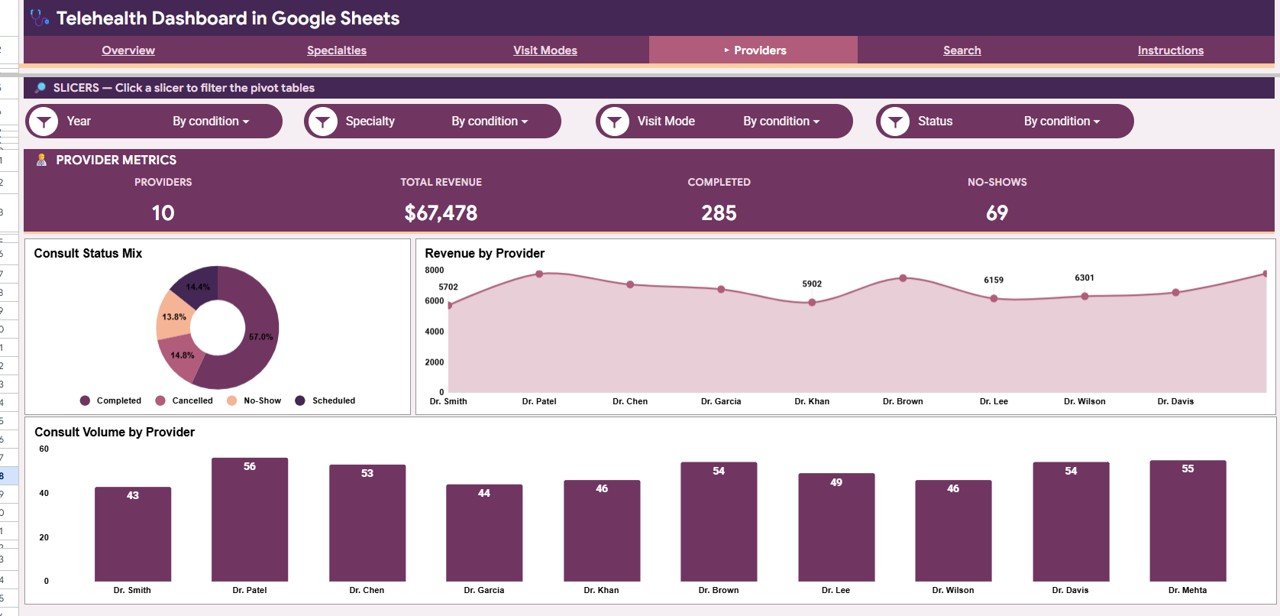
Providers
Search
The Search sheet includes a Consult Lookup where users enter a Consult ID and instantly view consult details: Consult ID, Date, Specialty, Visit Mode, Region, Provider, Patient, Revenue, Duration (min), Age Group, Status, and Month. It is ideal for billing follow-ups, clinical review, and support-team questions.
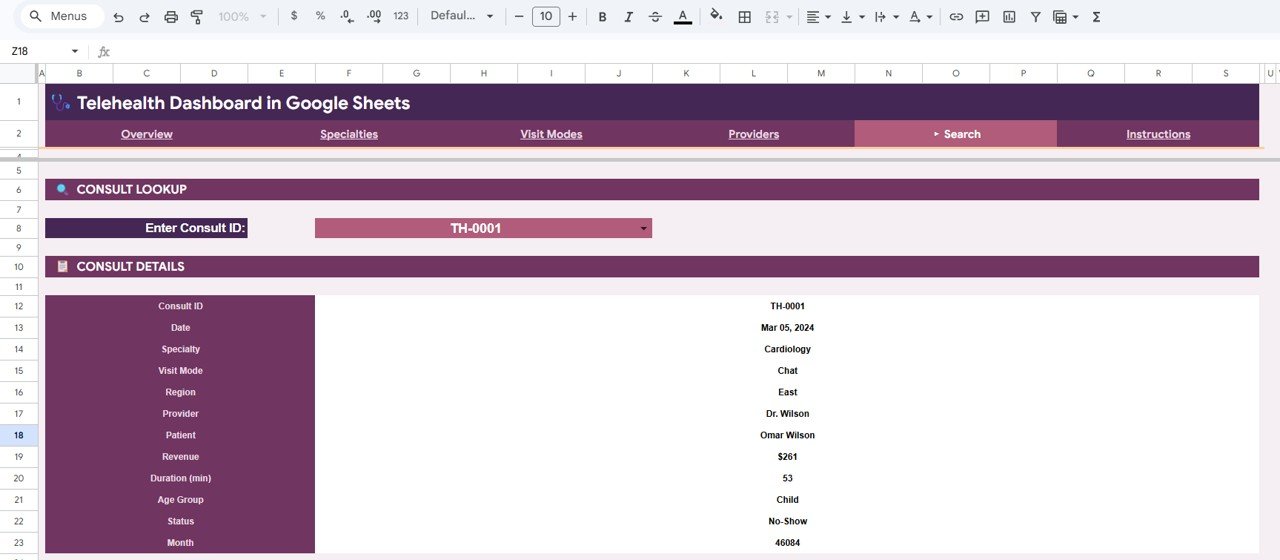
Search
Data Sheet Tab
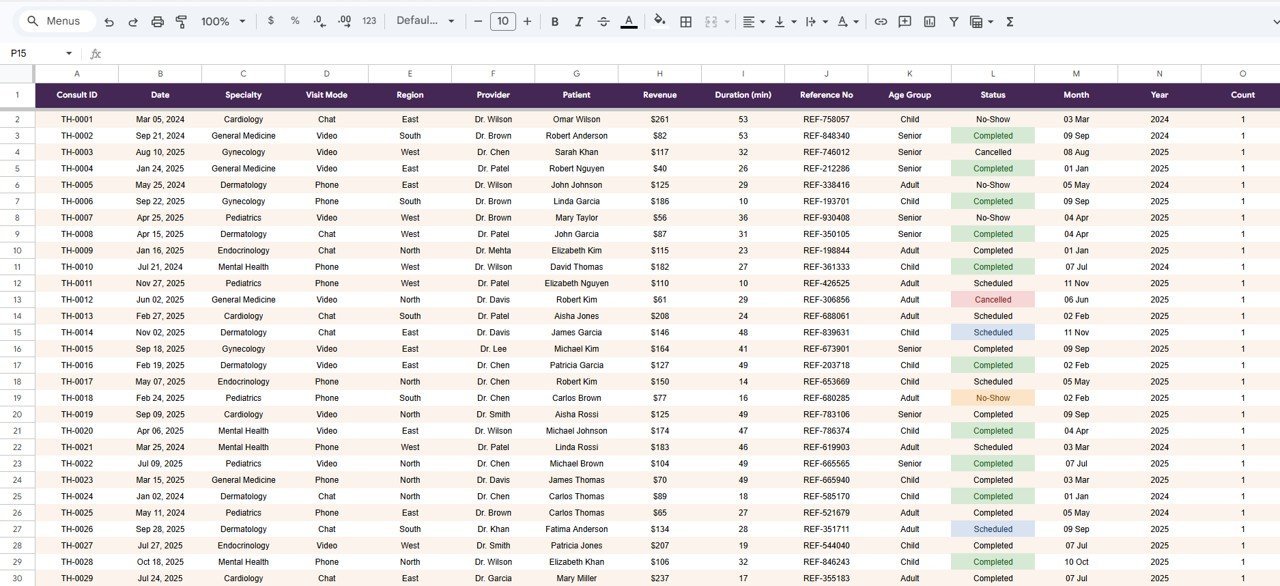
The Data Sheet is where you add or replace consult records in the same column format. Once the data is updated, the charts, cards, slicers, and lookup sheet can use the refreshed records.
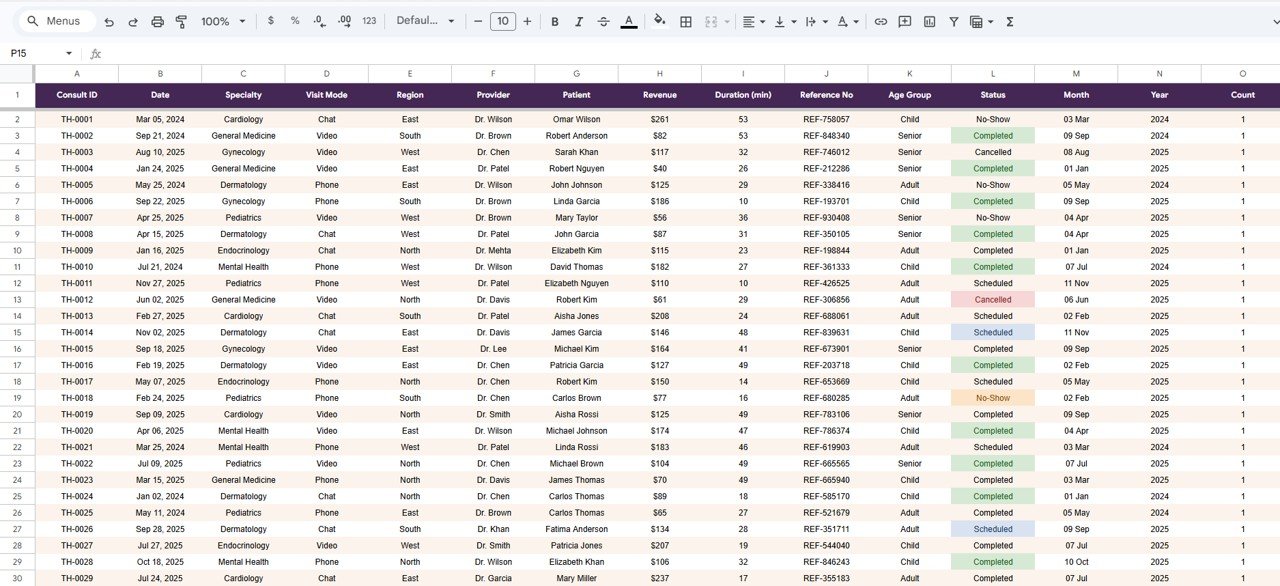
Data Sheet tab
Telehealth Dashboard in Google Sheets vs. Microsoft Excel Dashboard vs. Paid CRM/SaaS – Where This Fits
| Feature | Telehealth Dashboard in Google Sheets | Microsoft Excel Dashboard | Paid Healthcare SaaS |
|---|---|---|---|
| Cost | $9.99 one-time | One-time template cost | Often monthly per provider or per user |
| Platform | Google Sheets in browser | Microsoft Excel desktop or web | Vendor-hosted cloud platform |
| Setup time | Under 10 minutes | Under 10 minutes | Weeks for configuration and onboarding |
| Real-time team collaboration | Built into Google Sheets sharing | Requires OneDrive or SharePoint | Usually included, but permission-managed |
| Mobile access | Google Sheets mobile app | Excel mobile app | Vendor app or portal |
| Customizable fields | Fully editable | Fully editable | Limited by plan and vendor schema |
| Share with link | Yes, through Google Drive | Limited unless stored online | Usually role-based only |
| Year-1 cost at 5 users | $9.99 total | Template cost plus Excel licensing | Often $1,000+ depending on vendor |
| Consult lookup | Included by Consult ID | Possible with formulas | Depends on system search features |
| Best fit | Fast internal reporting | Offline spreadsheet reporting | Live clinical system of record |
This template fits teams that already keep telehealth data in exports, spreadsheets, CSV files, or manually maintained records and want a clean reporting layer before investing in larger software.
Who This Template Is For – and Who It’s Not For
This template is built for:
- Telehealth practice managers tracking consult volume, revenue, completion, and visit mode adoption.
- Virtual care operations teams reviewing specialty mix, region demand, provider workload, and monthly trends.
- Healthcare consultants preparing client dashboards for telemedicine clinics.
- Small and mid-sized clinics that prefer Google Sheets collaboration over desktop-only reporting.
This template is not for:
- Organizations needing direct EHR, HL7, FHIR, or claims-system integration.
- Teams that require live patient monitoring or clinical decision support.
- Enterprises needing automated row-level security across thousands of users.
How to Use the Telehealth Dashboard in Google Sheets
- Open the PDF guide included with your download and click the Google Sheets copy link.
- Create your own editable copy in Google Drive.
- Go to the Data Sheet tab and replace the sample consult records with your own data in the same column order.
- Review the Overview page for total consults, revenue, completion rate, and average duration.
- Use the Specialties, Visit Modes, and Providers tabs to analyze performance from different angles.
- Use the Search tab whenever you need to look up a single consult by Consult ID.
- Share the file with your team using Google Drive permissions.
Real-World Use Cases
Dr. Mehta, Telehealth Operations Director: She uses the Overview and Providers tabs every Monday to compare consult volume, completion rate, and revenue by provider before the weekly operations meeting.
Ana, Healthcare Finance Analyst: She uses Revenue by Specialty and Monthly Revenue Trend to explain which specialties are driving growth and where billing follow-up is needed.
Ravi, Support Team Lead: His team uses the Consult Lookup page to answer patient and provider questions quickly without scrolling through the full data sheet.
Frequently Asked Questions
What does the Telehealth Dashboard in Google Sheets track?
It tracks Total Consults, Total Revenue, Completed Rate, Avg Duration, revenue by specialty, consults by visit mode, consults by region, monthly revenue vs consults, provider performance, and individual consult details.
Can I use it with my own telehealth data?
Yes. Replace the sample records in the Data Sheet tab with your own consult data in the same format. The dashboard pages are designed around structured consult-level records.
Does this connect directly to an EHR or telehealth platform?
No. This is a Google Sheets dashboard template, not an integration tool. Export your data from your platform, paste it into the Data Sheet tab, and use the dashboard for reporting.
Can multiple people use the dashboard?
Yes. Because it runs in Google Sheets, you can share the copied file through Google Drive with view or edit permissions.
Is this suitable for HIPAA workflows?
The template itself does not provide HIPAA compliance. If you store patient information, use a properly configured Google Workspace environment, internal security policies, and only the minimum necessary data.
Can I customize the charts and fields?
Yes. You can edit chart titles, formulas, colors, sheet names, and the data fields after creating your own copy in Google Drive.
About the Author
Built by PK – Microsoft Certified Professional with 15+ years of Excel, Google Sheets, and Power BI experience. Founder of NextGenTemplates, reaching 300K+ subscribers across YouTube channels. Every template is hand-built and tested before release.
Explore Related Templates
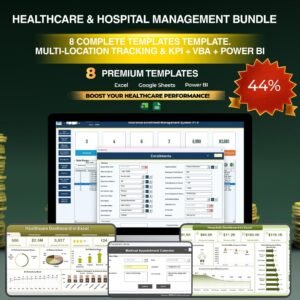
- Healthcare & Hospital Management Bundle – Best-value healthcare template pack.
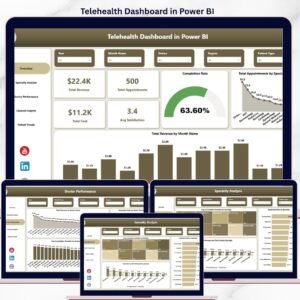
- Telehealth Dashboard in Power BI – Power BI version for richer report publishing.
- Medical Practice Dashboard in Google Sheets – Clinic performance dashboard for visits, revenue, and patient analytics.
- Telehealth KPI Dashboard in Google Sheets – KPI-first scorecard for virtual care teams.
- Google Sheets Dashboard Templates – Browse more browser-based dashboard templates.
- Google Sheets Templates – Explore all Google Sheets products.
Ready to track telehealth consults, revenue, visit modes, provider performance, and consult lookup in one file? Get the Telehealth Dashboard in Google Sheets today and start reporting from your own data.
Last updated: May 29, 2026
Watch the step-by-step video tutorial:
Compatibility and Requirements
- Works in Google Sheets. You need a free Google account and a web browser.
- The template filters by slicers and shows charts on each tab. Google explains how charts work in Add and edit a chart or graph.
- Google Sheets also opens on the mobile app, so you can check the dashboard from a phone.
More Questions About This Template
Is there a Power BI or Excel version of this dashboard?
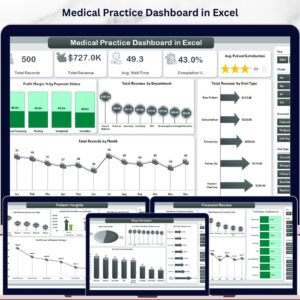
Yes. See the Telehealth Dashboard in Power BI and the Telehealth Dashboard in Excel.
What is the difference between this dashboard and the Telehealth KPI Dashboard?
This template covers specialties, visit modes, providers, a consult lookup and a data sheet. The Telehealth KPI Dashboard in Google Sheets is a KPI-first scorecard for virtual care teams.
How do I look up one consult?
Open the Search tab and enter the Consult ID. The sheet returns the date, specialty, visit mode, region, provider, patient, revenue, duration, age group, status and month.






























Reviews
There are no reviews yet.