

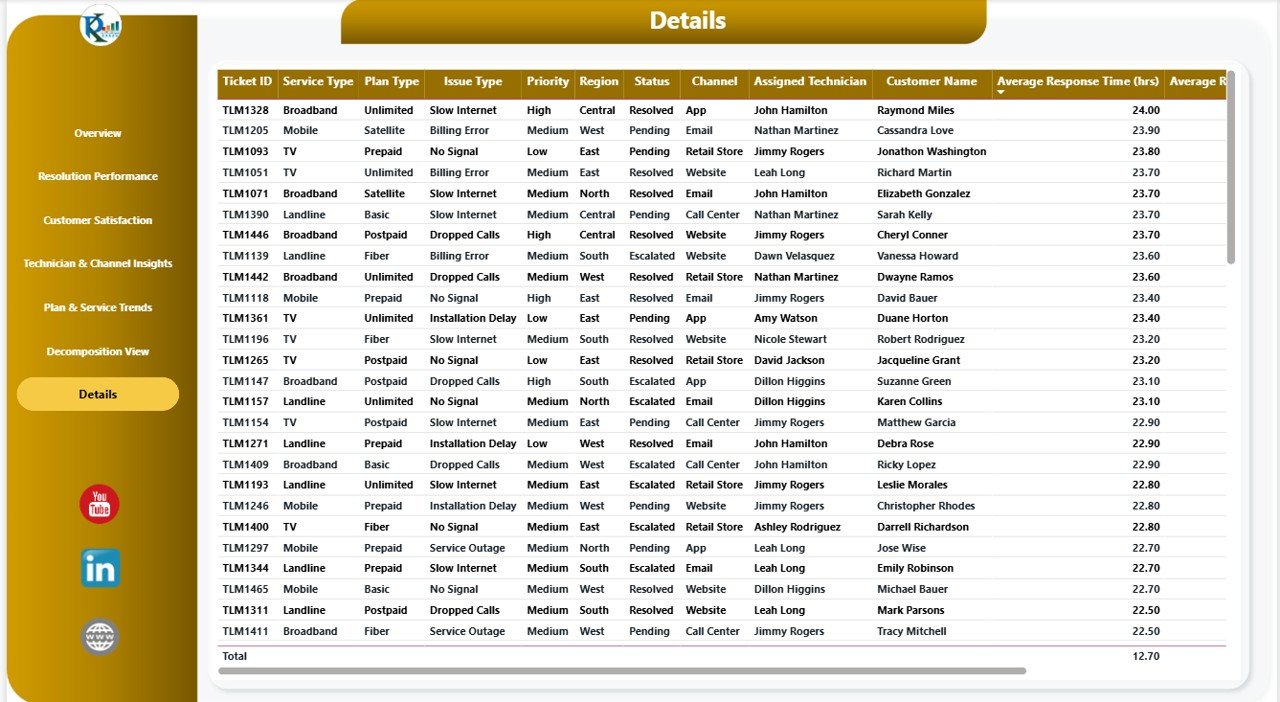
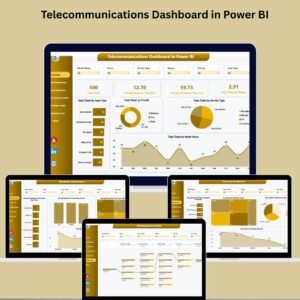
Managing customer service operations in the telecom sector can be complex—but with the Telecommunications Dashboard in Power BI, it’s never been easier to gain clarity. This ready-to-use, data-driven dashboard empowers you to track and optimize service ticket resolution, technician performance, and customer satisfaction with just a few clicks.
Perfect for telecom support managers, service desk teams, and operations leaders, this dashboard turns raw service data into powerful insights that drive faster response, better resolution rates, and happier customers.
🧩 Key Features of the Telecommunications Dashboard
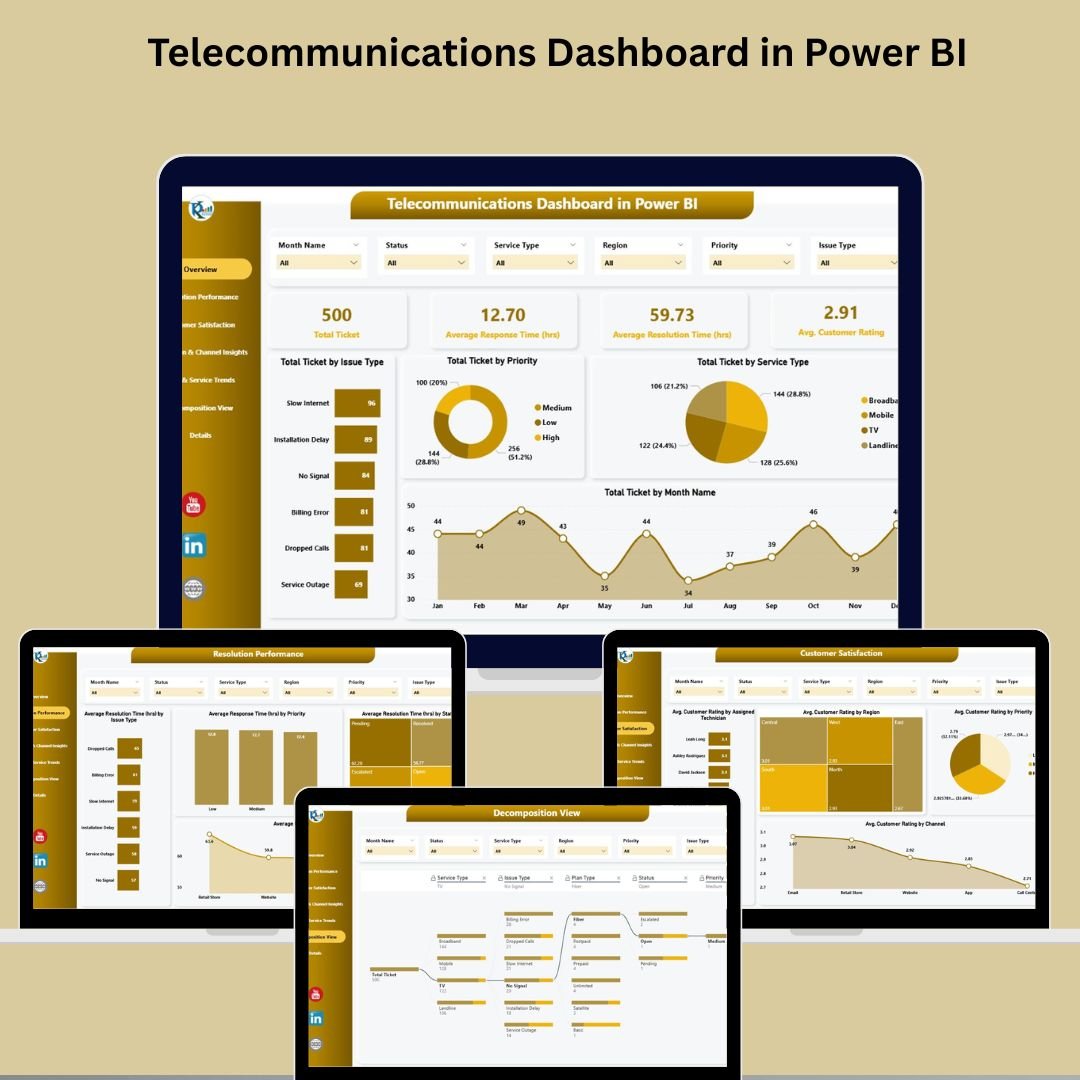
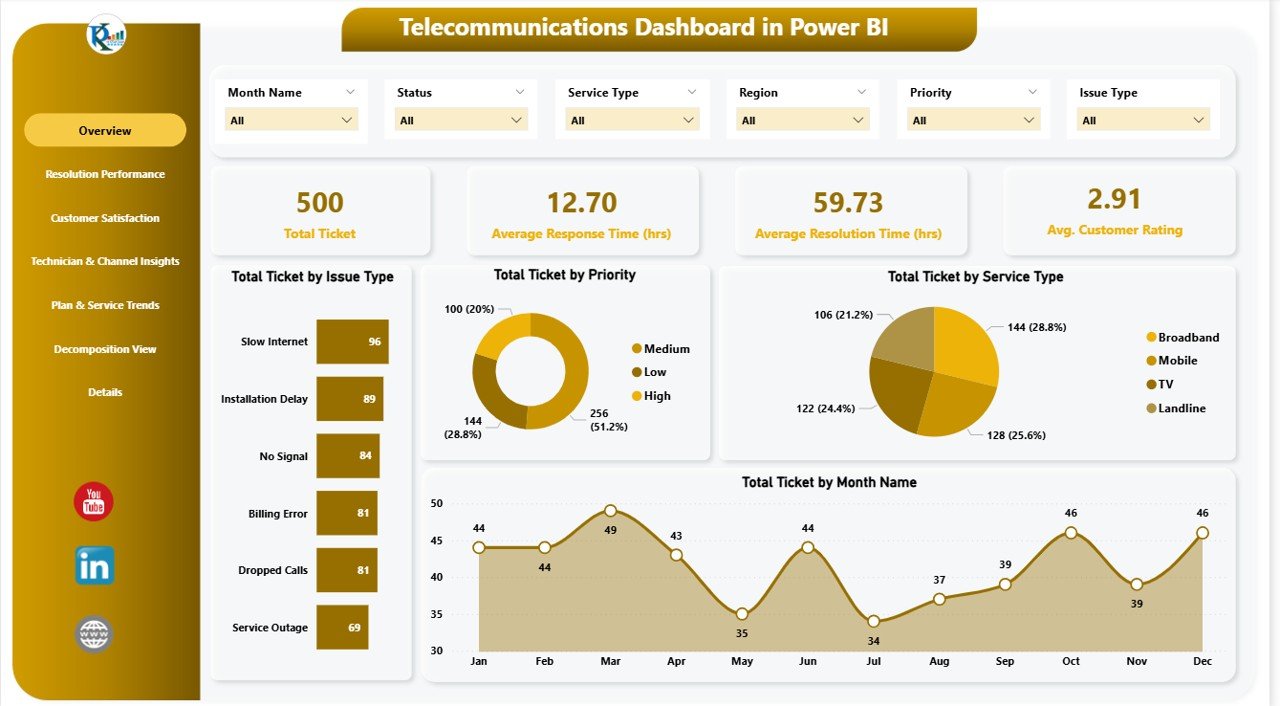
📊 Overview Page – Instant KPI Insights
🧾 Cards for quick review:
Total Tickets Logged
Avg. Response Time
Avg. Resolution Time
Avg. Customer Rating
📈 Charts for trend spotting:
Tickets by Issue Type, Priority, Service Type, and Month
Get a real-time snapshot of your service performance and spot volume surges, delays, or feedback trends.
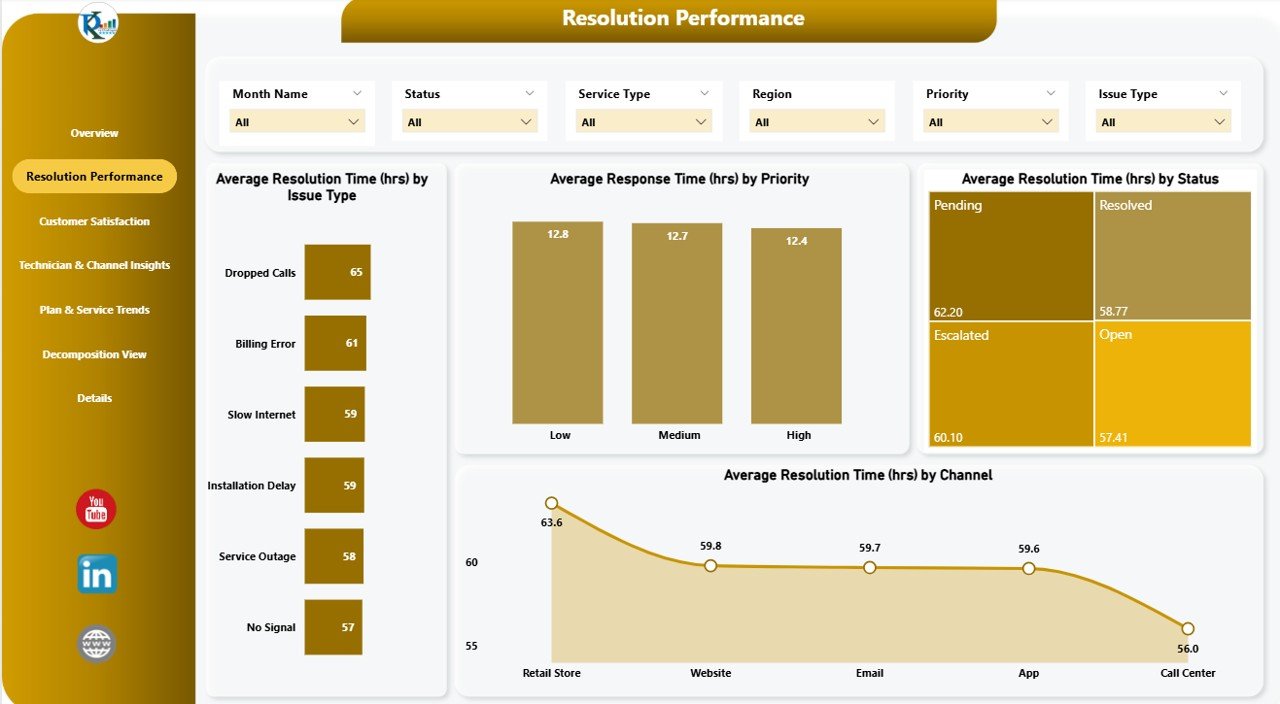
🛠️ Resolution Performance Page – Optimize Resolution Times
Track resolution & response time by:
Issue Type
Ticket Status
Priority Level
Communication Channel
See exactly where delays occur and streamline your support processes.
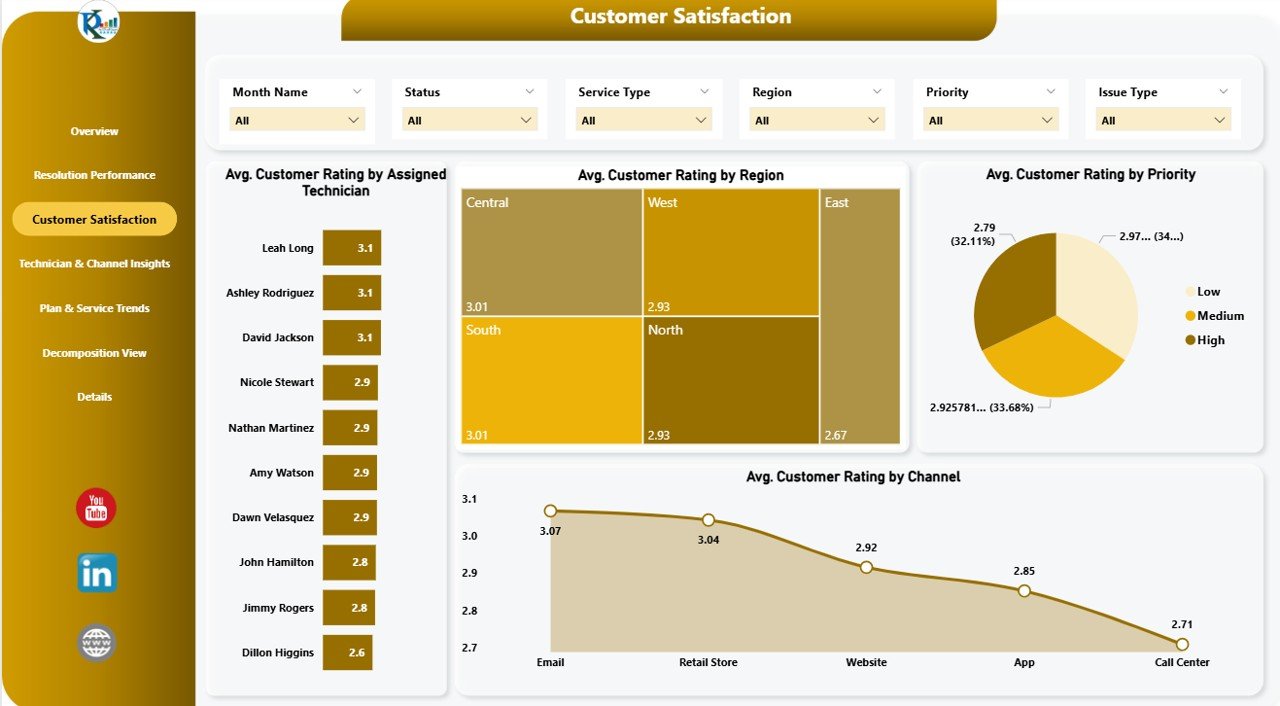
🌟 Customer Satisfaction Page – Measure Real Impact
Analyze customer ratings by:
Technician
Region
Channel
Priority
Use this to pinpoint service gaps and improve client experience end-to-end.
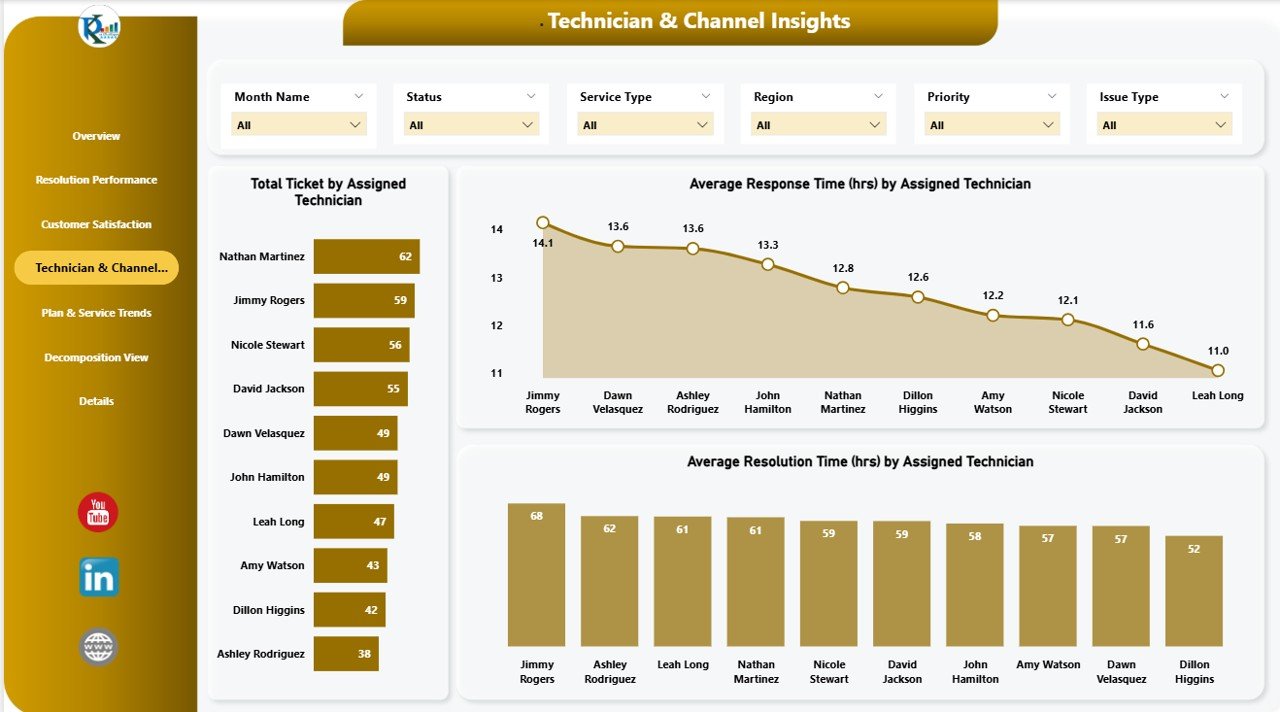
👨🔧 Technician & Channel Insights Page – Evaluate Staff Productivity
Monitor:
Total Tickets Assigned to Technicians
Avg. Response & Resolution Time per Technician
Open vs. Closed Tickets
Gain insight into individual performance and training needs.
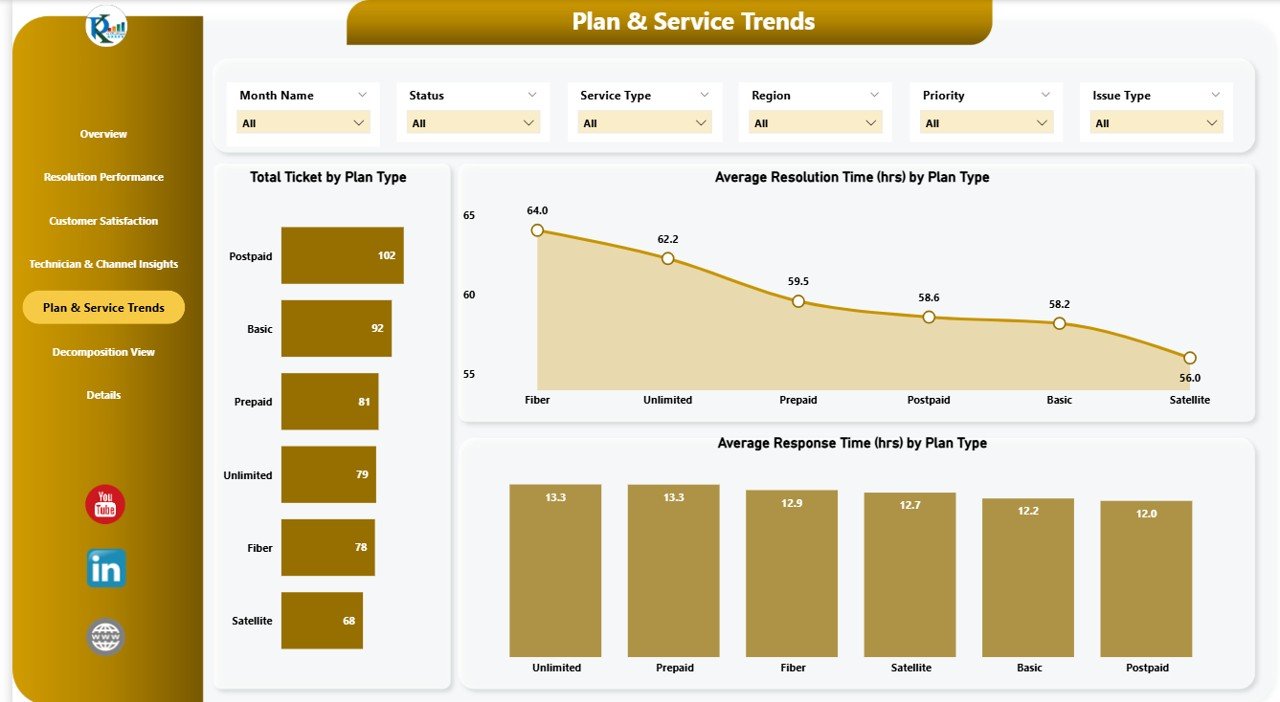
📡 Plan & Service Trends Page – Understand Support by Product Line
Evaluate:
Ticket Volumes by Plan Type (Prepaid, Postpaid, etc.)
Resolution & Response Time per Plan
Perfect for improving plan-specific support and enhancing customer retention.
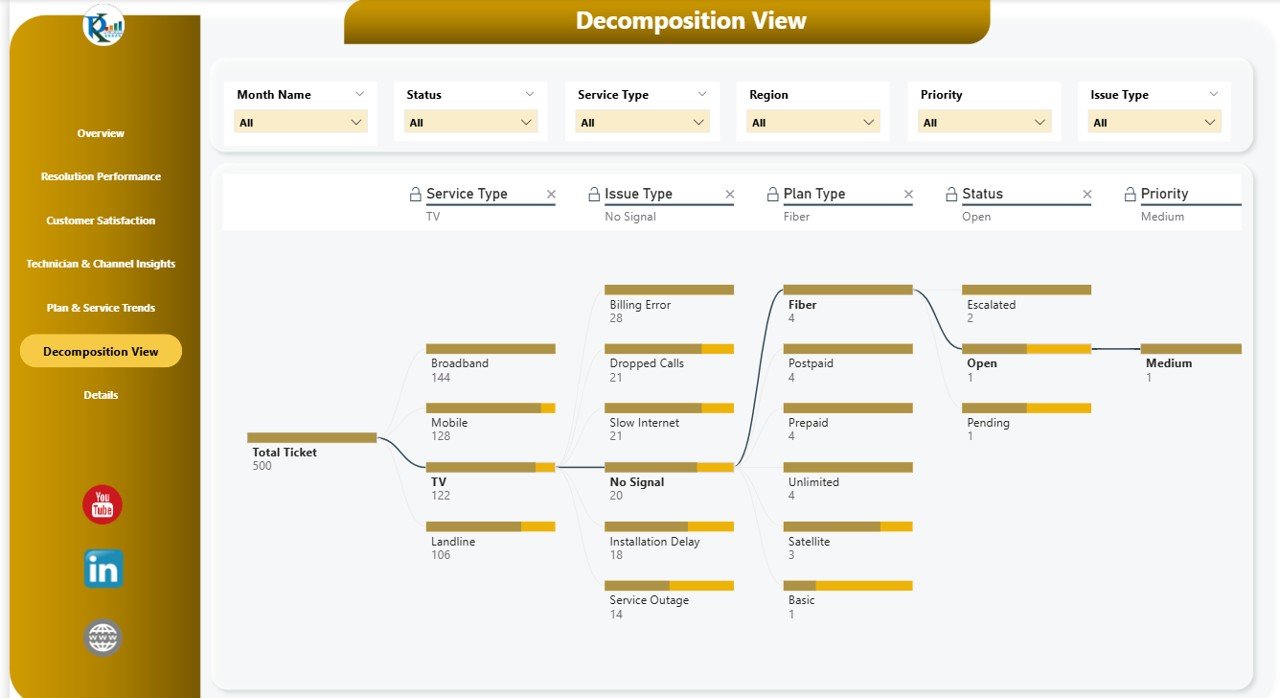
🔍 Decomposition View Page – Drill-Down Like a Pro
Perform multi-level analysis of tickets by combining:
Issue Type
Priority
Service Type
Channel
Uncover root causes behind recurring service bottlenecks.
🚀 Benefits of the Telecommunications Dashboard
✅ Track Key Service KPIs
✅ Evaluate Technician Effectiveness
✅ Enhance Customer Satisfaction
✅ Identify Delays and Bottlenecks
✅ Make Data-Driven Improvements
✅ Customize for Your Service Needs
✅ Real-Time Updates in Power BI
Whether you’re supporting mobile, broadband, or cable services—this dashboard brings clarity, control, and confidence to your operations.
💡 Best Practices for Use
🔁 Update your ticket data regularly to get real-time insights
📊 Analyze technician and regional performance to improve SLA compliance
🗺️ Use plan-level trends to optimize support for different services
👥 Collaborate with teams by sharing interactive Power BI views
🔧 Customize filters and charts to match your organization’s KPIs
🧑💻 Who Should Use This Dashboard?
Telecom Customer Support Teams
Service Desk Managers
Network & Operations Managers
Technical Support Heads
Call Center Supervisors
CXO-level Decision Makers
From strategic planning to day-to-day monitoring, this dashboard is your central hub for telecommunications service excellence.













Reviews
There are no reviews yet.