Understanding what clients truly feel is the foundation of long-term business success. While most organizations collect feedback through surveys, very few convert that data into clear, actionable insights. That is exactly where the Client Satisfaction Survey Dashboard in Power BI becomes a game-changing solution 🚀.
This professionally designed, ready-to-use Power BI dashboard transforms raw client survey responses into powerful visual insights. Instead of scrolling through Excel files or manual reports, decision-makers instantly see satisfaction levels, service quality trends, and Net Promoter Scores (NPS) in one interactive view. As a result, teams can act faster, improve service delivery, and strengthen client relationships.
## 🌟 Key Features of Client Satisfaction Survey Dashboard in Power BI
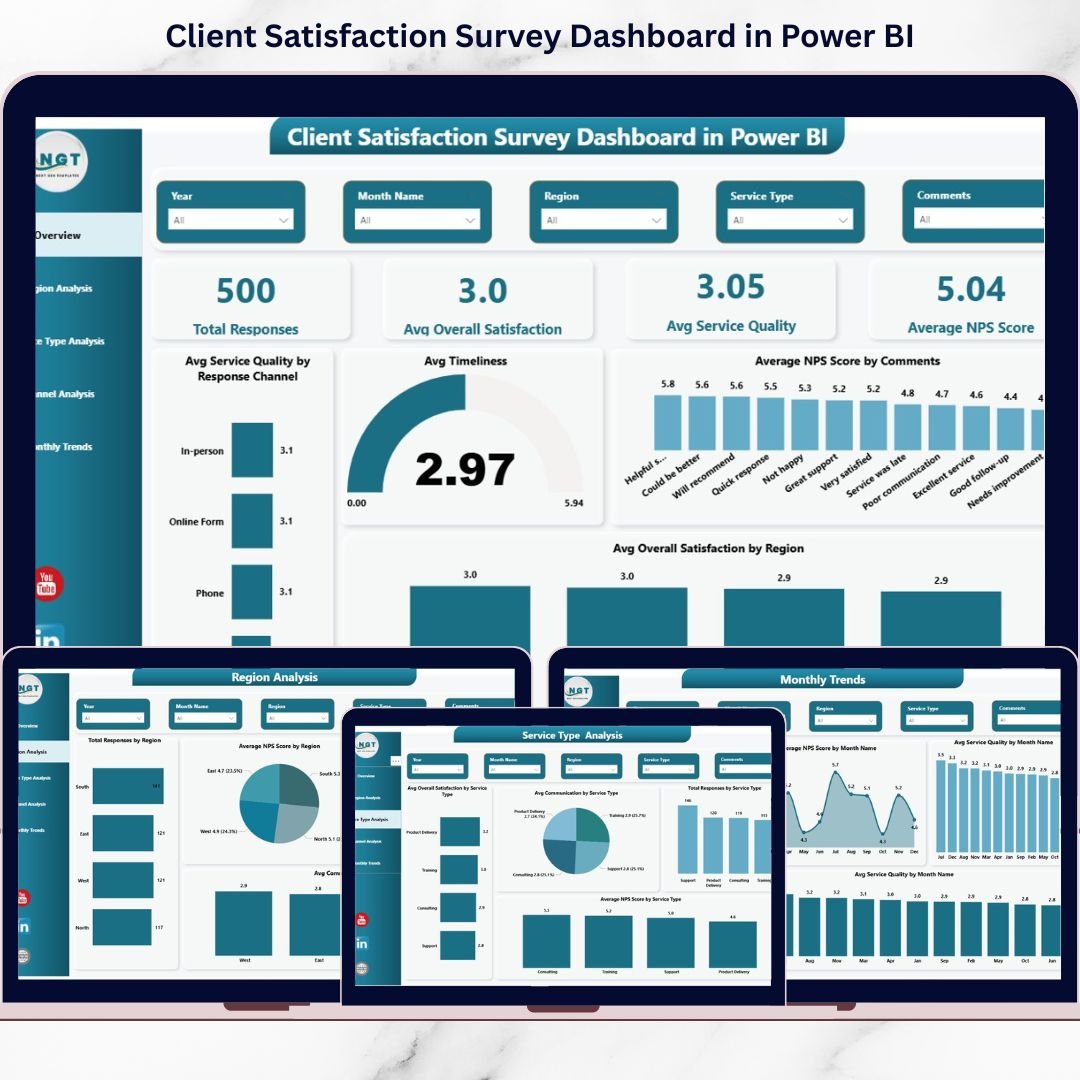
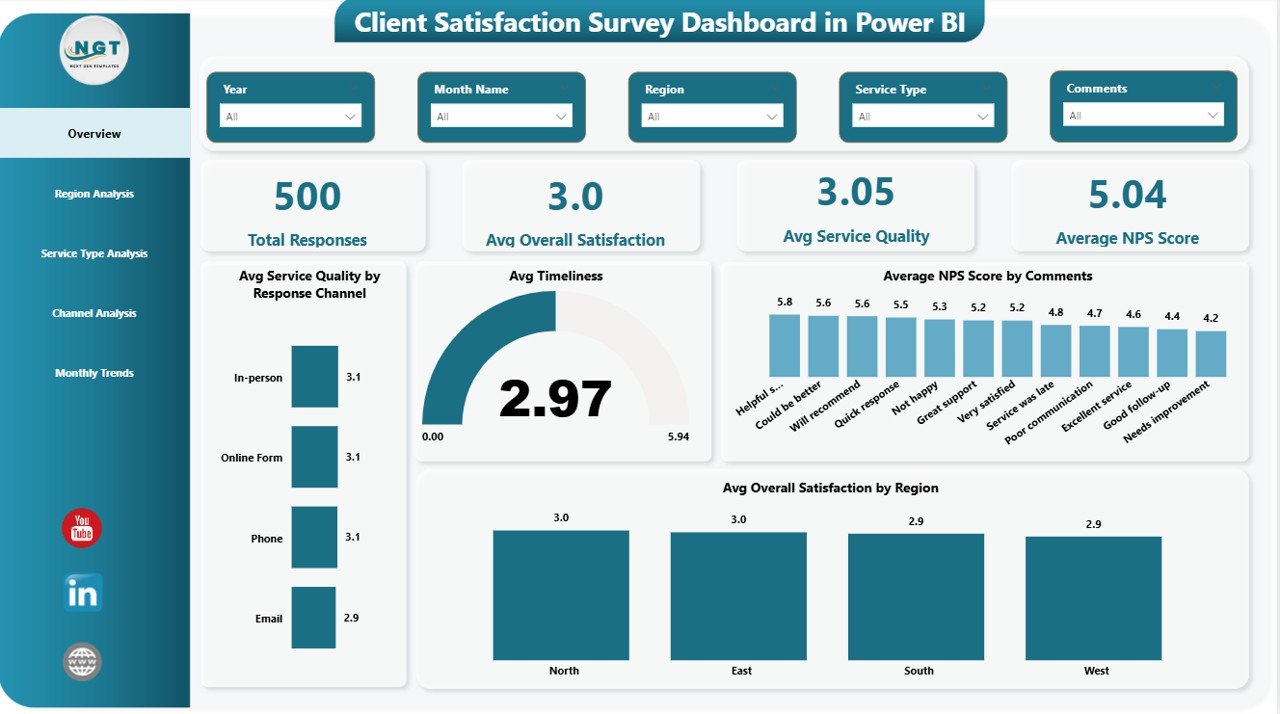
✅ Interactive Overview Page – Instantly view total responses, average satisfaction, service quality, and NPS
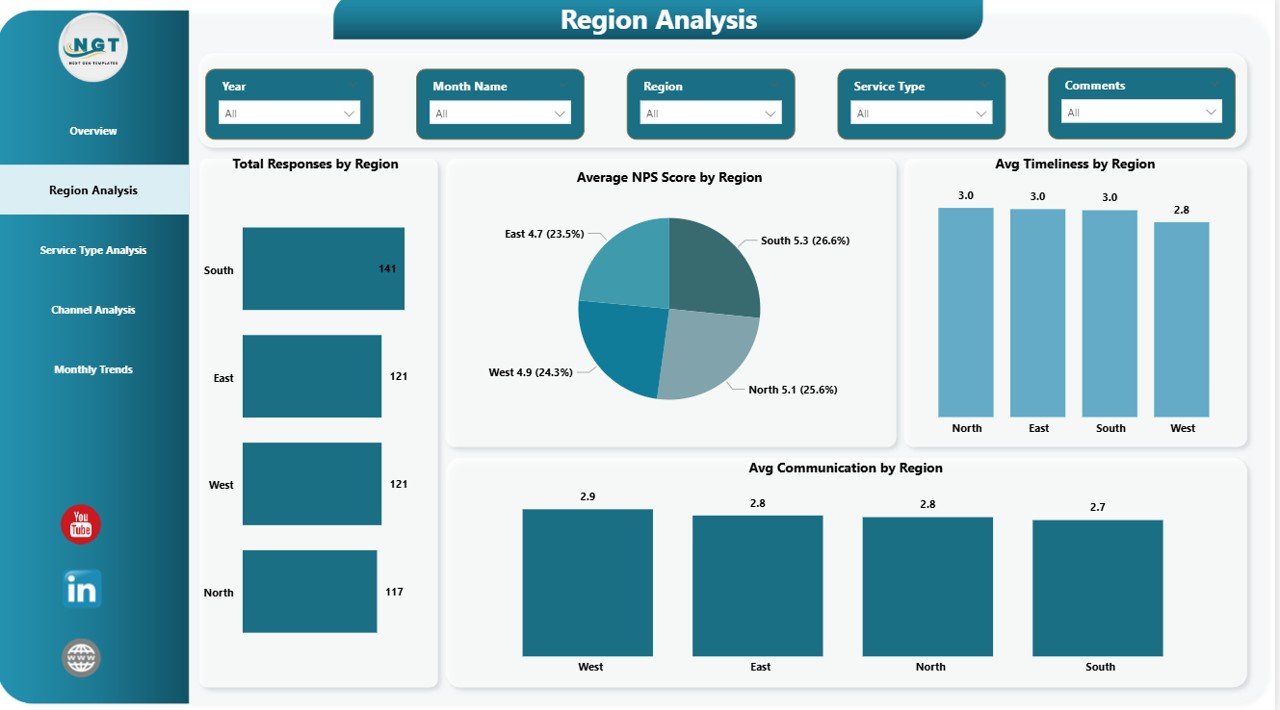
✅ Region-wise Performance Analysis – Compare satisfaction scores across different locations
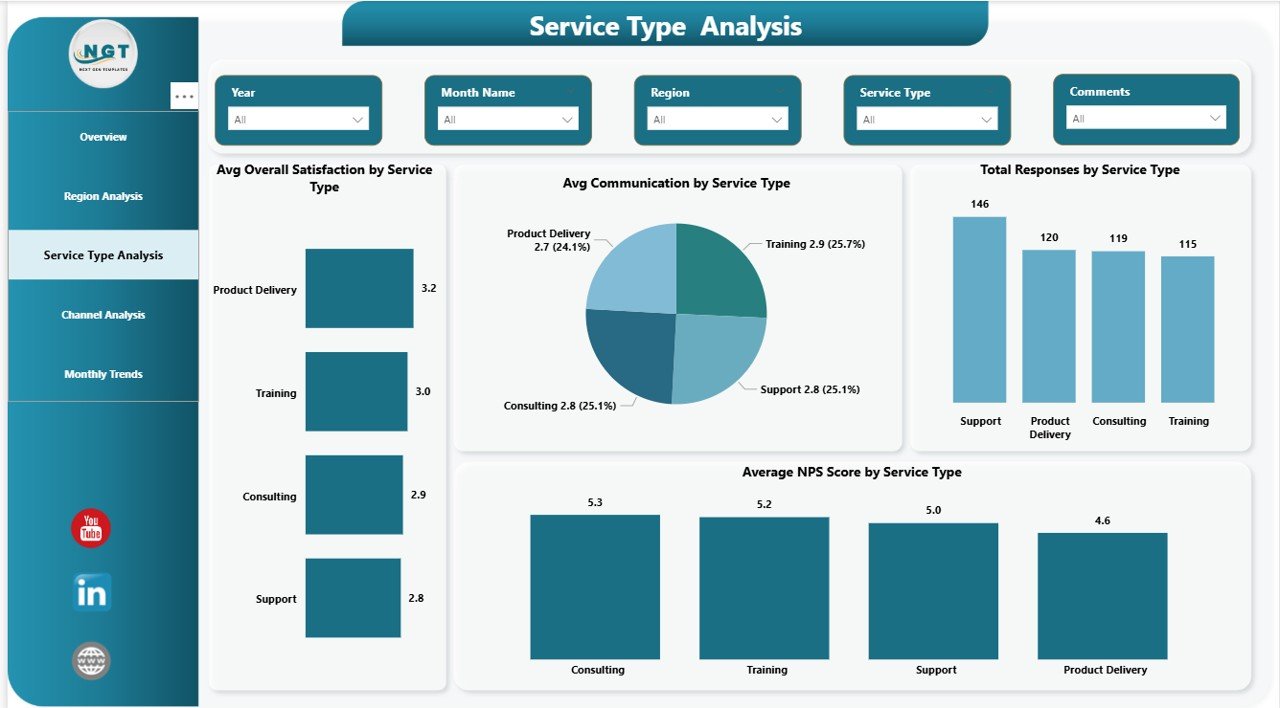
✅ Service Type Insights – Identify which services delight clients and which need improvement
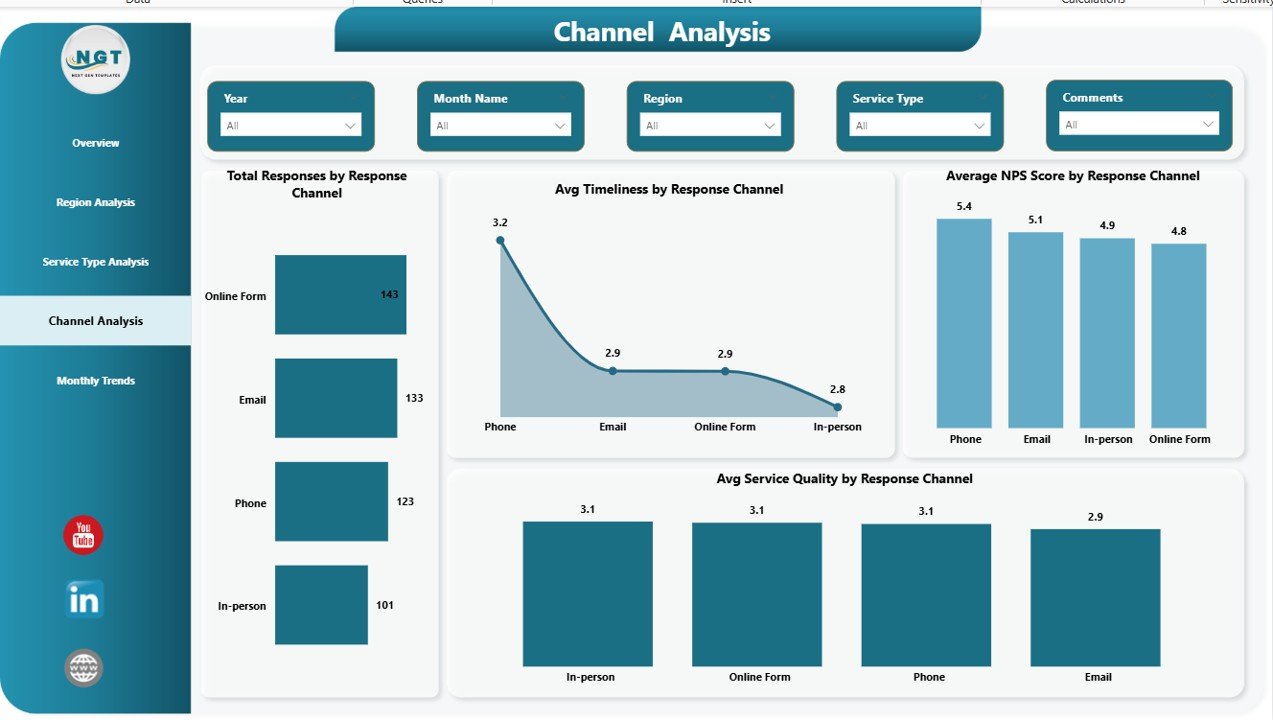
✅ Channel Performance Tracking – Analyze feedback from email, phone, chat, and other channels
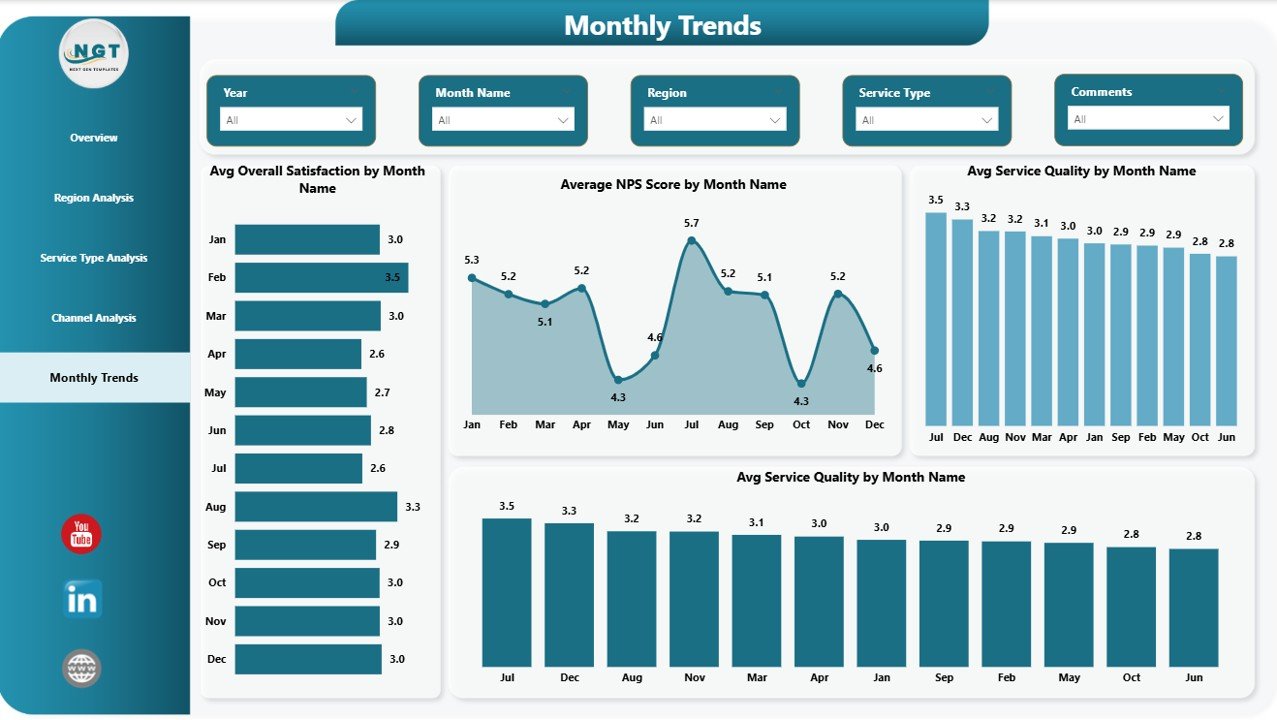
✅ Monthly Trend Analysis – Monitor satisfaction, timeliness, and NPS trends over time
✅ Dynamic Slicers & Filters – Drill down by region, service type, and response channel
✅ Professional Power BI Visuals – Clean charts, KPI cards, and easy-to-read layouts
## 📦 What’s Inside the Client Satisfaction Survey Dashboard
When you download this product, you get a fully structured Power BI dashboard designed for real-world business use.
📊 Five Dedicated Dashboard Pages
-
Overview Page – High-level summary of client satisfaction performance
-
Region Analysis Page – Regional comparison of responses, NPS, and service metrics
-
Service Type Analysis Page – Performance comparison across services
-
Channel Analysis Page – Channel-wise experience evaluation
-
Monthly Trends Page – Time-based satisfaction and NPS trends
📁 Excel-Based Data Structure
-
Easy-to-use survey data format
-
Simple refresh process in Power BI
📈 Pre-Built Measures
-
Average satisfaction scores
-
Net Promoter Score (NPS)
-
Timeliness and communication metrics
## 🛠️ How to Use the Client Satisfaction Survey Dashboard
Using this dashboard is simple and requires no advanced Power BI expertise:
1️⃣ Collect Client Survey Data
Capture responses using forms or survey tools and store them in Excel.
2️⃣ Load Data into Power BI
Connect the Excel file to the Power BI dashboard.
3️⃣ Refresh the Dashboard
Click refresh to update visuals instantly.
4️⃣ Apply Filters & Slicers
Analyze results by region, service type, or channel.
5️⃣ Take Action
Identify problem areas, track improvements, and improve client experience.
## 👥 Who Can Benefit from This Client Satisfaction Survey Dashboard
This dashboard is ideal for teams and organizations that value customer experience:
🎯 Customer Experience & Support Teams – Track satisfaction and service quality
🎯 Service Operations Teams – Improve delivery and response times
🎯 Sales & Account Managers – Understand client sentiment and loyalty
🎯 Regional Managers – Compare performance across locations
🎯 Senior Management – Make data-driven customer strategy decisions
🎯 Consultants & Analysts – Deliver professional client reports
Click here to read the Detailed blog post
Watch the step-by-step video tutorial: