


Converting leads into paying customers is the heartbeat of every business. But without a structured way to visualize your pipeline, it’s easy to lose track of opportunities, miss bottlenecks, or overlook top-performing channels. That’s where the Sales Funnel Dashboard in Power BI comes in — a powerful, ready-to-use tool that gives you complete visibility into your sales process. 📊🚀
This interactive dashboard is designed for sales leaders, managers, and executives who want real-time insights into leads, opportunities, conversions, and rep performance. With multiple pages, drill-down charts, and dynamic visuals, you can monitor every stage of the funnel, identify underperforming areas, and make data-driven decisions that drive revenue.
🔑 Key Features of Sales Funnel Dashboard in Power BI
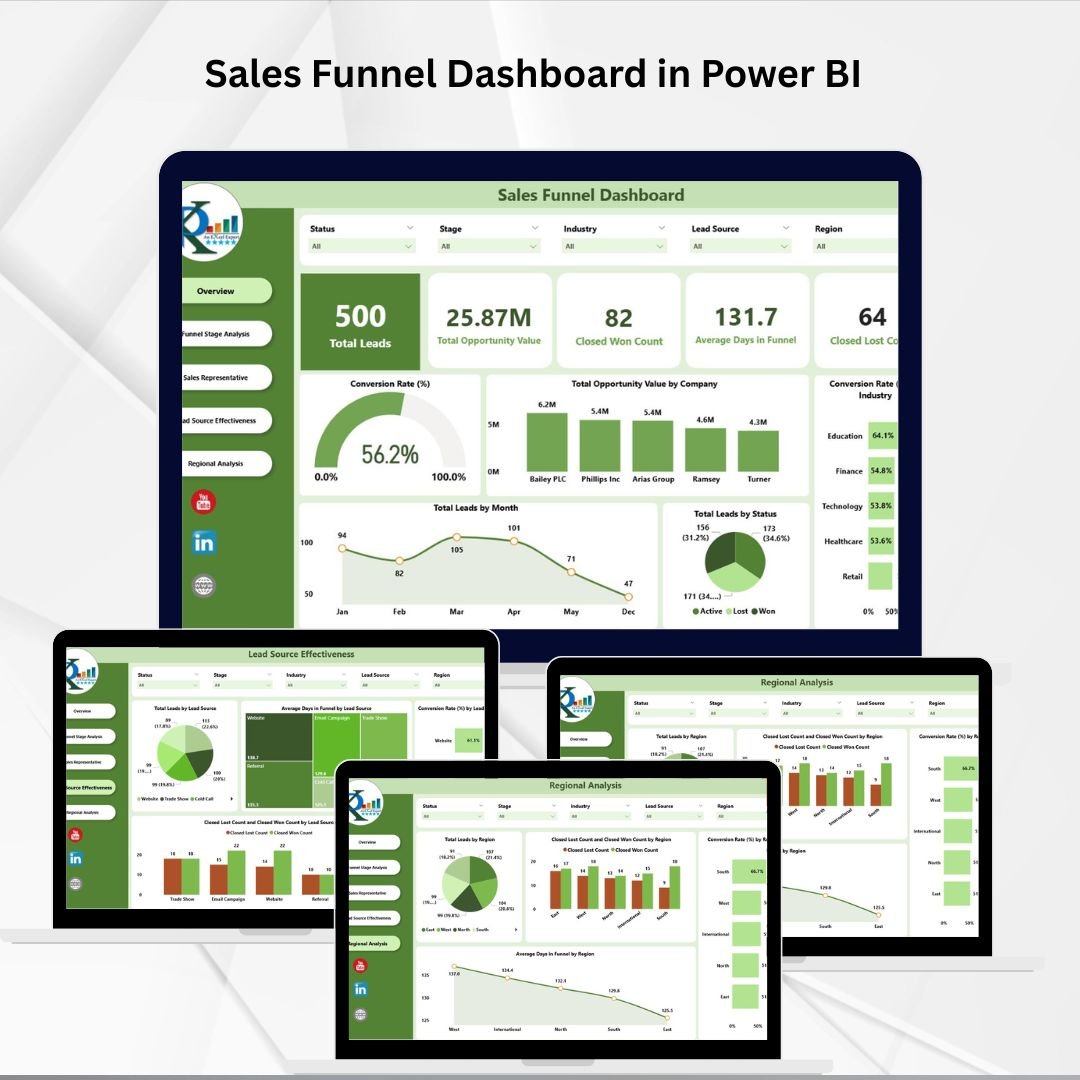
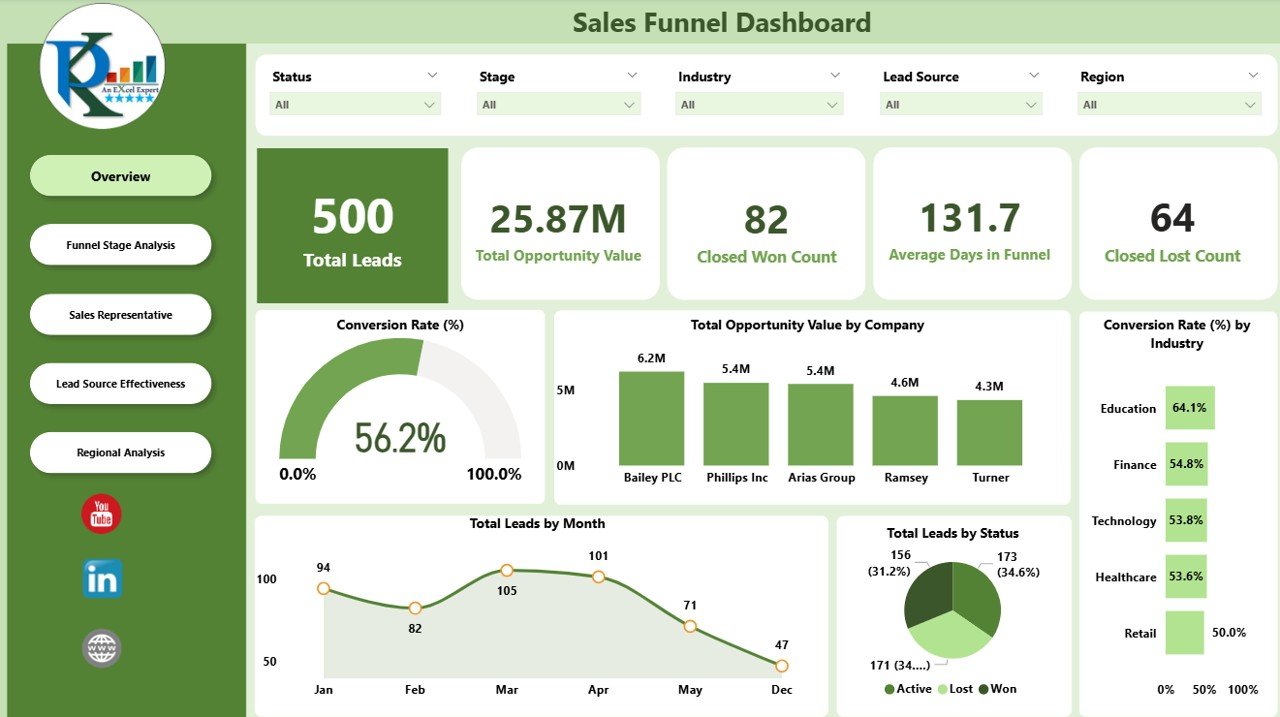
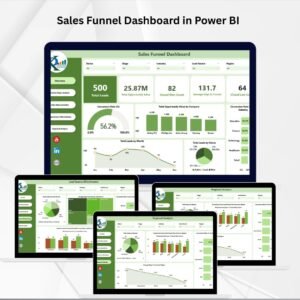
📋 Overview Page
Cards for Total Leads, Opportunity Value, Closed Won, Closed Lost, Avg. Days in Funnel.
Charts for Conversion Rate, Opportunity Value by Company, Conversion by Industry, Leads by Month & Status.
Get a snapshot of your funnel health in seconds.
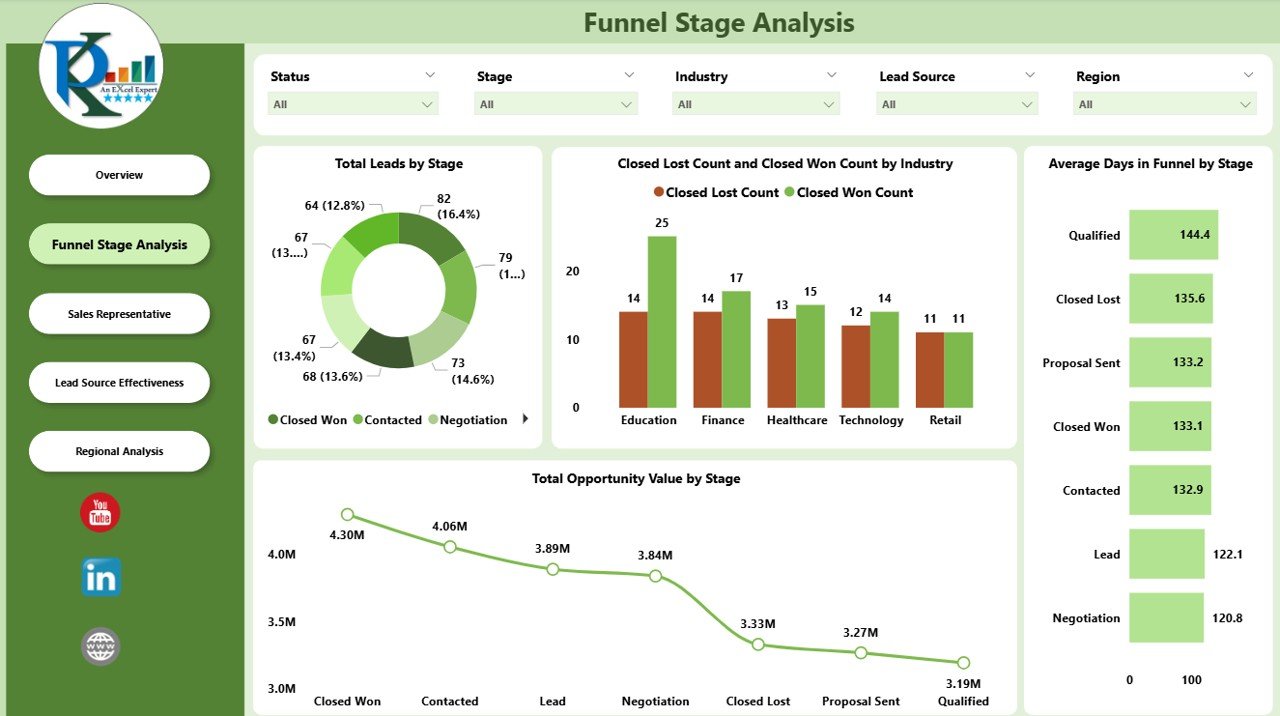
📈 Funnel Stage Analysis
Visualize Total Leads by Stage to spot bottlenecks.
Compare Closed Won vs. Closed Lost by Industry.
Track Opportunity Value & Avg. Days per Stage.
Optimize pipeline flow and reduce lead stagnation.
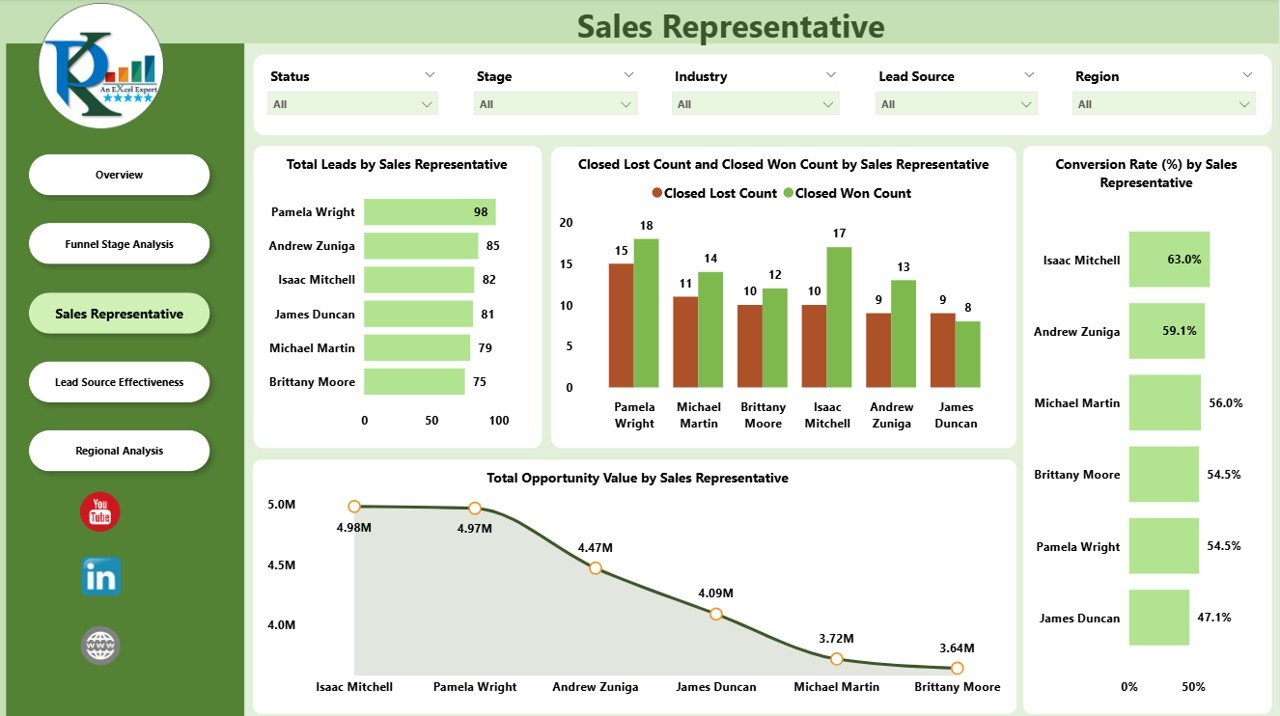
🧑💼 Sales Representative Page
Assess Leads managed per rep.
Measure Closed Won vs. Closed Lost by Rep.
Analyze Opportunity Value & Conversion Rates per Rep.
Reward top performers and support underperformers.
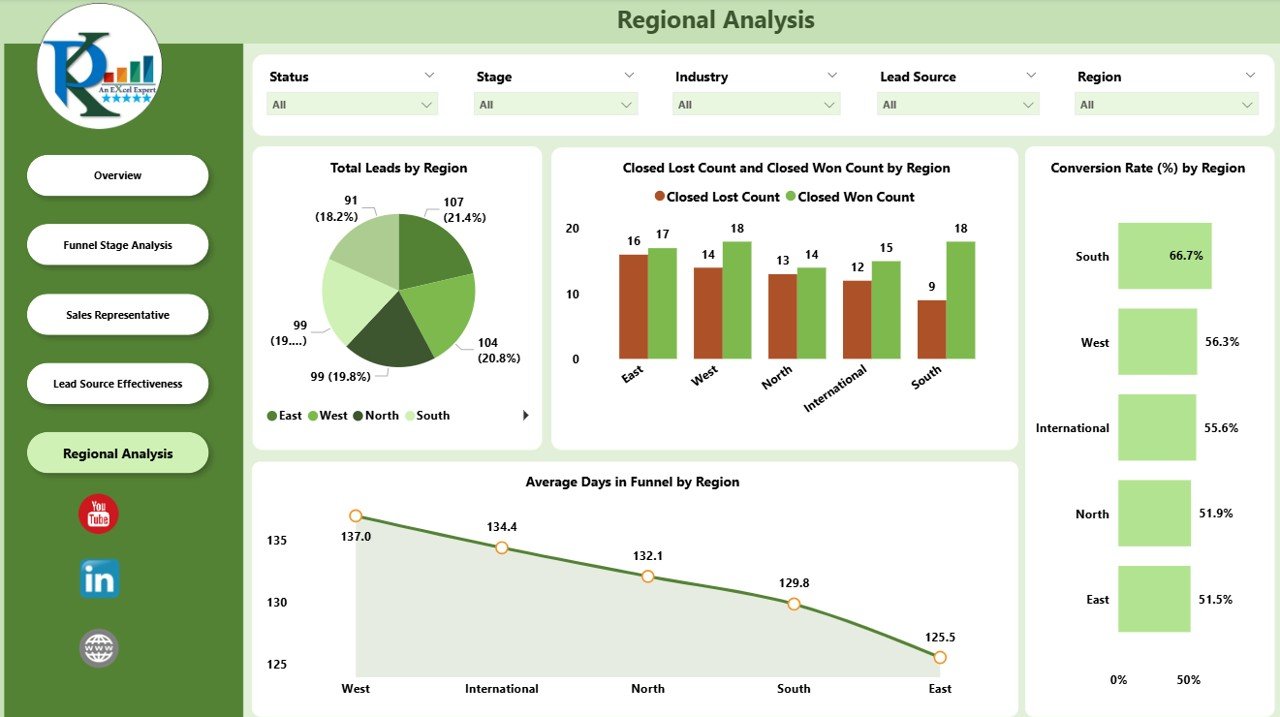
🌍 Regional Analysis
Breakdown of Leads, Wins, Losses, Conversion Rates, Avg. Days in Funnel by region.
Allocate resources to high-performing geographies.
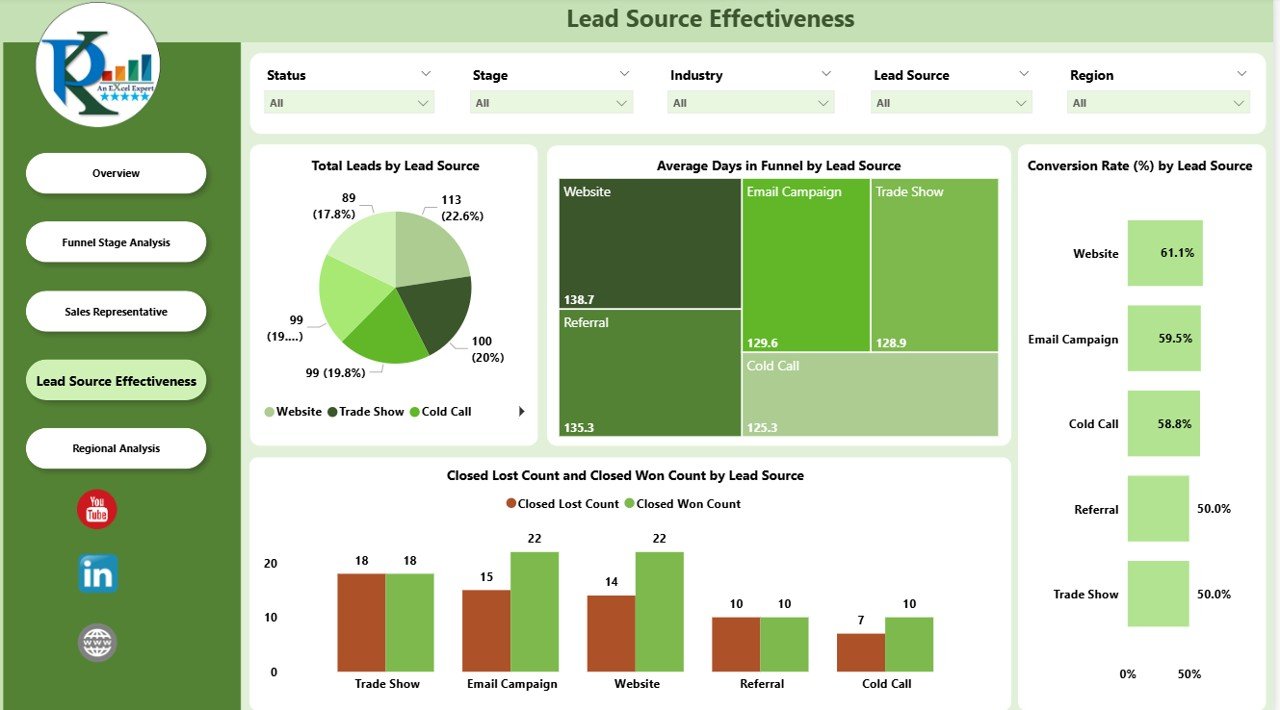
📣 Lead Source Effectiveness
Evaluate which channels bring the best results.
Charts for Leads by Source, Avg. Days per Source, Conversion Rate, Opportunity Value.
Double down on profitable lead channels.
📦 What’s Inside the Dashboard?
✅ 5 Interactive Pages – Overview, Funnel Stages, Sales Reps, Regions, Lead Sources
✅ Dynamic Visuals – Conversion funnels, bar/line charts, KPIs with arrows
✅ Drill-Down Features – Analyze by industry, rep, or region
✅ Ready-to-Use KPIs – MTD/YTD metrics, conversion rates, opportunity values
✅ Customizable Design – Add/remove KPIs or adapt visuals to your process
✅ Power BI Compatibility – Runs smoothly with your CRM data sources
🎯 Who Can Benefit from This Dashboard?
💼 Sales Managers – Track team performance and funnel health.
📊 Executives – Gain high-level insights into revenue opportunities.
🧑💻 Sales Reps – Monitor personal leads and conversion efficiency.
📣 Marketing Teams – See which lead sources generate ROI.
🏢 Startups & Enterprises – Adaptable to businesses of any size.
🧠 How to Use the Sales Funnel Dashboard
Connect your CRM or sales data source to Power BI.
Load leads, opportunities, and sales rep data into the model.
Use slicers to filter by timeframe, rep, industry, or region.
Navigate between the Overview, Funnel, Reps, Regions, and Sources pages.
Review charts to identify bottlenecks, high-value leads, and rep efficiency.
Share interactive dashboards with your team for collaboration.
No coding required — just clean, interactive visuals that drive results. 🎯
🚀 Advantages of Using This Dashboard
Real-Time Visibility – Instantly track pipeline health.
Identify Bottlenecks – Spot where leads get stuck.
Rep Performance Tracking – Coach and reward based on data.
Lead Source ROI – Focus on profitable channels.
Regional Insights – Allocate resources strategically.
Revenue Forecasting – Predict outcomes from opportunity values.
Customizable – Adapt to your sales process with ease.
🔗 Click here to read the Detailed blog post
Watch the step-by-step video Demo:
🔗 Visit our YouTube channel to learn step-by-step video tutorials
Compatibility and Requirements
- Works in Power BI Desktop, which is free to download. Get Power BI Desktop from Microsoft.
- You connect your CRM or sales data source and load leads, opportunities and sales rep data into the model.
Frequently Asked Questions
How many pages does the dashboard have?
Five pages: Overview, Funnel Stages, Sales Reps, Regions and Lead Sources.
Which KPIs does it show?
The Overview page has cards for Total Leads, Opportunity Value, Closed Won, Closed Lost and Avg. Days in Funnel. Charts cover conversion rate, opportunity value by company, conversion by industry and leads by month and status.
Can I see how each sales rep is doing?
Yes. The Sales Representative page shows leads managed per rep, Closed Won vs. Closed Lost by rep, and opportunity value and conversion rates per rep.
Can I find out which lead sources work best?
Yes. The Lead Sources page has charts for leads by source, average days per source, conversion rate and opportunity value.
Can I filter the data?
Yes. Slicers filter by timeframe, rep, industry or region, and you can drill down by industry, rep or region.
Is there an Excel or Google Sheets version?
Yes. See the Sales Funnel Dashboard in Excel and the Sales Funnel Dashboard in Google Sheets.
Related Sales Templates
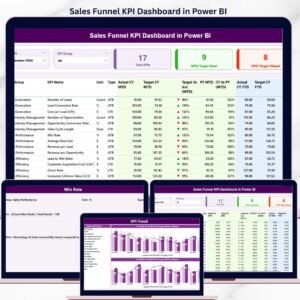
- Sales Funnel KPI Dashboard in Power BI: a KPI-focused funnel view in Power BI
- Sales Funnel Dashboard in Excel: the same funnel dashboard in Excel
- Sales Funnel Dashboard in Google Sheets: the Google Sheets edition
- Power BI Dashboard Mega Collection: 15 Power BI dashboard templates in one download
Browse all Power BI dashboards.













Reviews
There are no reviews yet.