
Managing a team in today’s fast-paced business world goes beyond assigning tasks—it requires real-time insights, accountability, and data-driven decision-making. Static reports and spreadsheets often fall short, leaving managers blind to delays, bottlenecks, and performance gaps. That’s why the Team Performance Dashboard in Power BI is a game-changer.
This ready-to-use dashboard transforms raw data into interactive charts, KPIs, and trends that help leaders track productivity, measure progress, and optimize resources. Built on Power BI’s intuitive interface, it empowers organizations to monitor performance at team, task, and monthly levels—providing a complete view of how work gets done.
Whether you’re a project manager, HR leader, or executive, this dashboard provides the clarity and transparency needed to improve efficiency, foster accountability, and drive continuous improvement.
✨ Key Features of Team Performance Dashboard in Power BI
-
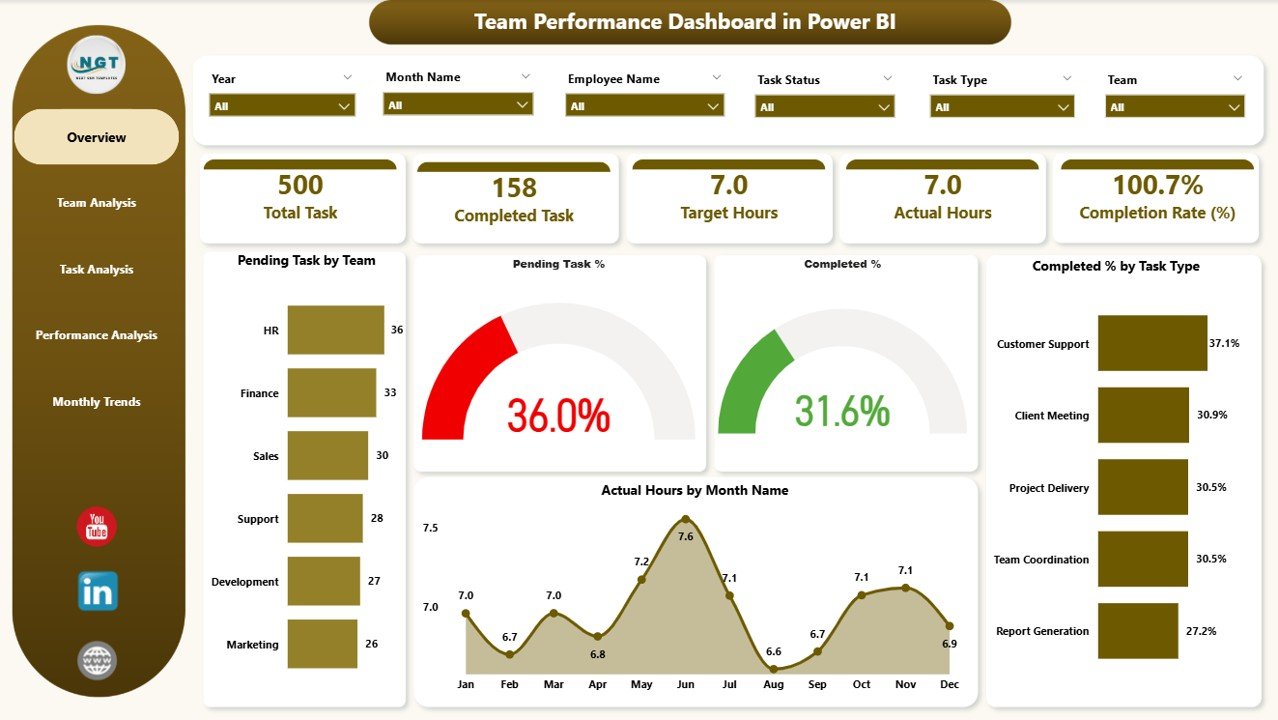
🏠 Overview Page – Get a quick snapshot with slicers, KPI cards, and charts showing Pending Tasks, Completion %, and Actual Hours by Month.
-
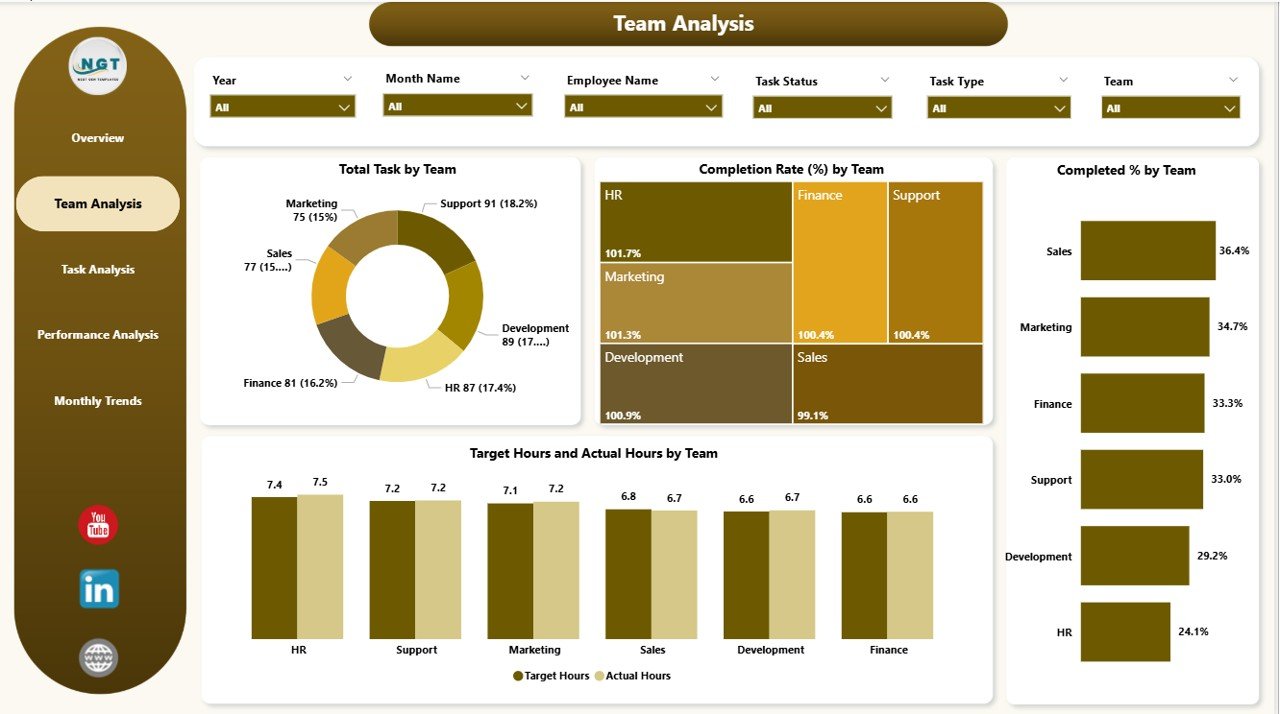
👥 Team Analysis Page – Evaluate performance by department or team with metrics like Completion Rate (%) and Target Hours vs Actual Hours.
-
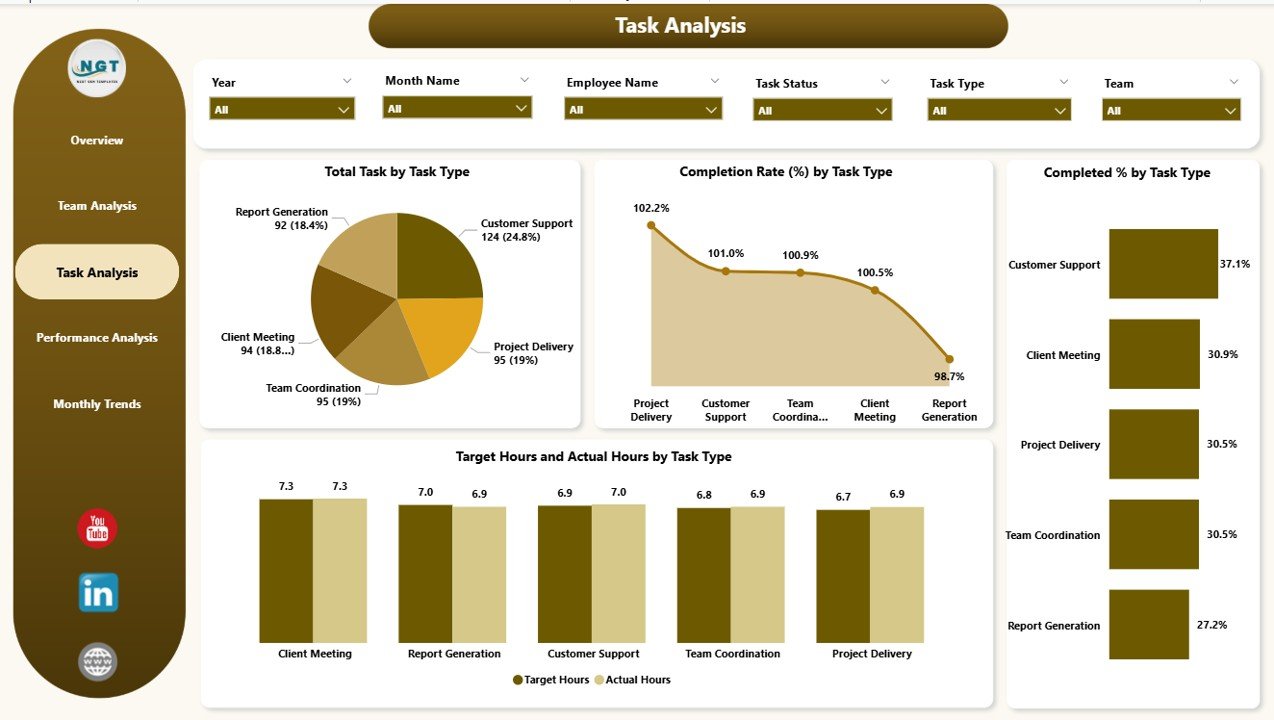
📋 Task Analysis Page – Analyze performance by task type, including workload distribution and task efficiency.
-
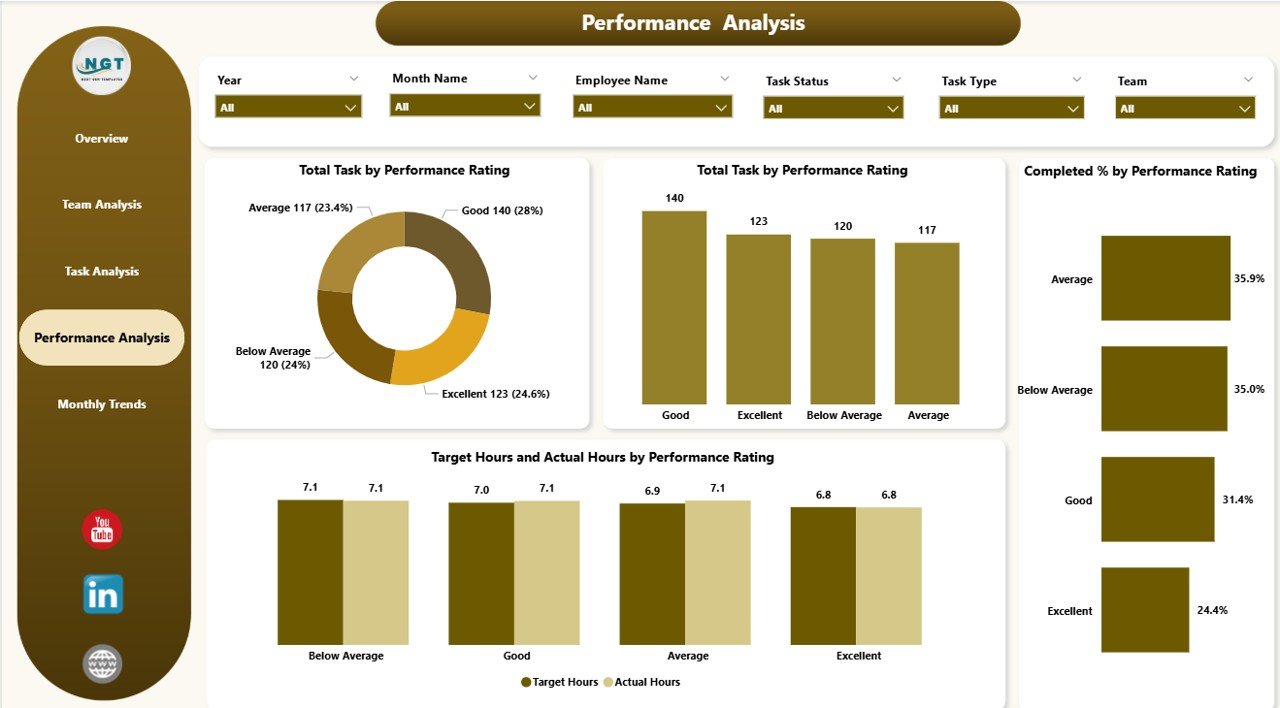
⭐ Performance Analysis Page – Link performance ratings with task completion and hours to recognize top contributors.
-
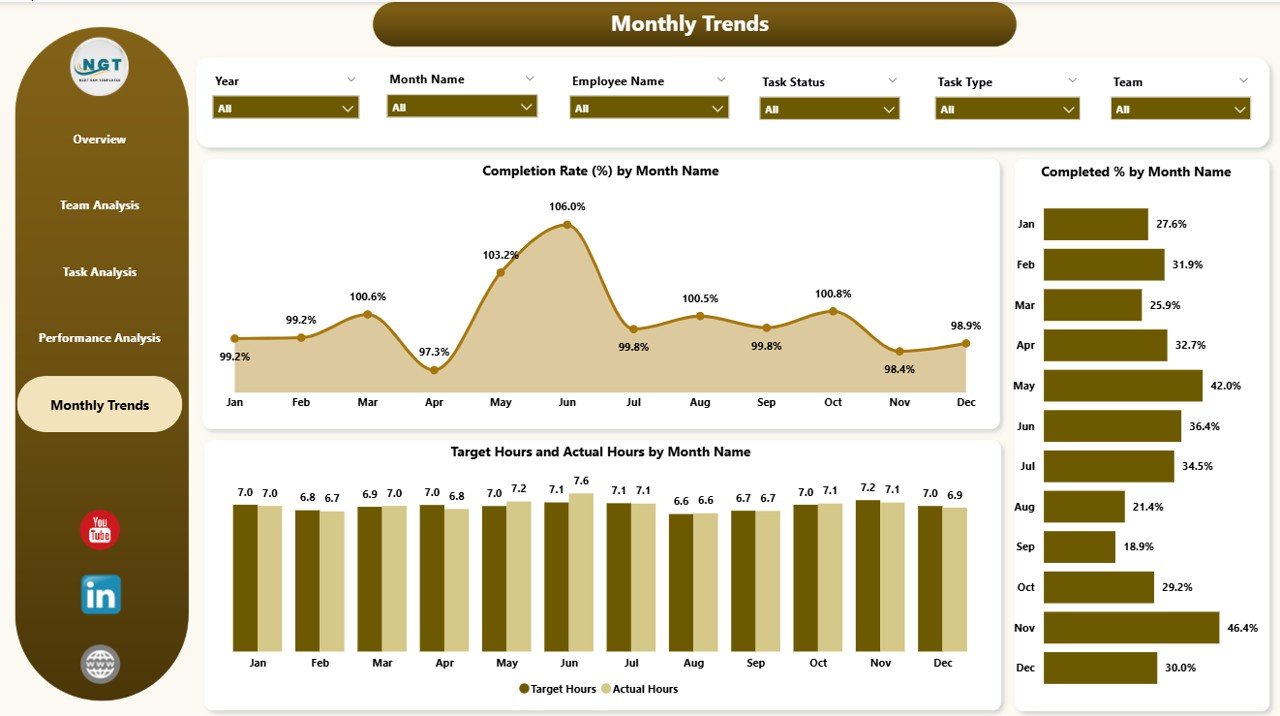
📆 Monthly Trends Page – Track progress over time with monthly completion rates, availability %, and trend insights.
-
⚡ Interactive Slicers – Filter by team, task, rating, or timeline for flexible reporting.
-
📊 Excel Integration – Easily load task and performance data from Excel for automated updates.
-
🎨 User-Friendly Design – Clean layouts, conditional formatting, and intuitive visuals for quick decision-making.
📂 What’s Inside the Team Performance Dashboard
This template includes five structured pages, each offering unique insights:
-
Overview Page – High-level performance KPIs with quick filters.
-
Team Analysis Page – Detailed breakdown of productivity by team.
-
Task Analysis Page – Task-type performance and workload trends.
-
Performance Analysis Page – Quality-based metrics linked with output.
-
Monthly Trends Page – Time-based tracking to identify seasonal or long-term trends.
🛠 How to Use the Team Performance Dashboard
-
Collect Data – Gather task and performance data from Excel or other sources.
-
Load into Power BI – Import and connect the dataset using Power Query.
-
Navigate Pages – Explore Overview, Team, Task, and Monthly views.
-
Filter with Slicers – Drill into specific teams, tasks, or timelines.
-
Interpret KPIs – Compare actuals vs. targets to identify gaps.
-
Share & Collaborate – Publish in Power BI Service and share with stakeholders.
👥 Who Can Benefit from This Dashboard
This dashboard is versatile and can be used across industries:
-
👨💼 Managers & Team Leaders – Gain visibility into team performance.
-
🏢 HR & Workforce Planners – Track workloads, efficiency, and productivity.
-
📊 Executives – Align performance with organizational goals.
-
👩💻 Project Managers – Monitor task-level progress and resource allocation.
-
🛡 Compliance & Operations Teams – Ensure accountability and timely completion.


Reviews
There are no reviews yet.