

Measuring employee satisfaction is a cornerstone of building an engaged, motivated, and high-performing workforce. Organizations that consistently track employee feedback can proactively address challenges, reduce turnover, and create a more positive work culture. The Employee Satisfaction Dashboard in Power BI is a ready-to-use, interactive solution designed for HR teams, managers, and leadership to monitor employee satisfaction across multiple dimensions.Employee Satisfaction Dashboard in Power BI
This dashboard consolidates survey results and employee feedback into clear, visual insights—allowing you to identify patterns by department, role, location, and demographics. By focusing on areas like compensation, management, work environment, and growth opportunities, it ensures leadership can make data-driven HR decisions that strengthen retention and workplace engagement.
🔑 Key Features of Employee Satisfaction Dashboard
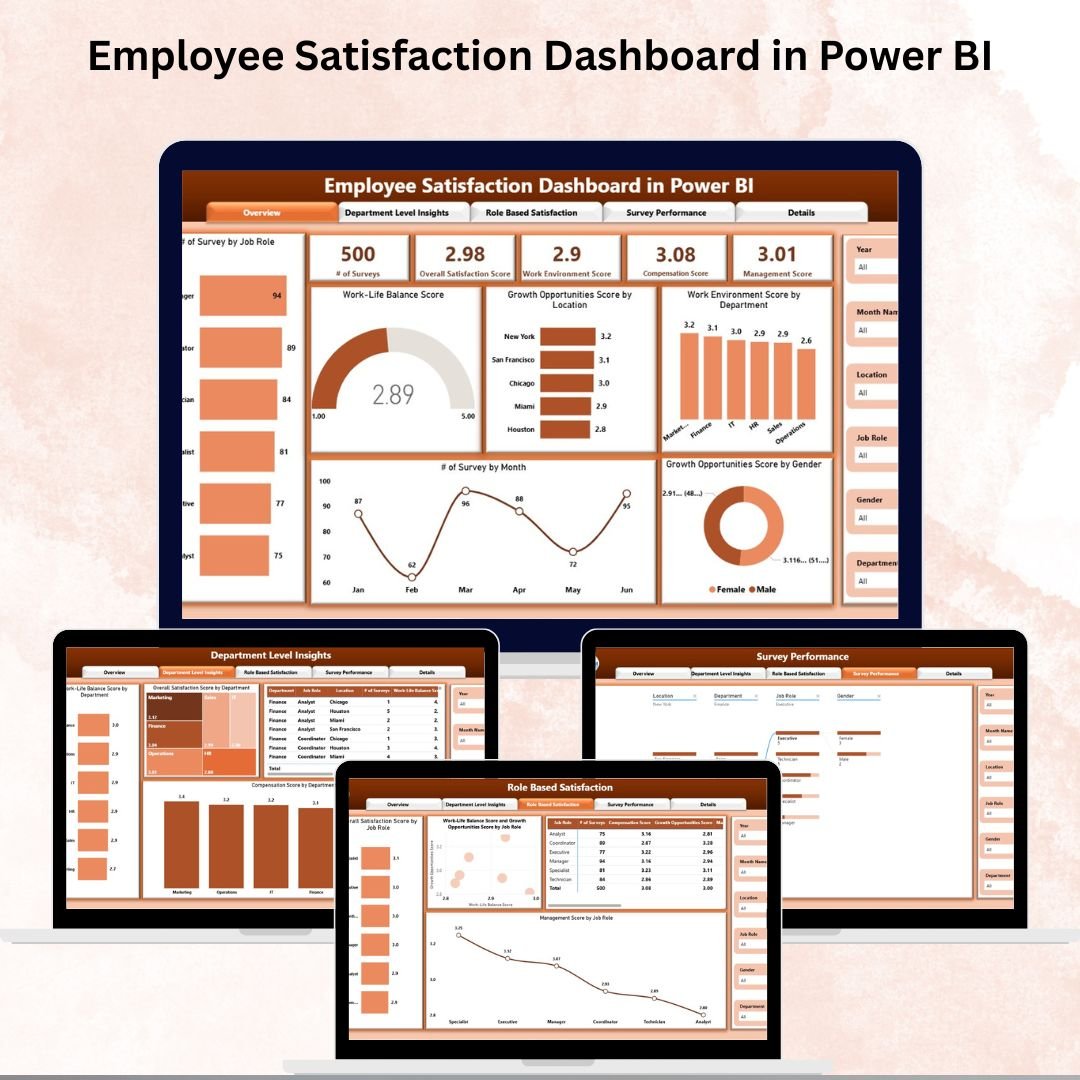
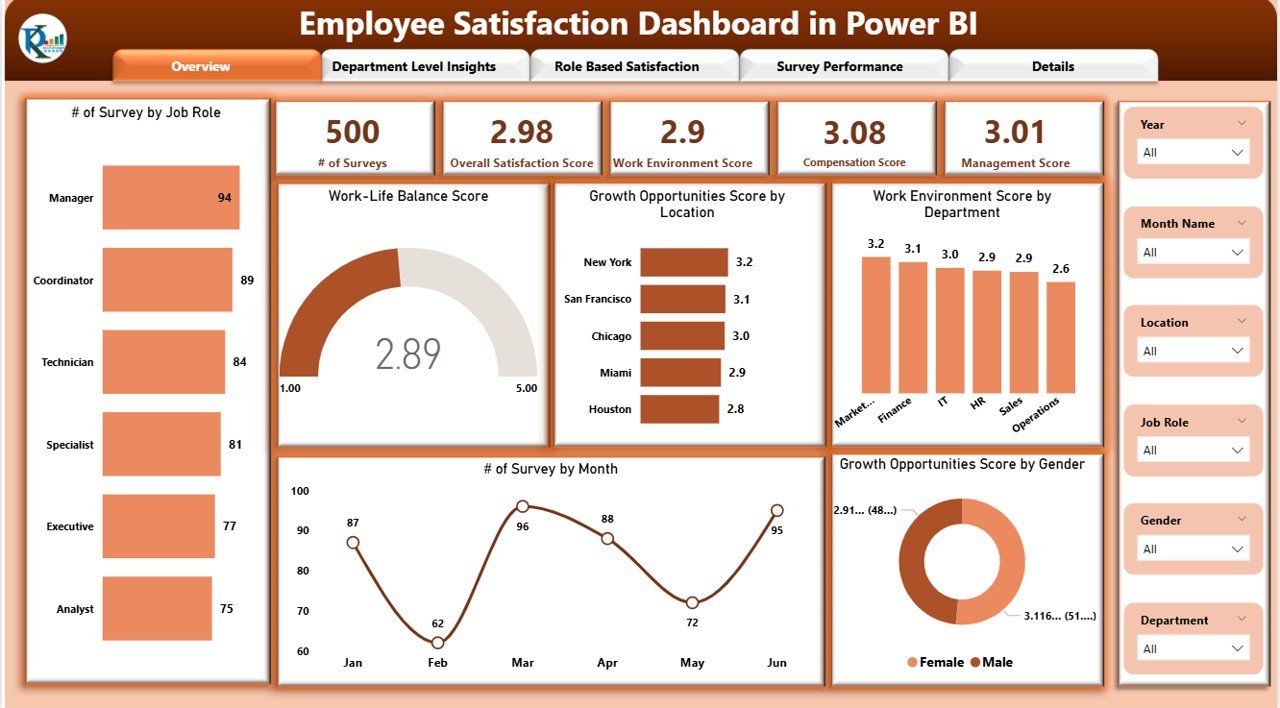
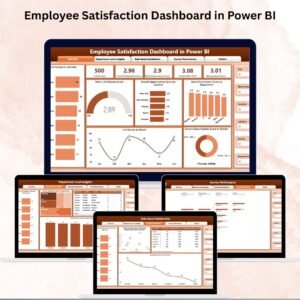
📊 Overview Page
Cards displaying:
of Surveys
Overall Satisfaction Score
Work Environment Score
Compensation Score
Management Score
Charts included:
Work-Life Balance Score
Growth Opportunities by Location
Work Environment Score by Department
Surveys by Month (participation trends)
Growth Opportunities Score by Gender
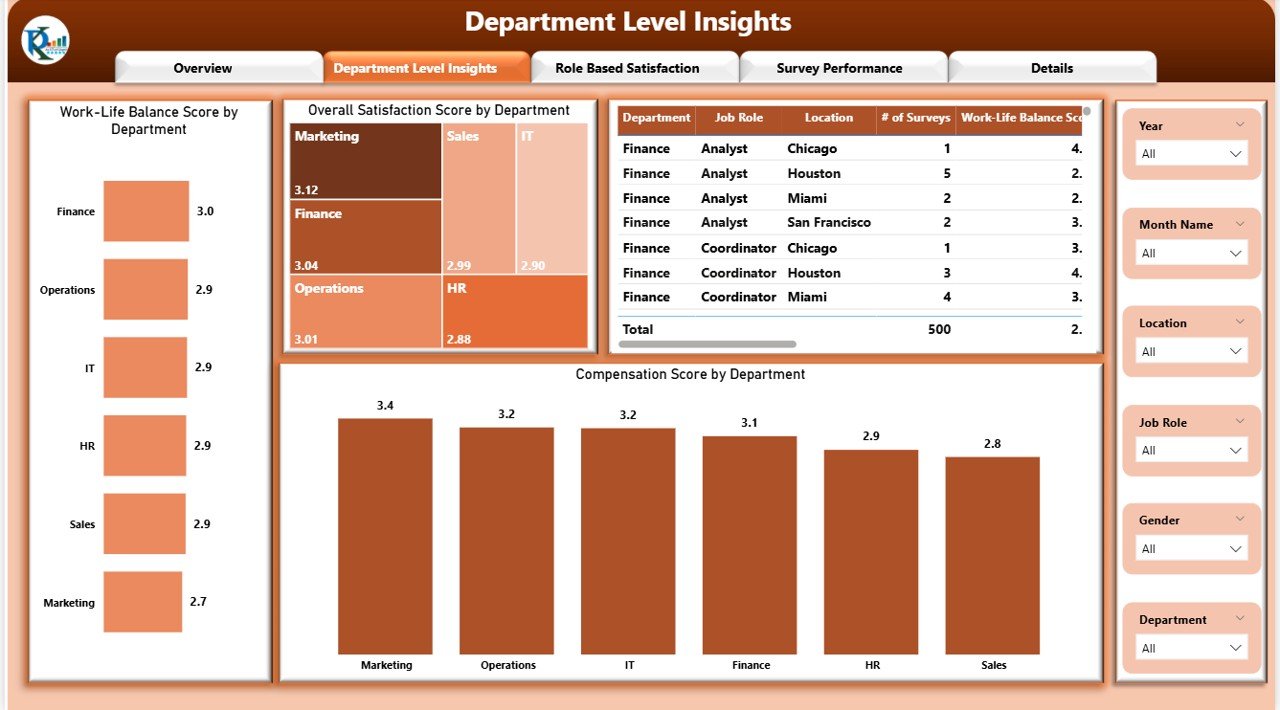
🏢 Department Level Insights
Work-Life Balance Score by Department
Overall Satisfaction by Department
Compensation Score by Department
Identify teams with low engagement and target improvements.
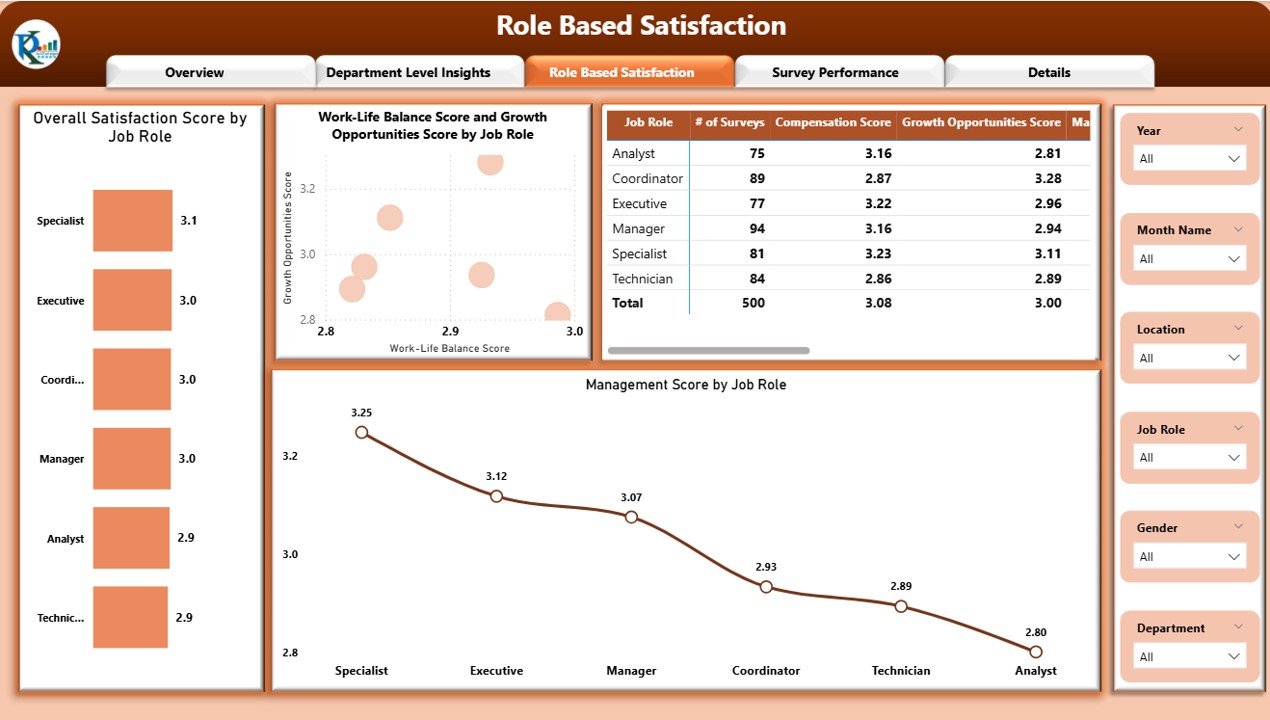
👔 Role-Based Satisfaction
Overall Satisfaction Score by Job Role
Work-Life Balance vs Growth Opportunities by Role
Management Score by Role
Ideal for career development and HR interventions.
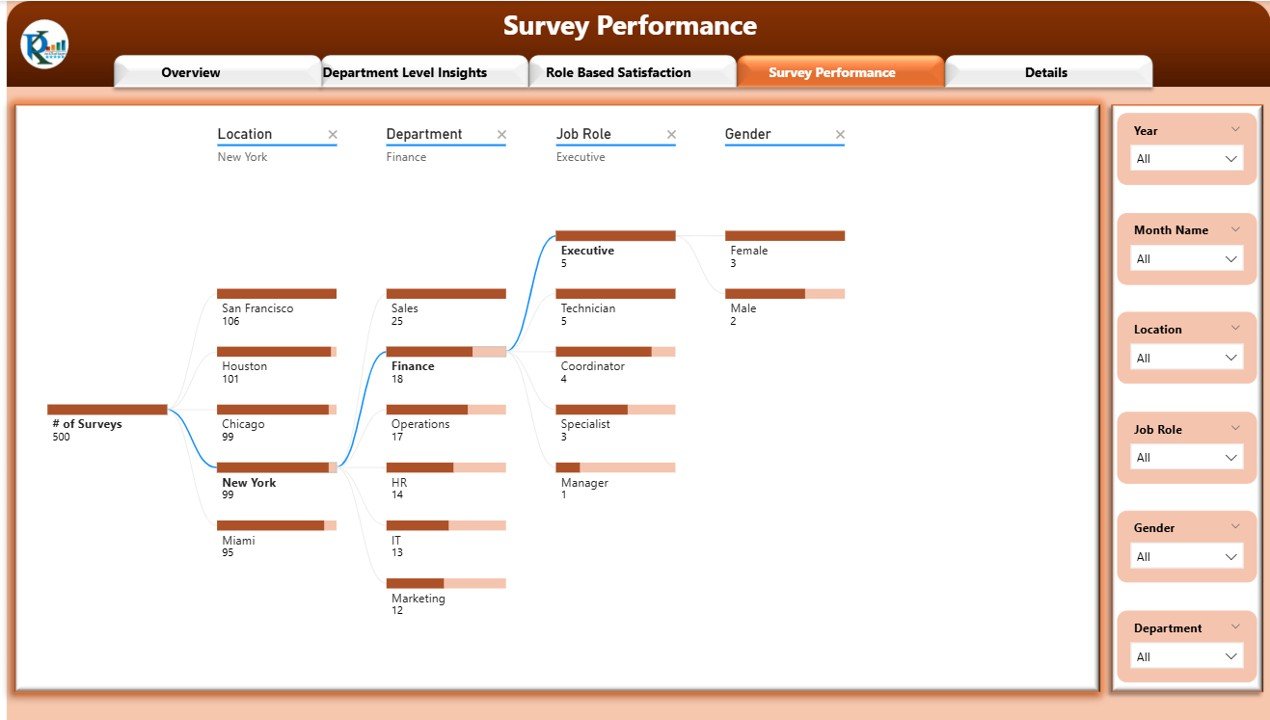
📈 Survey Performance
Decomposition Tree for drilling into results by department, role, and location
Trend charts for deeper insights
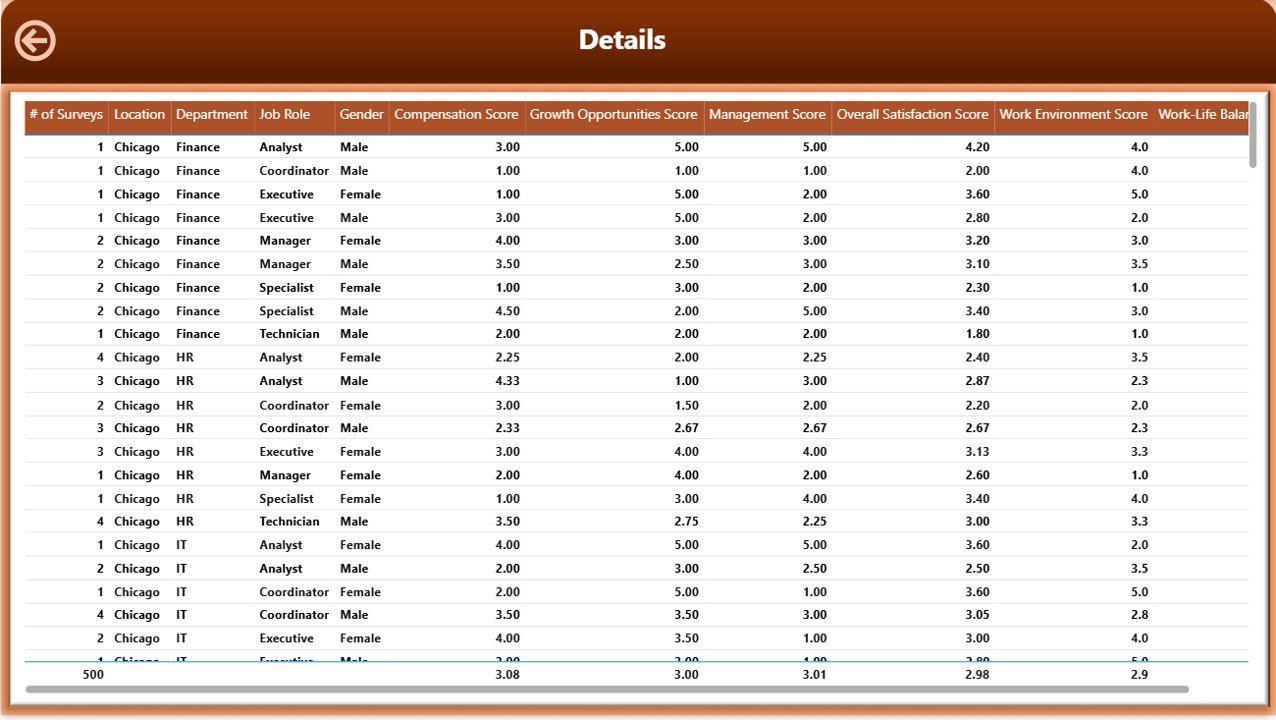
Tables showing individual survey performance
📦 What’s Inside the Dashboard
✅ Multiple Power BI Pages – Overview, Department Insights, Role-Based Satisfaction, Survey Performance
✅ Interactive Visuals – Drilldowns, decomposition trees, and filters
✅ Comprehensive Metrics – Scores across compensation, growth, management, and environment
✅ Trend Tracking – Monitor survey participation and results over time
✅ Customizable Design – Add new KPIs, modify filters, or connect to live survey tools
👥 Who Can Benefit from This Dashboard?
👩💼 HR Teams – Monitor employee engagement and satisfaction holistically.
🏢 Managers & Department Heads – Identify departmental strengths and weaknesses.
👨💻 Business Leaders – Use insights to shape company culture and strategy.
📊 Analysts & Decision-Makers – Gain actionable insights for retention planning.
This dashboard is perfect for organizations of all sizes, from startups to enterprises, looking to strengthen employee engagement.
📋 Best Practices for Using the Dashboard
🔄 Update Data Frequently – Ensure new surveys are integrated regularly.
🎯 Encourage Participation – Higher participation means better insights.
📊 Analyze Department Trends – Focus on departments with lower scores.
👔 Compare Roles & Locations – Identify satisfaction gaps across teams.
📢 Share Insights – Use visuals in HR and leadership meetings.
✅ Advantages of Employee Satisfaction Dashboard
Comprehensive Insights – Monitor multiple dimensions of satisfaction.
Department & Role Drilldowns – Identify specific challenges.
Employee-Centric Decisions – Use feedback to shape workplace policies.
Dynamic & Visual – Power BI visuals make insights easy to digest.
Retention-Oriented – Prevent attrition by acting on data trends.
Scalable & Customizable – Adapt to your organization’s evolving needs.

























Reviews
There are no reviews yet.