



Tax advisory services are becoming more complex, regulated, and data-intensive every year. Firms must track tax amounts, case progress, penalties avoided, consulting fees, client satisfaction, and performance trends—all while responding quickly to regulatory and client demands. Static spreadsheets and manual reports simply cannot keep up anymore.
The Tax Advisory Dashboard in Power BI is a ready-to-use, interactive business intelligence solution designed to give tax advisory firms real-time visibility and actionable insights across all critical tax metrics. Instead of juggling multiple reports, this dashboard consolidates everything into one powerful Power BI model—helping you make faster, smarter, and more confident decisions.
Built for real-world advisory use, this dashboard transforms raw tax data into clear visuals, dynamic KPIs, and deep analytical views without complexity.
🚀 Key Features of Tax Advisory Dashboard in Power BI
📊 Real-Time Tax Performance Monitoring
Track tax amounts, penalties avoided, consulting fees, and case progress instantly.
🎯 Interactive Filters & Slicers
Analyze performance by tax type, industry, city, and month with a single click.
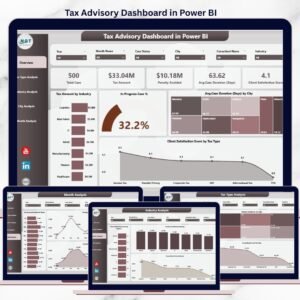
📈 Five Dedicated Analysis Pages
Overview, Tax Type Analysis, Industry Analysis, City Analysis, and Month Analysis.
⚡ Automatic Data Refresh
Dashboard updates automatically as new data is loaded.
🔍 Deep Drill-Down Capabilities
Move from high-level KPIs to detailed insights effortlessly.
🔐 Enterprise-Grade Security
Role-based access and secure data handling through Power BI.
🎨 Clean, Professional Design
Executive-ready layout ideal for reviews, audits, and client reporting.
📦 What’s Inside the Tax Advisory Dashboard in Power BI
📁 Overview Page

Executive summary with key KPIs such as In-Progress Case %, Tax Amount by Industry, Average Case Duration by City, and Client Satisfaction by Tax Type.
📁 Tax Type Analysis Page
Analyze Tax Amount, Penalty Avoided, and Consulting Fee by tax category to identify high-value services.
📁 Industry Analysis Page
Understand satisfaction scores, penalties avoided, and revenue contribution across industries.
📁 City Analysis Page
Evaluate city-wise performance, advisory value delivered, and revenue distribution.
📁 Month Analysis Page
Track trends, seasonality, peak periods, and revenue momentum over time.
📁 Interactive Filters & Visuals
Cards, bar charts, line charts, and slicers for seamless exploration.
🛠️ How to Use the Tax Advisory Dashboard in Power BI
1️⃣ Connect your tax advisory data sources (Excel, CRM, ERP, or databases)
2️⃣ Refresh the Power BI dataset
3️⃣ Use slicers to filter by tax type, industry, city, or month
4️⃣ Review KPIs and trends across analysis pages
5️⃣ Drill down into problem areas or high-performing segments
6️⃣ Export insights for internal reviews or client presentations
No coding required—Power BI’s intuitive interface makes it easy to use.
👥 Who Can Benefit from This Tax Advisory Dashboard
👨💼 Tax Advisory Firms & Consultants – Monitor performance and advisory impact
📊 Accounting & Audit Firms – Track fees, penalties avoided, and client value
🏢 CFOs & Finance Leaders – Gain clarity on tax exposure and profitability
⚠️ Compliance Managers – Improve monitoring and reduce regulatory risks
📈 Business & Data Analysts – Deliver insights faster with automation
If your firm relies on tax data, this dashboard becomes an essential analytics asset.
📘 Click here to read the Detailed blog post
🎥 Visit our YouTube channel to learn step-by-step video tutorials
👉 Youtube.com/@PKAnExcelExpert
Watch the step-by-step video tutorial:
Compatibility and Requirements
- Works in Power BI Desktop, which is free to download. Microsoft explains how to get Power BI Desktop.
- Connect your own tax advisory data from Excel, a CRM, an ERP or a database, then refresh the dataset.
Frequently Asked Questions
Which pages are included?
Five pages: Overview, Tax Type Analysis, Industry Analysis, City Analysis and Month Analysis.
Which tax metrics does it track?
Tax amount, penalties avoided, consulting fees, case progress, average case duration and client satisfaction. You can view them by tax type, industry, city and month.
Where does my data come from?
You connect your own sources, such as Excel files, a CRM, an ERP or a database, and refresh the Power BI dataset. The dashboard updates when new data loads.
Do I need to write code?
No coding is required. You use slicers to filter by tax type, industry, city or month, and drill down from the KPIs into the detail.
Is there an Excel or Google Sheets version?
Yes. See the Tax Advisory Dashboard in Excel and the Tax Advisory Dashboard in Google Sheets.
Related Tax Templates
- Tax Advisory Dashboard in Excel: the same dashboard for Excel users
- Tax Advisory Dashboard in Google Sheets: a browser-based version
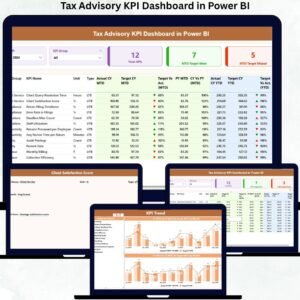
- Tax Advisory KPI Dashboard in Power BI: a KPI-focused Power BI view
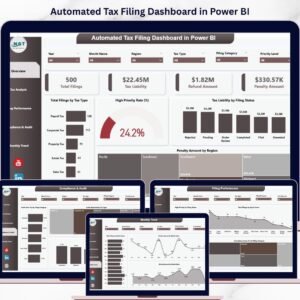
- Automated Tax Filing Dashboard in Power BI: tracks tax filings in Power BI
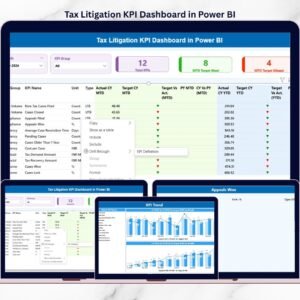
- Tax Litigation KPI Dashboard in Power BI: KPIs for tax litigation cases
Browse all Power BI dashboards.





























Reviews
There are no reviews yet.