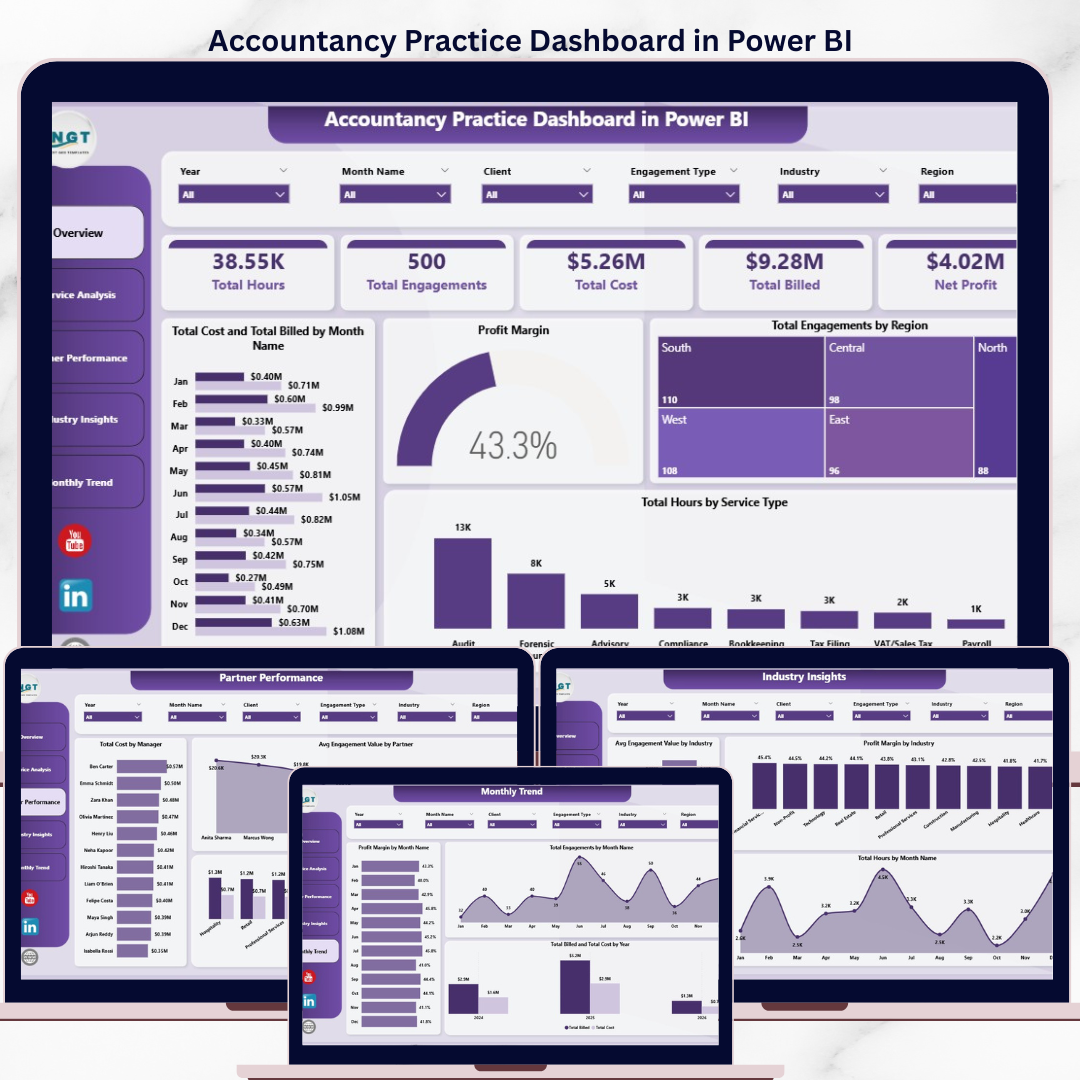


The Accountancy Practice Dashboard in Power BI tracks 5 headline KPIs across 5 interactive report pages — Overview, Service Analysis, Partner Performance, Industry Insights, and Monthly Trend — with 15+ pre-built visuals and multi-dimensional slicers. Setup takes under 15 minutes: connect your engagement dataset to Power Query, click Refresh, and every visual on every page updates automatically with full cross-filtering.
🌍 Join 8,400+ teams in 40+ countries using NextGenTemplates to replace paid SaaS tools with one-time-purchase Excel, Google Sheets, Power BI, and HTML templates.
✅ Instant download · One-time payment · No subscription · No per-user fees · Lifetime access
🔑 Key Features of Accountancy Practice Dashboard in Power BI
🔹 5 Headline KPI Cards — The Overview page surfaces Total Hours, Total Engagements, Total Cost, Total Billed, and Net Profit at a glance, giving practice managers an instant pulse check on firm-wide performance without opening a spreadsheet.
🔹 5 Interactive Report Pages — Each page answers a specific business question: Overview for high-level KPIs, Service Analysis for revenue economics, Partner Performance for benchmarking, Industry Insights for client-sector profitability, and Monthly Trend for management reporting and board packs. This Power BI Dashboard Template covers the full analytical lifecycle of an accountancy practice.
🔹 Service-Level Profit Analysis — The Service Analysis page tracks Total Billed by Partner, Avg Hourly Rate by Service Type, and Profit Margin by Service Type — the three metrics that determine which service lines are worth growing and which are diluting margin.
🔹 Partner and Manager Benchmarking — The Partner Performance page compares Total Cost by Manager and Avg Engagement Value by Partner alongside Total Billed and Total Cost by Industry, giving managing partners the data they need for quarterly reviews and compensation decisions.
🔹 Power Query Auto-Refresh — Replace the sample dataset with your own engagement records, click Refresh in Power BI Desktop, and every KPI card and visual across all 5 pages recalculates instantly. No DAX edits, no relationship rebuilding.
🔹 Publish to Power BI Service — The .pbix file is ready to publish to your Power BI workspace for browser and mobile access. Your partners and managers can view the same report on desktop, web, or the free Power BI mobile app without subscribing to a paid practice management SaaS.
📦 What’s Inside the Accountancy Practice Dashboard in Power BI
The .pbix file ships with 5 fully formatted report pages connected to a clean data model. Every visual is pre-built — just refresh against your data source. Also available as the Accountancy Practice Dashboard in Excel for teams on Microsoft Excel.
1. Overview Page — Five KPI cards (Total Hours, Total Engagements, Total Cost, Total Billed, Net Profit) sit above four visuals: Total Cost and Total Billed by Month Name — tracks monthly billing vs cost to expose margin timing; Profit Margin — firm-wide margin gauge; Total Engagements by Region — geographic client spread; Total Hours by Service Type — capacity consumption across audit, tax, advisory, and compliance. Slicers above the canvas filter all visuals simultaneously.
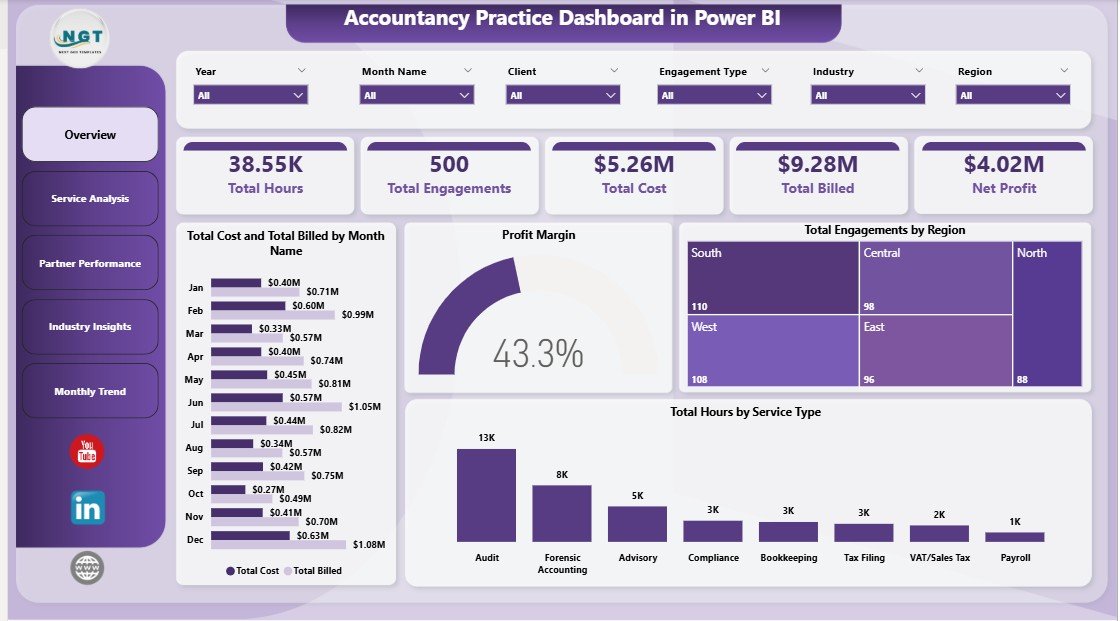
Accountancy Practice Dashboard in Power BI — Overview Page
2. Service Analysis — Three visuals examine service-line economics: Total Billed by Partner — shows each partner’s revenue contribution for compensation review and workload balancing; Avg Hourly Rate by Service Type — benchmarks effective rates per service to identify pricing gaps; Profit Margin by Service Type — the single most important chart for strategic planning, showing which services generate margin and which consume resource without proportional return.
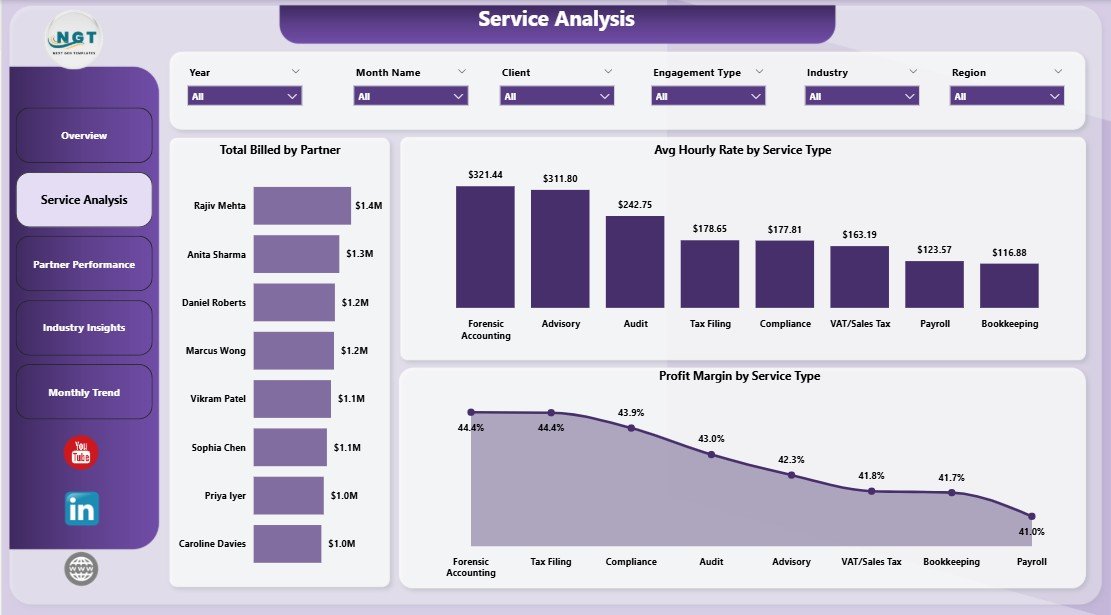
Service Analysis
3. Partner Performance — Three visuals benchmark partner and manager contributions: Total Cost by Manager — shows cost allocation by manager to identify overheads concentrated in specific leadership roles; Avg Engagement Value by Partner — highlights which partners handle the highest-value mandates; Total Billed and Total Cost by Industry — a cross-cut view showing which client industries generate surplus and which run at near-zero margin.
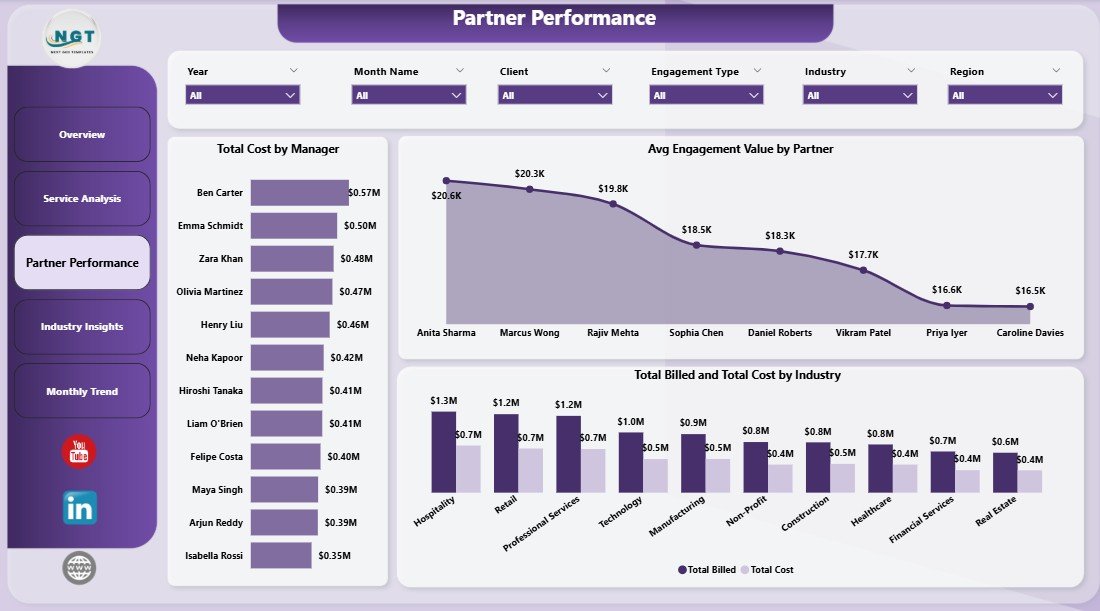
Partner Performance
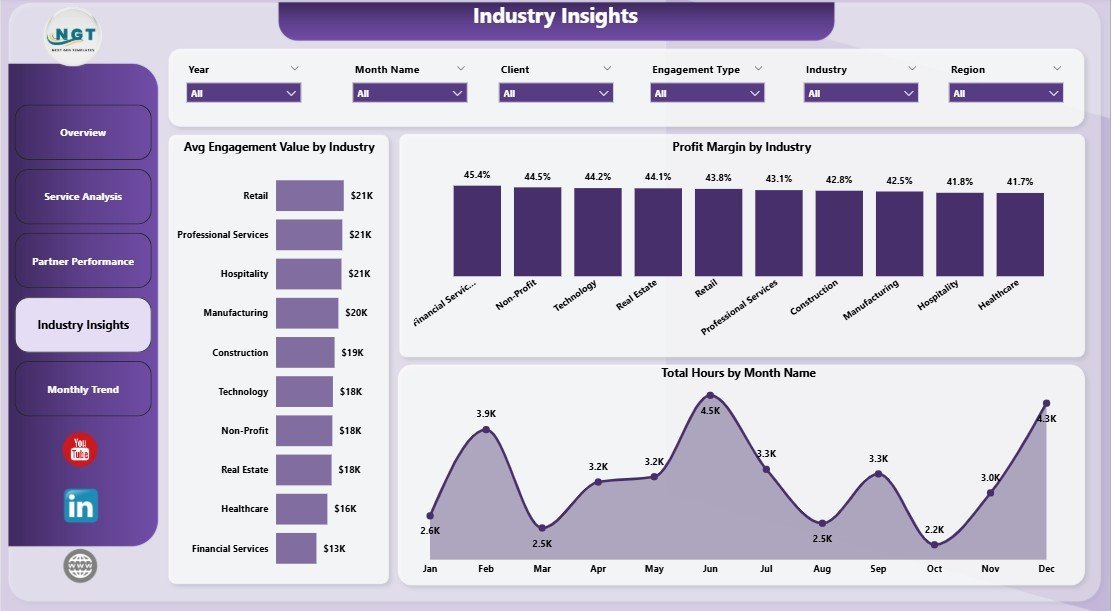
4. Industry Insights — Three visuals for sector-level strategic decisions: Avg Engagement Value by Industry — identifies which industries command the highest engagement fees; Profit Margin by Industry — reveals sectors that are technically complex but margin-thin vs those that are fast and profitable; Total Hours by Month Name — cross-industry time series showing capacity seasonality and growth trends.
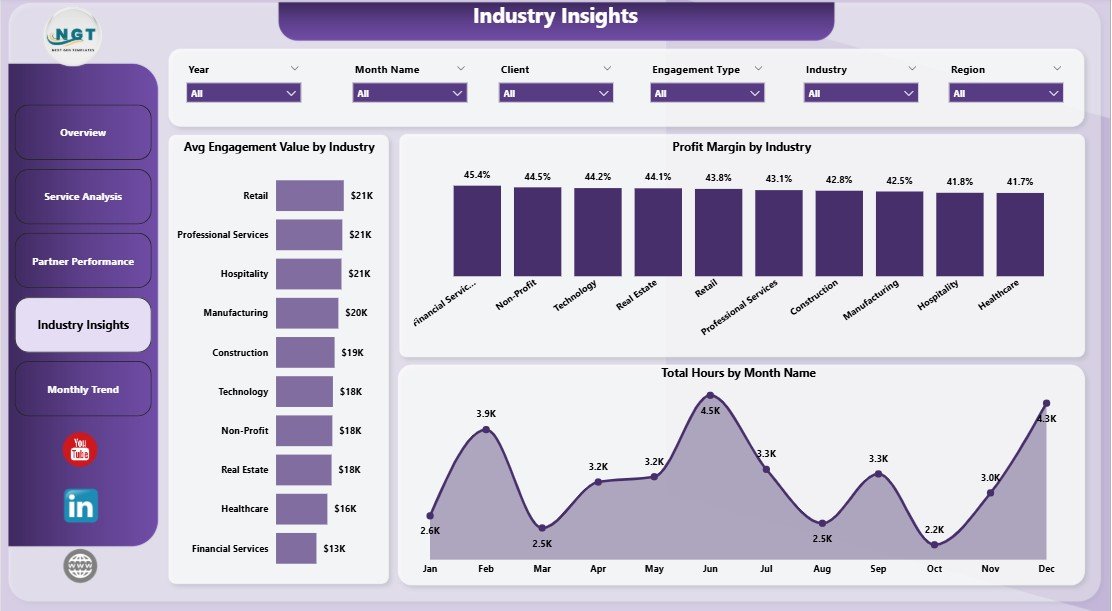
Industry Insights
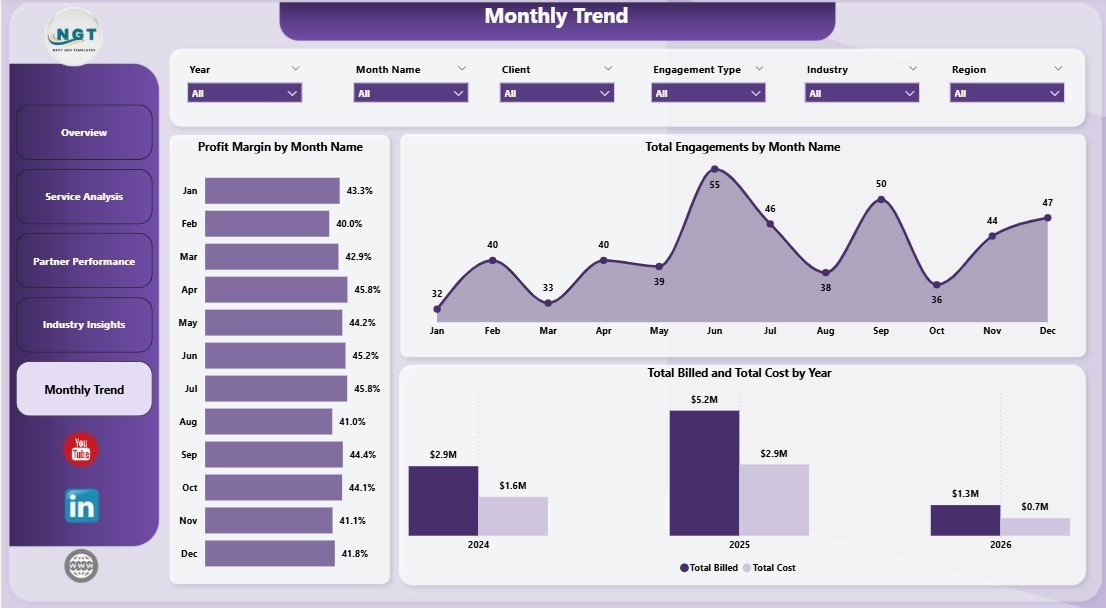
5. Monthly Trend — Three visuals designed for management reporting and board packs: Profit Margin by Month Name — monthly margin fluctuation revealing seasonality and one-off cost events; Total Engagements by Month Name — tracks volume trends that often precede revenue changes by 30–90 days; Total Billed and Total Cost by Year — year-on-year comparison of billings against total cost, the clearest indicator of practice-wide profitability trajectory.

Monthly Trend
📊 Accountancy Practice Dashboard in Power BI vs. Tableau / Qlik vs. Paid Practice Management SaaS — Where This Fits
| Feature | Accountancy Practice Dashboard in Power BI | Tableau / Qlik Build | Karbon / Xero Practice Manager |
|---|---|---|---|
| Cost | $17.99 one-time ✅ | $70+ / user / month + build cost | $59–$99 / user / month |
| Platform | Power BI Desktop (free) + optional Service ✅ | Tableau Desktop / Qlik Sense | Cloud SaaS only |
| Setup time | Under 15 minutes ✅ | 3–6 weeks build cycle | 2–6 weeks + onboarding |
| Mobile access | Free Power BI mobile app ✅ | Tableau Mobile / Qlik mobile | ✅ Full mobile app |
| Customisable KPIs | Unlimited — you own the .pbix ✅ | Unlimited | Limited to vendor’s model |
| Partner-level billing analysis | Built-in Service Analysis page ✅ | Custom build required | ✅ Available |
| Industry profitability analysis | Built-in Industry Insights page ✅ | Custom build required | Limited |
| Year-1 cost at 5 users | $17.99 total ✅ | $4,200+ in licenses | $3,540–$5,940 |
| Data ownership | 100% local .pbix, no cloud lock-in ✅ | Mixed | Vendor cloud only |
For accounting practices that need partner-level analytics without paying per-seat SaaS fees or building from scratch in Tableau, the Accountancy Practice Dashboard in Power BI sits in the sweet spot.
👥 Who This Template Is For — and Who It’s Not For
✅ This template is built for:
- CPA firms and chartered accounting practices with Power BI Desktop already installed wanting monthly partner performance reports
- Practice managers preparing quarterly board packs with billing vs cost and profit margin analysis
- Finance directors at mid-size firms (5–200 staff) replacing manual Excel-based reporting workflows with Power BI
- Power BI-literate analysts at accounting networks who want a deployment-ready .pbix instead of building from scratch
- Firms comparing the cost of Karbon or Xero Practice Manager against a one-time analytics tool
❌ This template is NOT for:
- Teams that haven’t installed Power BI Desktop and aren’t willing to download the free Microsoft client
- Practices needing integrated client workflow automation, automated invoicing, or built-in CRM (consider Karbon or CCH Axcess)
- Enterprise networks with 100+ partners needing row-level security and complex permission hierarchies
⚙️ How to Use the Accountancy Practice Dashboard in Power BI
- Download and install Power BI Desktop free from Microsoft if you don’t already have it.
- Open the .pbix file after purchase. Click “Transform data” to inspect the data source path in Power Query.
- Replace the sample data source by editing the source step to point to your own engagement Excel or CSV file with the same column structure (engagement ID, service type, partner, manager, region, industry, hours, cost, billed amount).
- Click Refresh on the Home ribbon. Every KPI card and visual on all 5 report pages updates against your real data.
- Use the slicers on the Overview page to filter by service type, partner, region, or date range — filters sync across pages.
- Publish to Power BI Service (optional) so partners and managers can view the report in a browser or via the free Power BI mobile app.
💼 Real-World Use Cases
James manages a 40-person regional CPA firm. Each month he pastes updated engagement records into the data source, clicks Refresh, and sends a PDF export of the Partner Performance page to managing partners. He uses the Avg Engagement Value by Partner visual to spot which partners are handling below-average mandates and reassigns accordingly — replacing a 3-hour manual reporting process with a 10-minute Power BI refresh. He chose the Power BI version over the Excel version specifically for the browser publishing capability.
Priya is a finance controller at a multi-industry accounting practice. She uses the Industry Insights page every quarter to compare Profit Margin and Avg Engagement Value across retail, manufacturing, and healthcare clients. The analysis directly informs the firm’s business development decisions — sectors with high margins and growing engagement volume get prioritised in the partner pipeline.
A boutique accountancy with 4 partners uses the Monthly Trend page at their AGM to present Total Billed and Total Cost by Year alongside Profit Margin by Month Name. The live Power BI report replaces a manually compiled PowerPoint updated on the morning of the meeting, saving roughly 4 hours of preparation time per partner review cycle.
❓ Frequently Asked Questions
What KPIs does the Accountancy Practice Dashboard in Power BI track?
The Accountancy Practice Dashboard in Power BI tracks 5 KPI cards on the Overview page — Total Hours, Total Engagements, Total Cost, Total Billed, and Net Profit — plus 15+ deeper analysis visuals across Service Analysis, Partner Performance, Industry Insights, and Monthly Trend pages covering billing, margin, hourly rates, and engagement volume.
How long does setup take for the Accountancy Practice Dashboard in Power BI?
Setup takes under 15 minutes. Install free Power BI Desktop, open the .pbix file, point Power Query at your own engagement Excel or CSV file with the same column structure, and click Refresh. Every KPI card and visual across all 5 report pages updates automatically — no DAX edits required.
How does this compare to Karbon or Xero Practice Manager?
Karbon and Xero Practice Manager are cloud SaaS tools costing $59–$99/user/month with built-in client workflow automation and CRM features. The Accountancy Practice Dashboard in Power BI is a one-time $17.99 analytics download focused on KPI visibility and reporting, with no subscription, no per-user fees, and full .pbix customisability. It covers the analytics layer; it doesn’t replace workflow automation.
Can I customise the service types, partners, and industries in the dashboard?
Yes. The Accountancy Practice Dashboard in Power BI is fully editable in Power BI Desktop. Update your source data with your firm’s actual service types, partner names, and industry categories — the visuals pick them up automatically on Refresh. You can also add new DAX measures, change the colour theme, or add visuals from AppSource.
Does it work on Power BI Service and the mobile app?
Yes. The Accountancy Practice Dashboard in Power BI publishes cleanly to Power BI Service from Power BI Desktop. Once published, partners and managers can view the report in a browser or on the free Power BI mobile app for iOS and Android — no additional licenses needed beyond standard Power BI access.
Is there an Excel version available?
Yes. The Accountancy Practice Dashboard in Excel covers the same 5 pages and KPI set using native pivot tables and slicers — ideal for firms not yet using Power BI Desktop.
What version of Power BI Desktop is required?
The Accountancy Practice Dashboard in Power BI works with any version of Power BI Desktop released in the last 3 years. Power BI Desktop is free to download from Microsoft and receives monthly updates. No Power BI Pro license is needed to use the dashboard locally in the desktop app.
👤 About the Author
Built by PK — Microsoft Certified Professional with 15+ years of Excel, Google Sheets, and Power BI experience. Founder of NextGenTemplates, reaching 300K+ subscribers across YouTube channels (@PK-AnExcelExpert, @NextGenTemplates, @NeoTechNavigators). Every template is hand-built and tested before release.
🔗 Explore Related Templates
📊 Accountancy Practice Dashboard in Excel — Same 5-page analytics dashboard built natively in Excel with pivot tables and slicers for teams on Microsoft Excel.
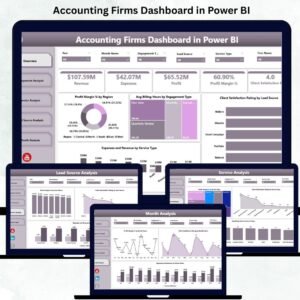
📊 Accounting Firms Dashboard in Power BI — Broader analytics dashboard for accounting firm operations and client profitability tracking in Power BI.
📊 Accounting Firms KPI Dashboard in Excel — Scorecard-style KPI view with trend indicators for chartered accountancy practices.
📁 Browse the complete library of Power BI Dashboard Templates →
📖 Click here to read the Detailed Blog Post
🎥 Visit our YouTube channel for step-by-step video tutorials
👉 YouTube.com/@NextGenTemplates
📅 Last updated: May 2026


Reviews
There are no reviews yet.