

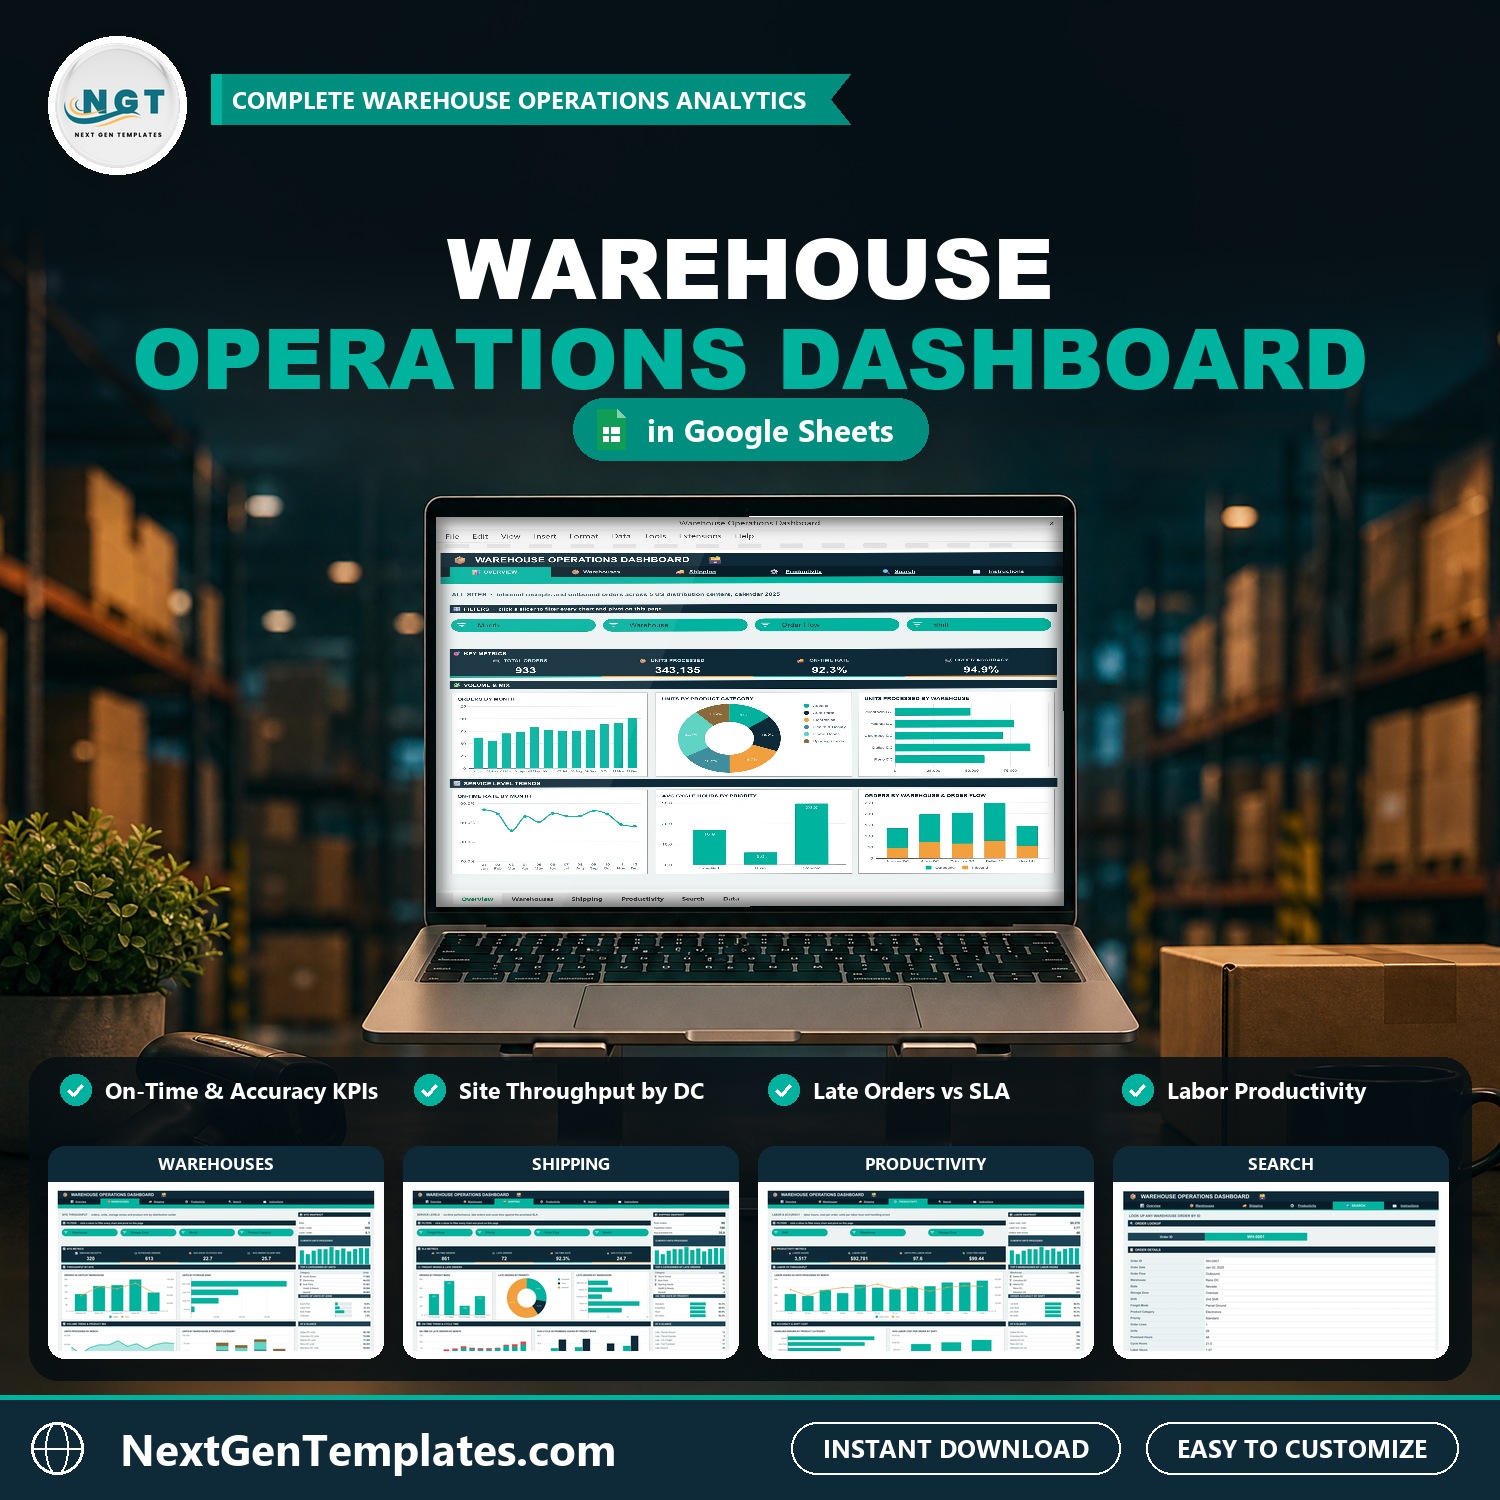
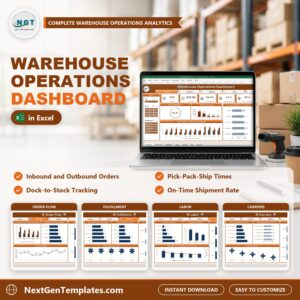
Every day the same questions come up in a warehouse: how many orders went out, did they ship on time, and what did the labor cost? The Warehouse Operations Dashboard in Google Sheets answers them on one screen. It takes a year of inbound receipts and outbound orders and shows volume, service level, shipping performance and labor productivity for every warehouse, shift and freight mode.
🌍 Join 10,000+ customers in 180+ countries using NextGenTemplates to replace paid SaaS tools with one-time-purchase Excel, Google Sheets, Power BI and HTML templates.
✅ Instant download · One-time payment · No subscription · No per-user fees · Lifetime access
Watch the Warehouse Operations Dashboard in Google Sheets walkthrough
Good to know: this is a reporting dashboard, not a warehouse management system. You paste your own WMS or spreadsheet export into the Data tab. All sample warehouses, orders and figures are fictional.
🔑 Key Features of the Warehouse Operations Dashboard
📌 A warehouse operations dashboard for Google Sheets. Orders, units processed, on-time rate and order accuracy for every distribution center, month and shift.
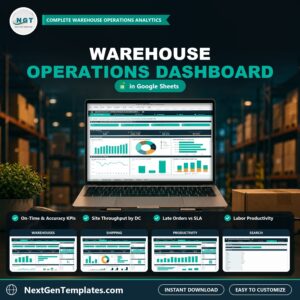
📌 Four analysis pages. Overview, Warehouses, Shipping and Productivity, each with its own KPI cards, charts and Top 5 panels.
📌 Native slicers. Month, Warehouse, Order Flow, Shift, Storage Zone, Product Category, Freight Mode and Priority filter the charts and pivots with one click.
📌 A warehouse KPI dashboard. Dock-to-stock hours, order-to-ship hours, on-time rate, order accuracy and units per labor hour in one place.
📌 A warehouse performance dashboard. See late orders by priority, warehouse and freight mode, and compare average cycle hours with the promised hours.
📌 A warehouse productivity dashboard. Labor hours against units processed by month, labor cost per order by shift and handling errors by product category.
📌 Record-level Search page. Pick any Order ID and the full order record appears.
📌 No add-ons. Built with formulas, pivot tables and native slicers. No add-on, no script, no macro.
📌 Room for 1,000 rows. Paste your own receipts and orders over the sample rows and every page updates on its own.
📦 What is Inside the Warehouse Operations Dashboard
Four dashboard pages (Overview, Warehouses, Shipping, Productivity), a Search page, an Instructions page and a Data tab. Your download is a PDF guide with the link to open the dashboard and make your own editable copy.
Overview Page
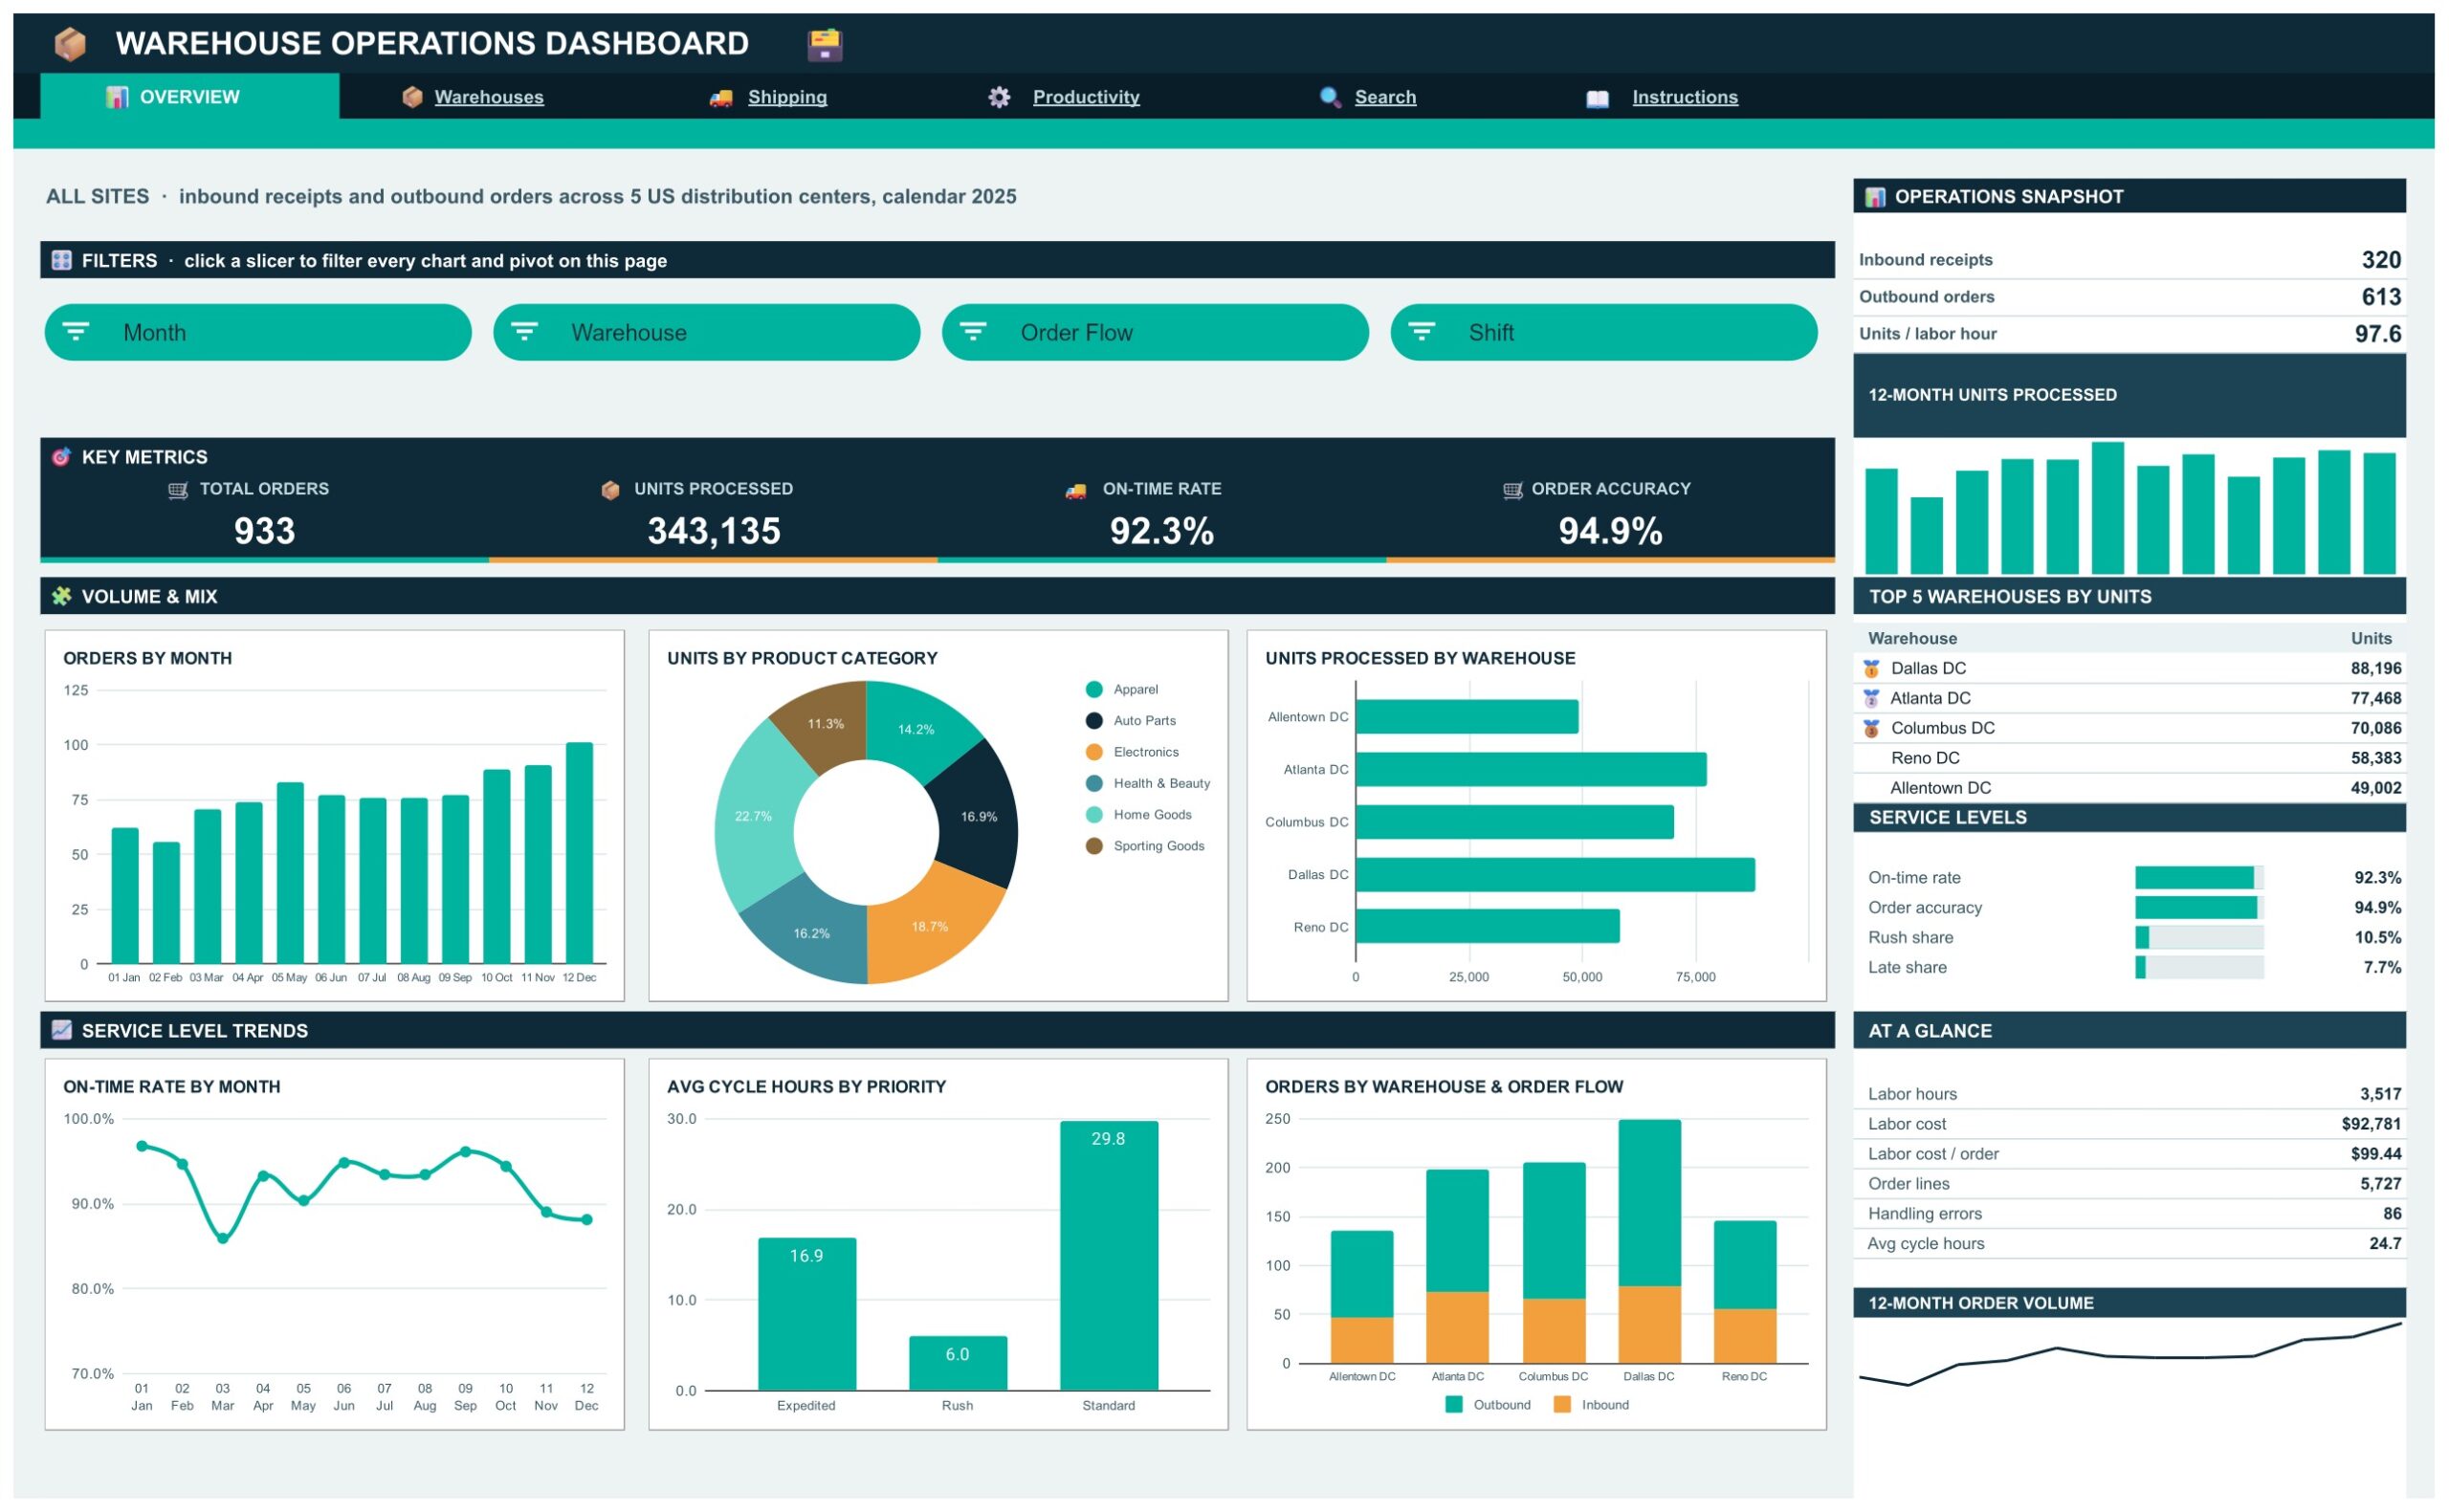
The Overview page shows how the operation is running. Total Orders, Units Processed, On-Time Rate and Order Accuracy sit in four KPI cards. Charts show Orders by Month, Units by Product Category, Units Processed by Warehouse, On-Time Rate by Month, Average Cycle Hours by Priority and Orders by Warehouse and Order Flow. An operations snapshot, a twelve month units trend and a Top 5 Warehouses by Units panel finish the page. Month, Warehouse, Order Flow and Shift slicers filter the charts together.
Warehouses Page
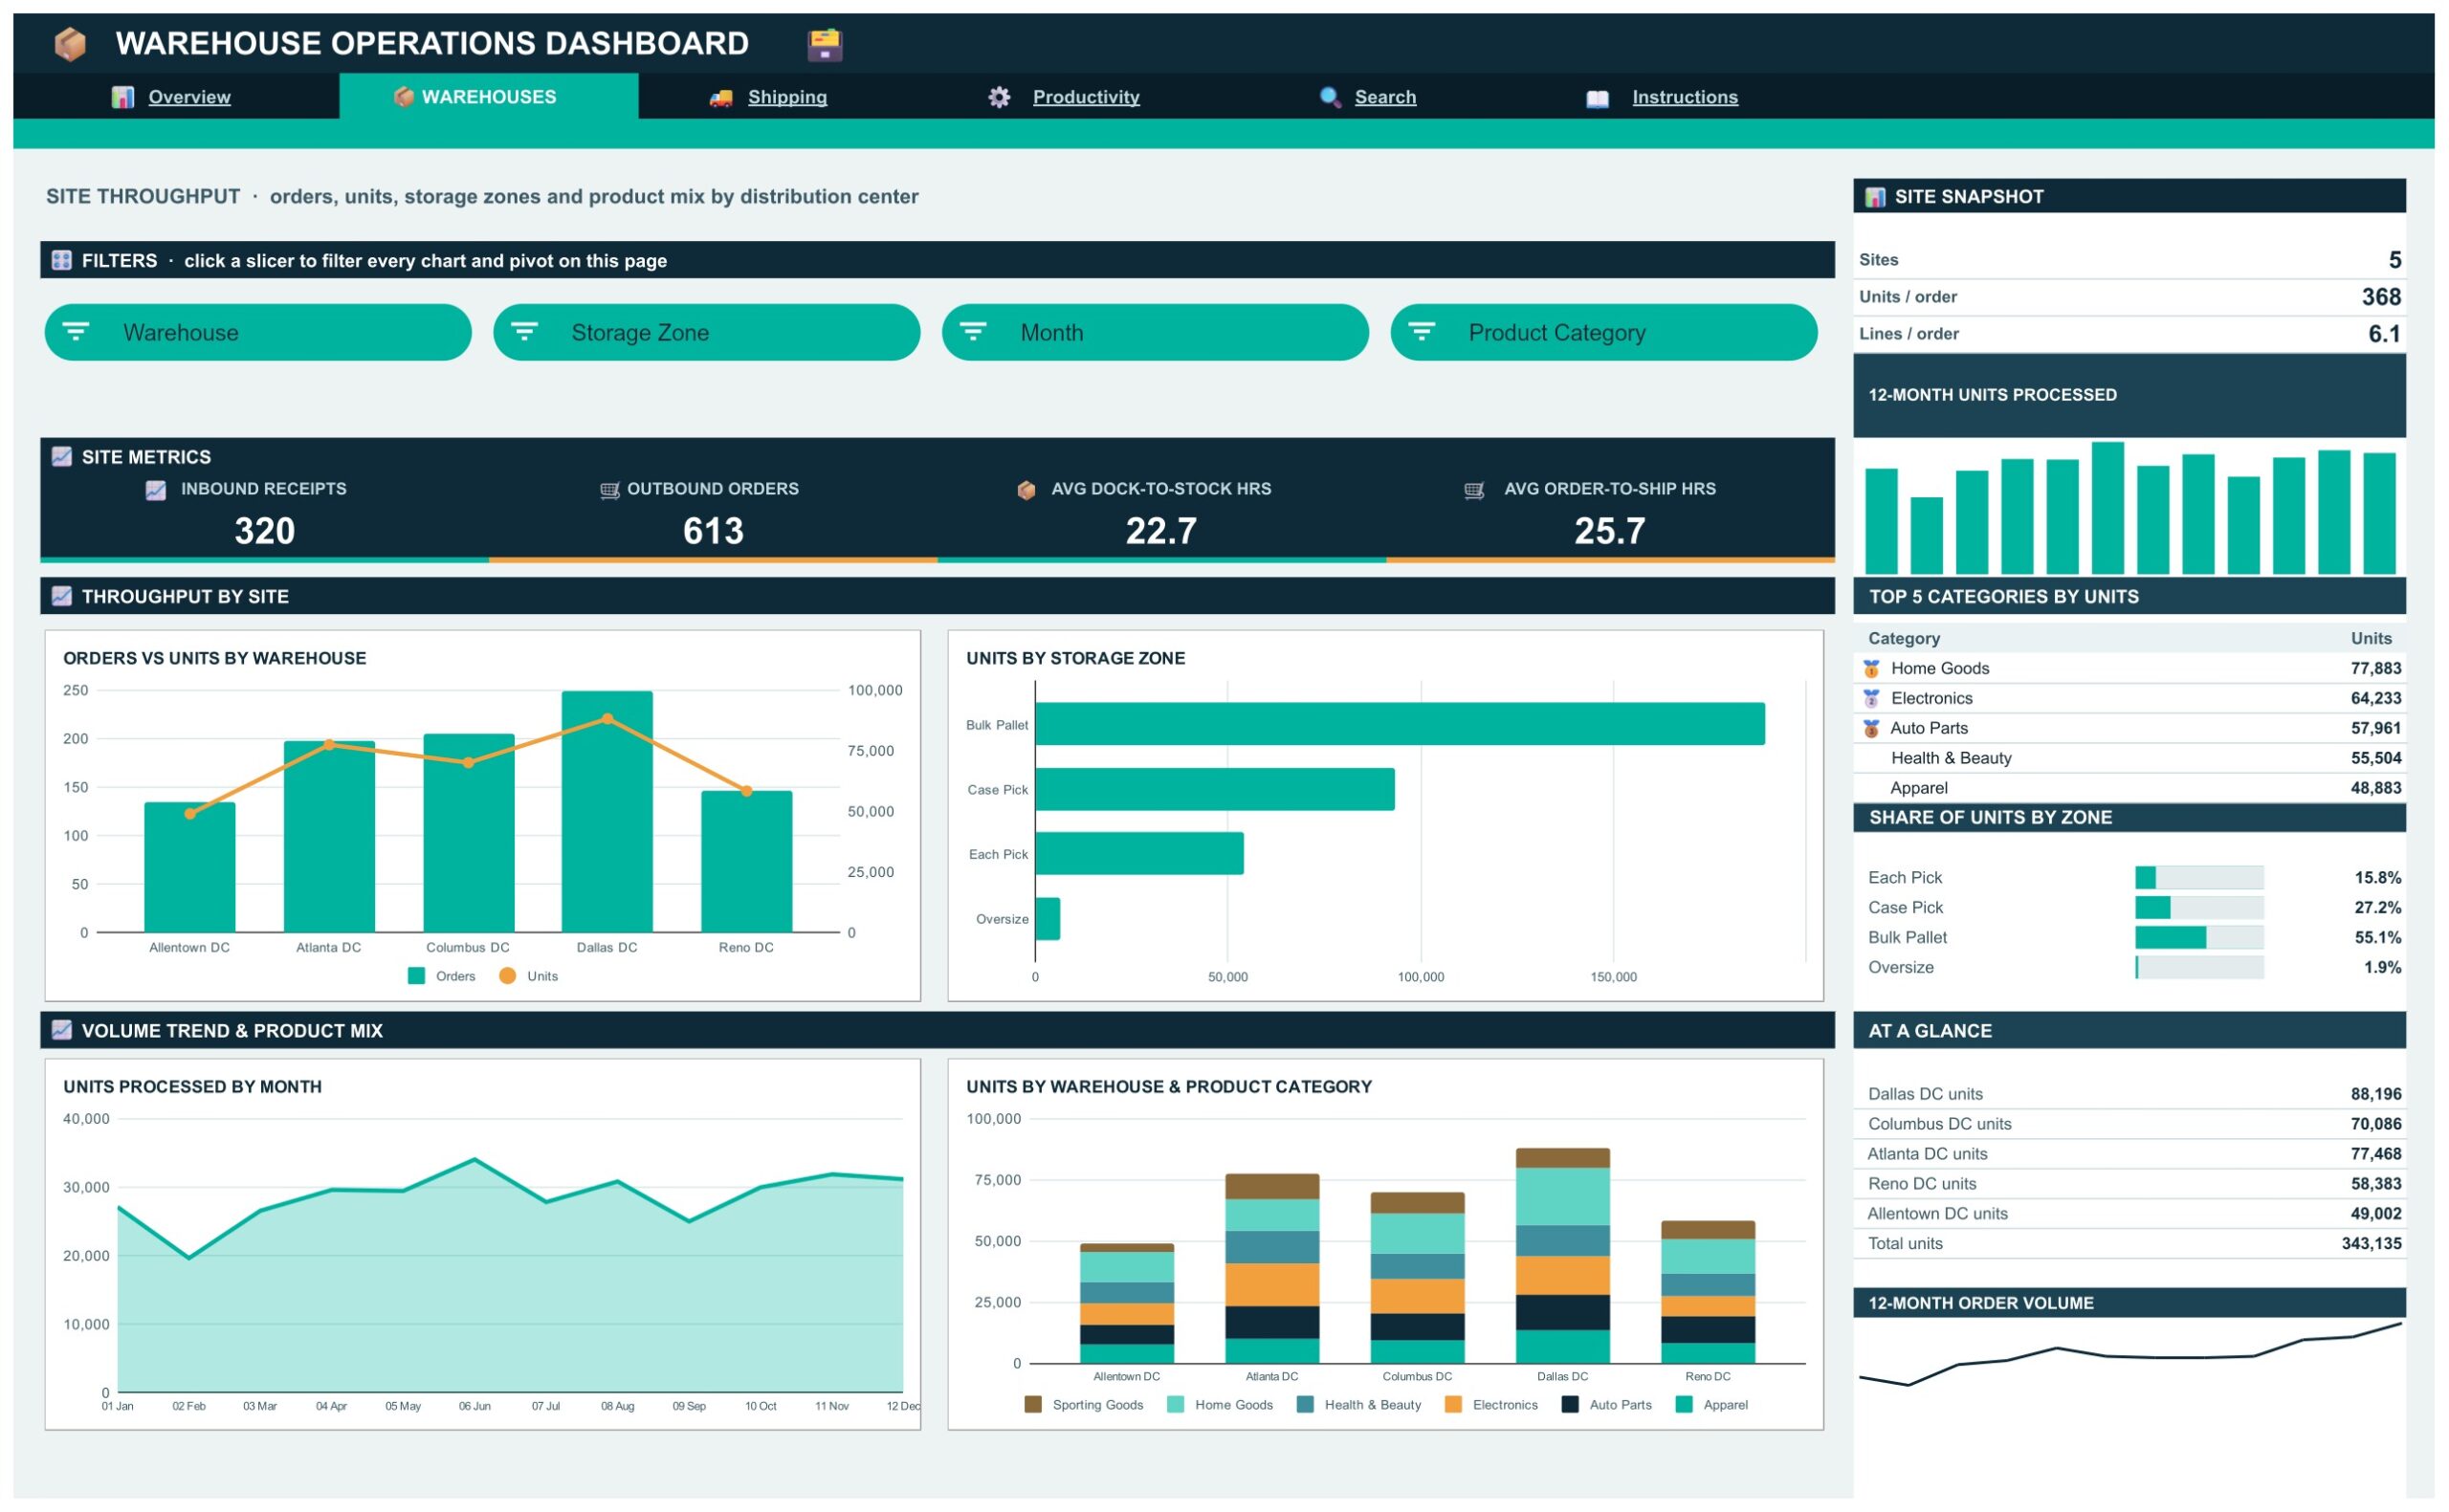
Compares your sites. Orders vs Units by Warehouse, Units by Storage Zone, Units Processed by Month and Units by Warehouse and Product Category sit beside cards for inbound receipts, outbound orders, average dock-to-stock hours and average order-to-ship hours. Warehouse, Storage Zone, Month and Product Category slicers filter the page.
Shipping Page
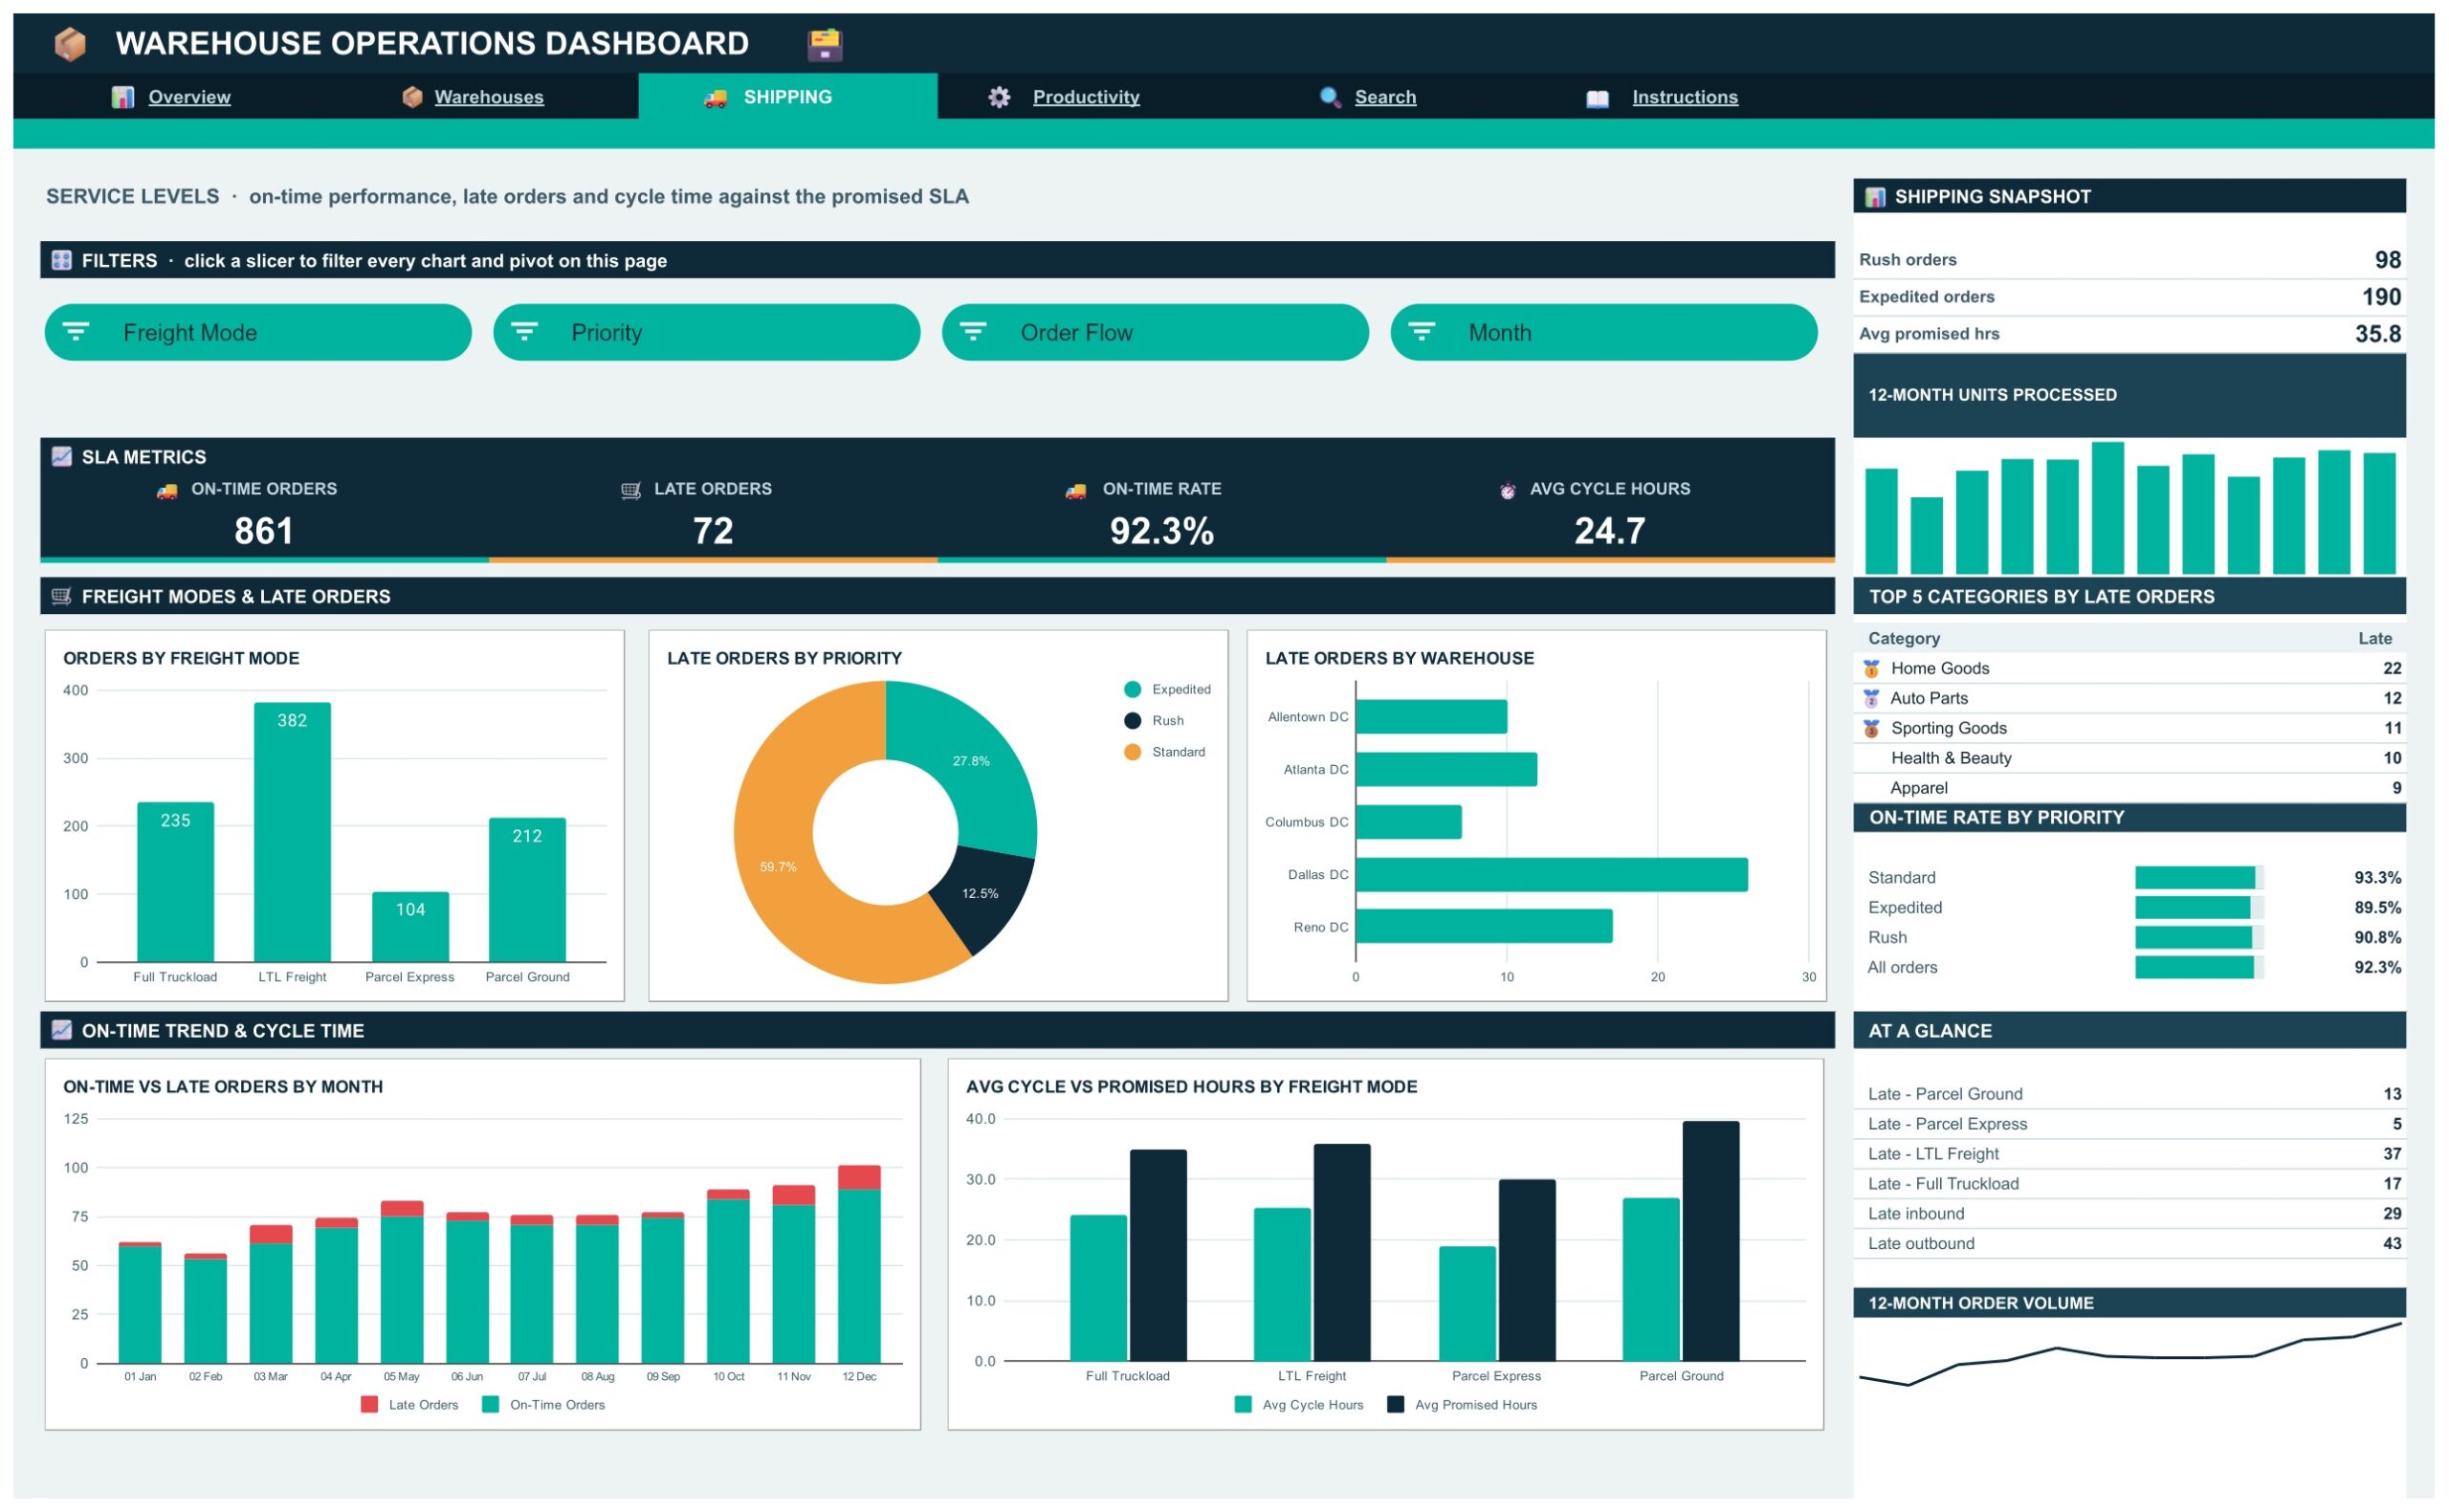
All about service levels. Orders by Freight Mode, Late Orders by Priority, Late Orders by Warehouse, On-Time vs Late Orders by Month and Average Cycle vs Promised Hours by Freight Mode show where orders ship late. Freight Mode, Priority, Order Flow and Month slicers filter the page.
Productivity Page
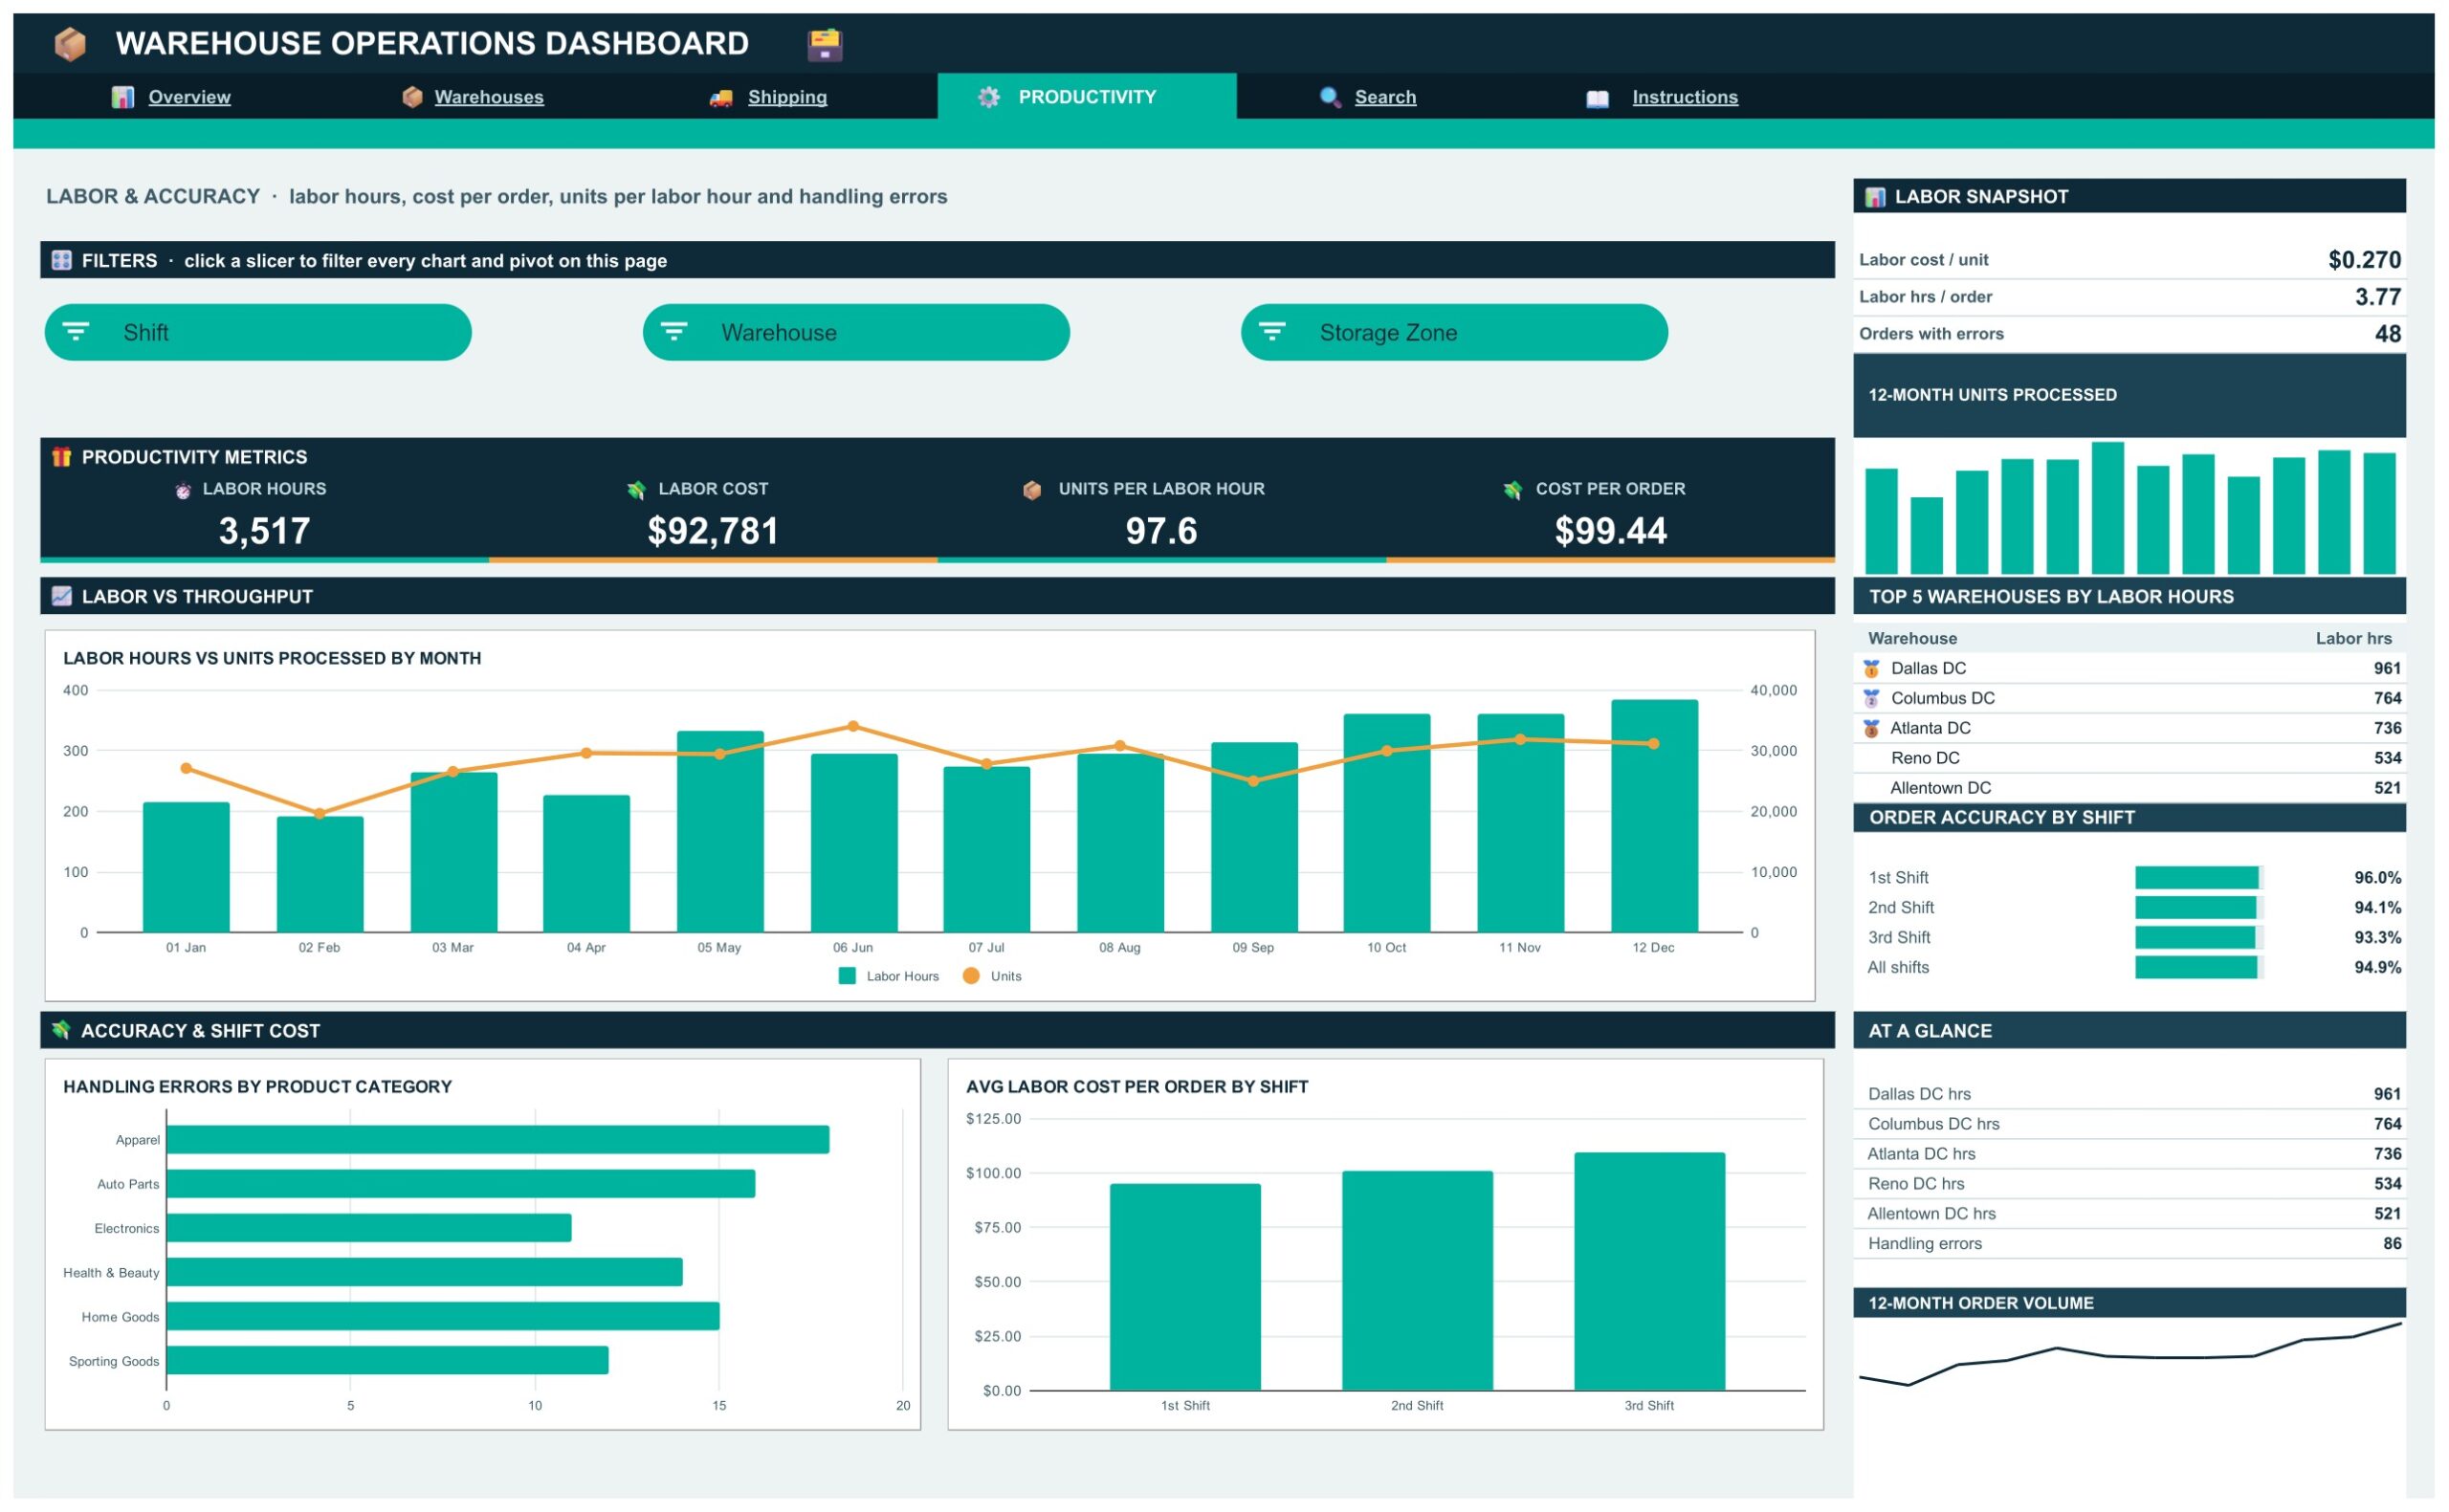
Shows what the work costs. Labor Hours vs Units Processed by Month, Handling Errors by Product Category and Average Labor Cost per Order by Shift sit beside cards for labor hours, labor cost, units per labor hour and labor cost per order. Shift, Warehouse and Storage Zone slicers filter the page.
Search Page
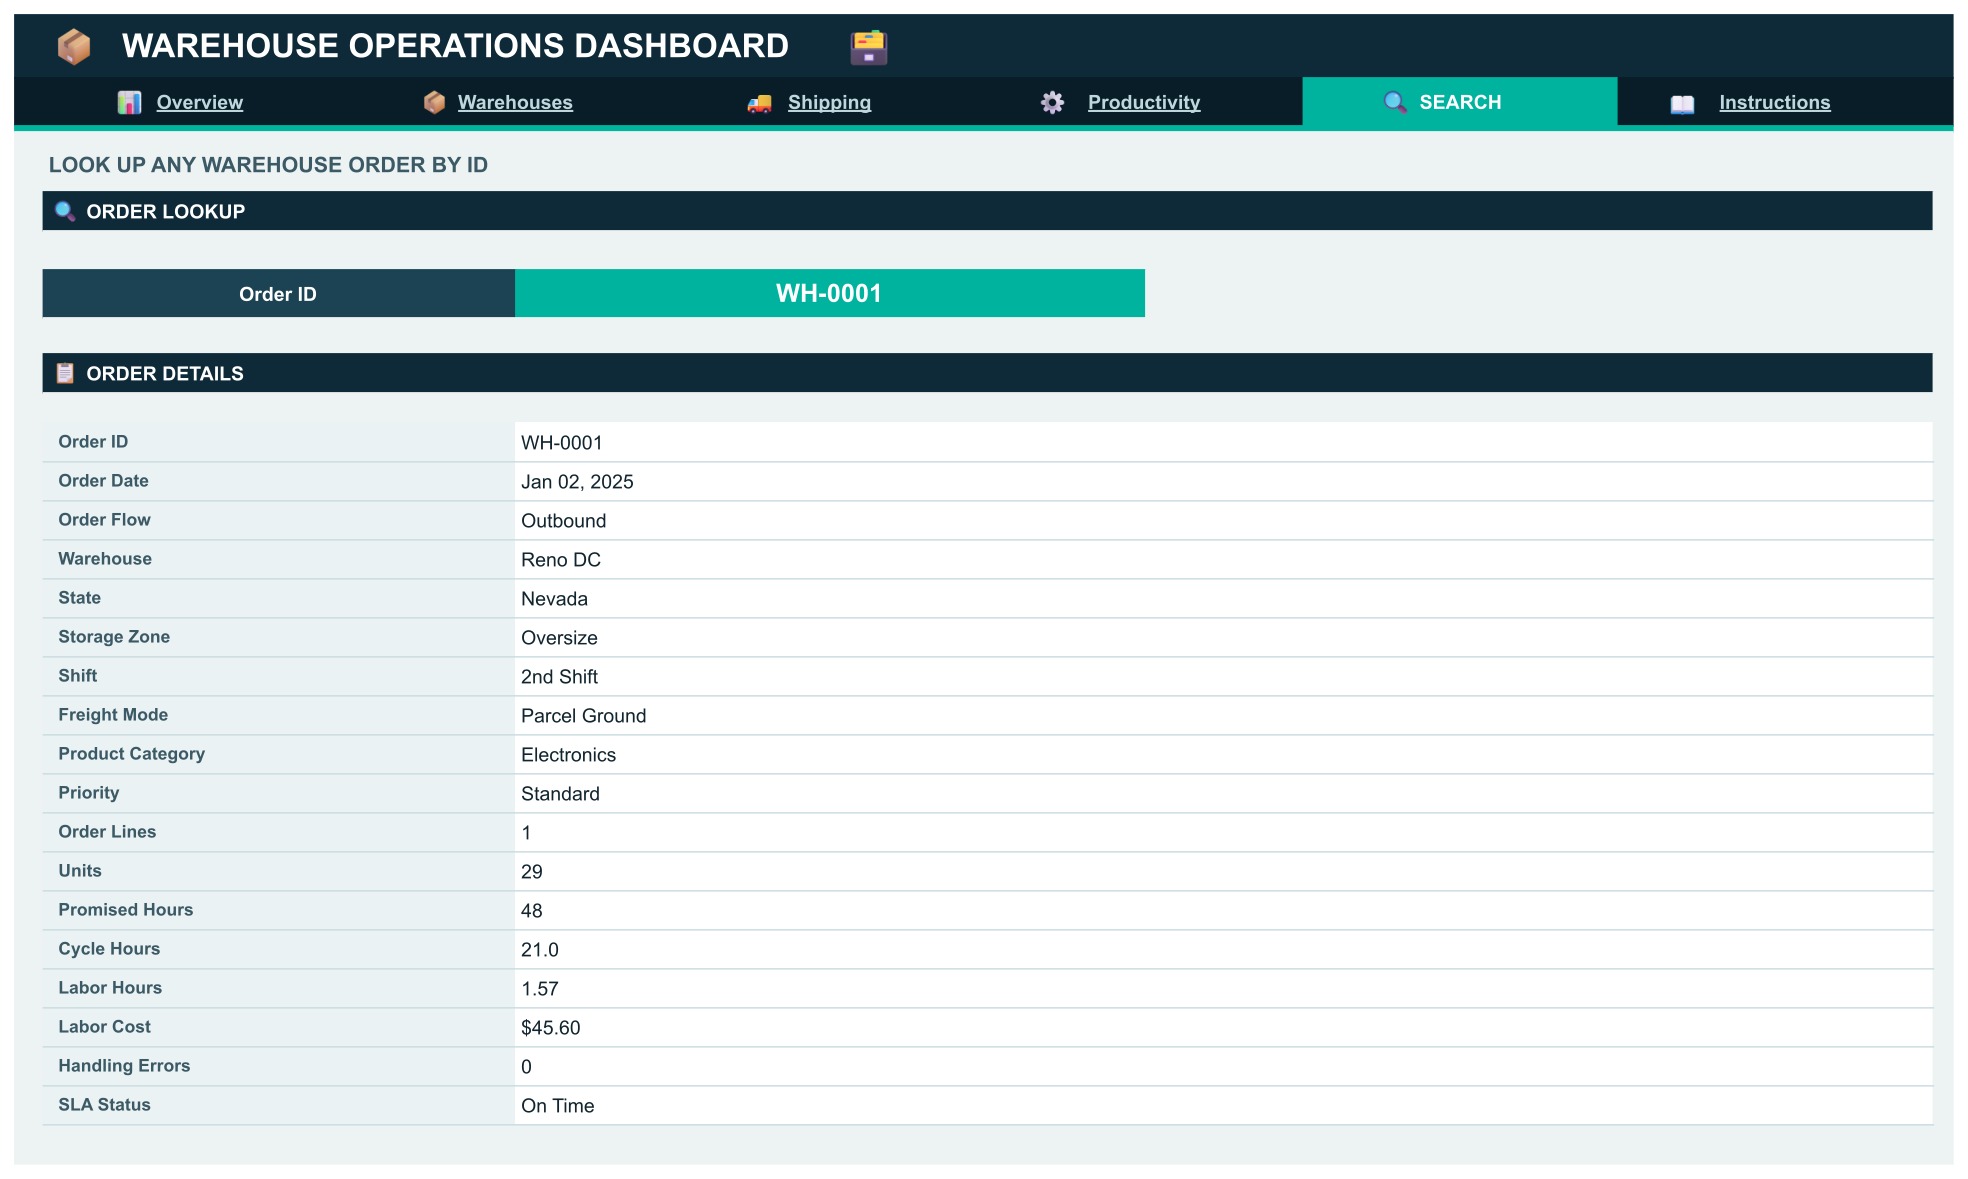
Pick any Order ID in the teal input box and the full record appears: order date, order flow, warehouse, state, storage zone, shift, freight mode, product category, priority, order lines, units, promised hours, cycle hours, labor hours, labor cost, handling errors and SLA status.
Instructions Page
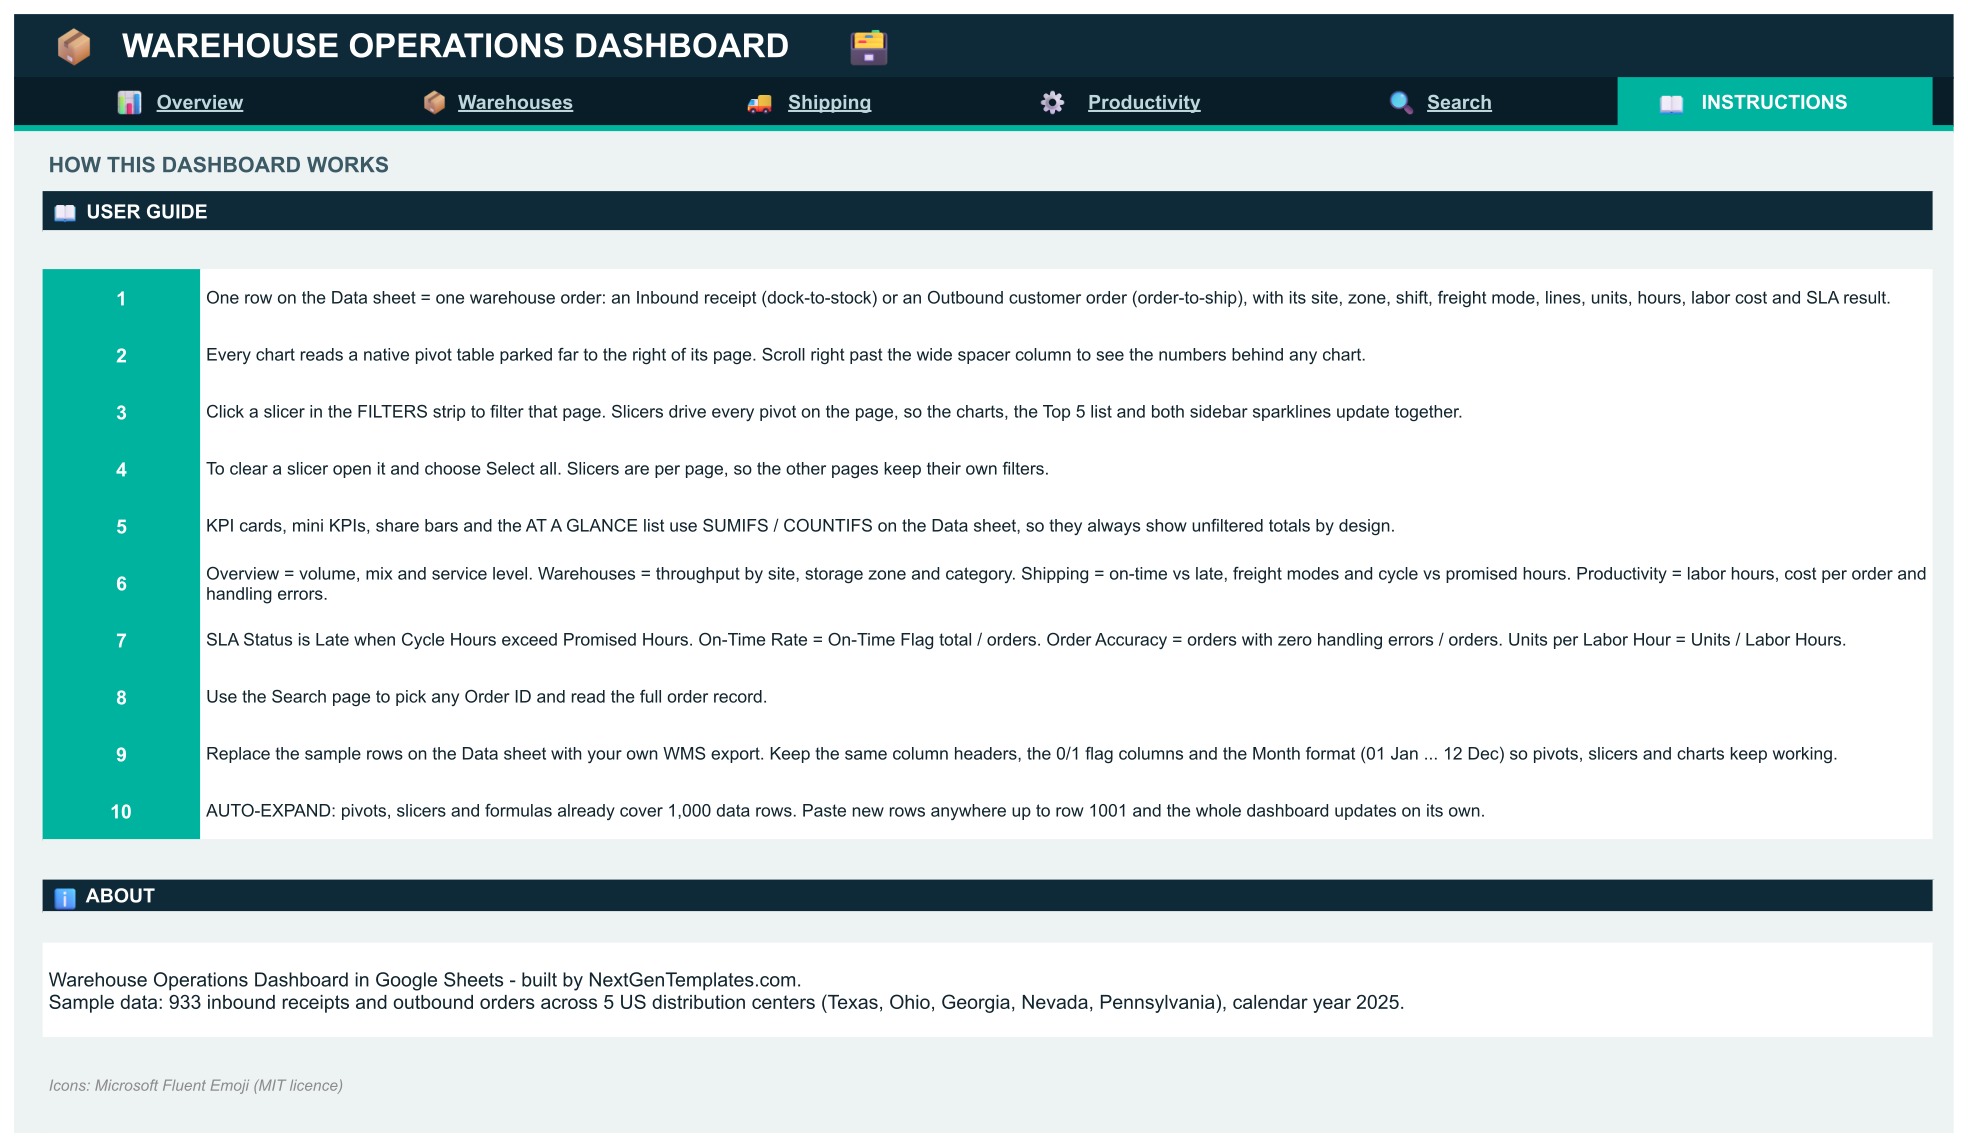
Explains that each Data row is one inbound receipt or outbound order, how the pivot tables and slicers work, why the KPI cards show unfiltered totals, how SLA status, on-time rate, order accuracy and units per labor hour are calculated, and how to replace the sample rows with your own export of up to 1,000 rows.
📊 Warehouse Operations Dashboard vs. a Plain Spreadsheet vs. WMS Software: Where This Fits
| Feature | This Google Sheets dashboard | Plain spreadsheet | WMS and BI software |
|---|---|---|---|
| Cost | $9.99 one-time ✅ | Free, but you build it | Monthly subscription, often per user |
| Orders, on-time rate and accuracy by warehouse | Charts and cards ✅ | Manual formulas | Yes ✅ |
| Late orders by priority and freight mode | Yes ✅ | Build it yourself | Varies |
| Slicers for month, warehouse and shift | Yes ✅ | No | Varies |
| Live inventory, picking and slotting | No | No | Often included |
| Add-ons or scripts required | No | No | Not applicable |
If you already export orders from a WMS or keep them in a sheet and want an operations dashboard without another subscription, this fits. If you need live inventory control, picking or slotting, you need other software as well.
👥 Who This Template Is For, and Who It Is Not For
✅ This template is built for:
- Warehouse and distribution center managers who report service level and volume
- Logistics and operations analysts who need on-time shipment and cycle time reports
- Supervisors who track labor hours and labor cost per order by shift
- Small ecommerce and wholesale businesses that run their own fulfillment
❌ This template is NOT for:
- Teams that need live inventory, picking or slotting, because it only reports on the rows you paste in
- Anyone looking for a warehouse management system or barcode scanning
- Teams that need a live feed from a WMS, because data is pasted into the Data tab
⚙️ How to Use the Warehouse Operations Dashboard
- Open the PDF guide in your download and click the link to open the dashboard.
- Choose File, then Make a copy and save it to your own Google Drive.
- Go to the Data tab and paste your own receipts and orders over the sample rows. Keep the column headings as they are.
- Use the slicers on each page to filter the charts and pivots.
- Move through Overview, Warehouses, Shipping and Productivity from the navigation bar.
💼 Real-World Use Cases
The daily huddle. A warehouse manager opens Overview, picks the month and sees orders, units and on-time rate before the shift meeting.
The late order review. A logistics analyst opens Shipping and sees which priority levels, warehouses and freight modes drive the late orders.
The labor question. A supervisor opens Productivity and compares labor cost per order across shifts.
❓ Frequently Asked Questions
What does the Warehouse Operations Dashboard in Google Sheets show?
It shows orders, units processed, on-time rate and order accuracy, dock-to-stock and order-to-ship hours, late orders by priority, warehouse and freight mode, and labor hours, labor cost and units per labor hour.
How do I get my own copy?
Open the PDF guide in your download, click the link and choose File, then Make a copy. The copy lands in your Google Drive and is fully editable.
Do I need add-ons, scripts or macros?
No. It is built with formulas, pivot tables and native slicers. There is no add-on, no Apps Script and no macro to authorise.
How many rows can it hold?
The Data tab has room for 1,000 rows. Each row is one inbound receipt or outbound order.
How is the on-time rate calculated?
Each order is marked on time or late by comparing its cycle hours with its promised hours. On-time rate is on-time orders divided by total orders. The Instructions page explains order accuracy and units per labor hour as well.
Is the sample data real?
No. The warehouses, orders and every figure are fictional sample data. Replace them with your own rows.
Is this warehouse management software?
No. It is a reporting dashboard. It does not track live inventory, picking or slotting. You paste an export into the Data tab and the pages report on it.
👤 About the Author
Built by PK, Microsoft Certified Professional with 15+ years of Excel, Google Sheets and Power BI experience. Founder of NextGenTemplates. Every template is hand-built and tested before release.
🔗 Explore Related Templates
- Warehouse Operations Dashboard in Excel: the Excel edition of this dashboard.
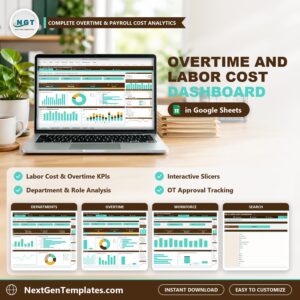
- Overtime and Labor Cost Dashboard in Google Sheets: go deeper on labor cost.
- Inventory and Reorder Point Tracker in Excel and Google Sheets: track stock levels and reorder points.
- Warehouse Inventory Management System Web App: live inventory control.
Browse all Google Sheets dashboards.
🎥 Visit our YouTube channel for step-by-step video tutorials
👉 YouTube.com/@NextGenTemplates
📅 Last updated: November 2026
Compatibility and Requirements
- Works in Google Sheets. You need a free Google account and a web browser.
- Every chart reads a native Google Sheets pivot table. Google explains how to build charts in Add and edit a chart or graph.




















Reviews
There are no reviews yet.