

Academic excellence starts with consistent monitoring. The Student Academic Performance Dashboard in Google Sheets is a ready-to-use, interactive reporting tool that helps educators and administrators track attendance, grades, and GPA with ease. 🎓📊
Built for schools, colleges, and universities, this dashboard brings together every aspect of student performance — attendance, test results, course outcomes, and departmental trends — into one dynamic, visual platform. It’s the perfect blend of simplicity, analytics, and collaboration, designed to make academic evaluation transparent and data-driven.
🔑 Key Features of the Student Academic Performance Dashboard in Google Sheets
📋 Dashboard Sheet Tab (Main Performance View)
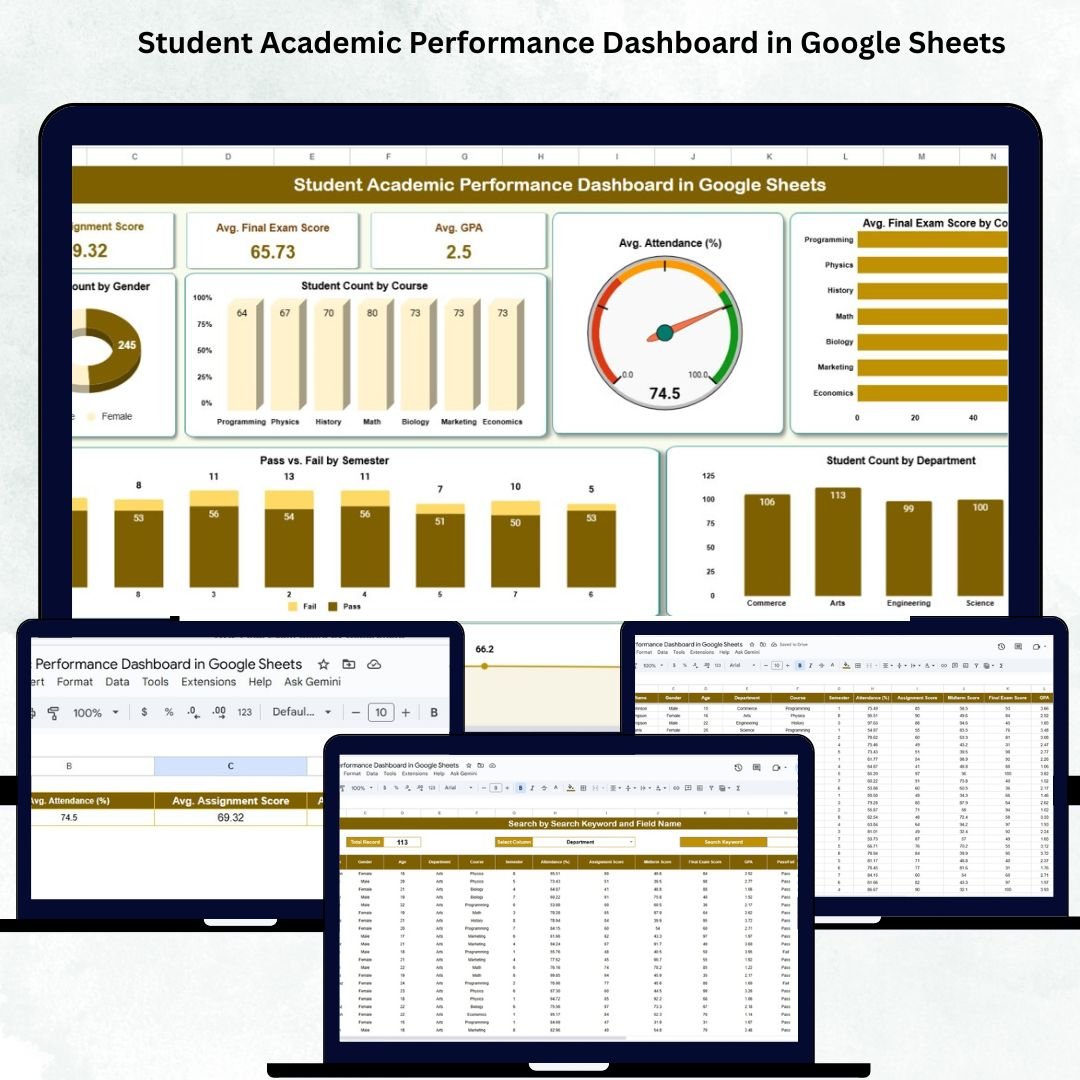
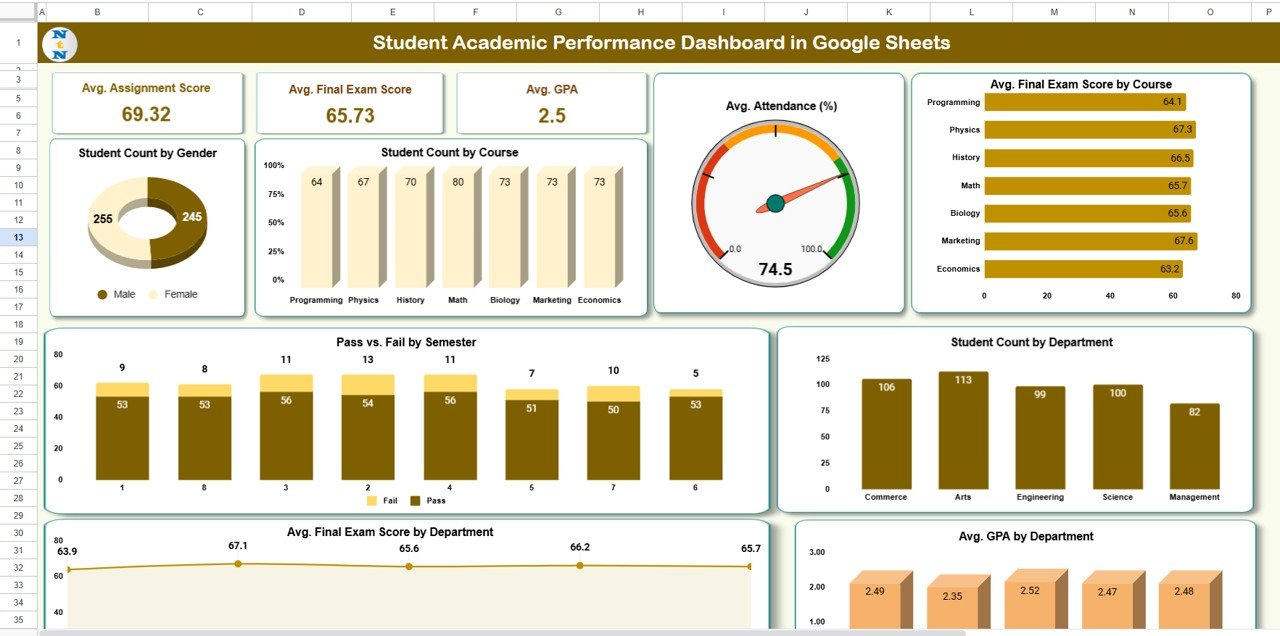
The central hub for all academic metrics, this sheet provides high-level insights with summary cards and visual charts:
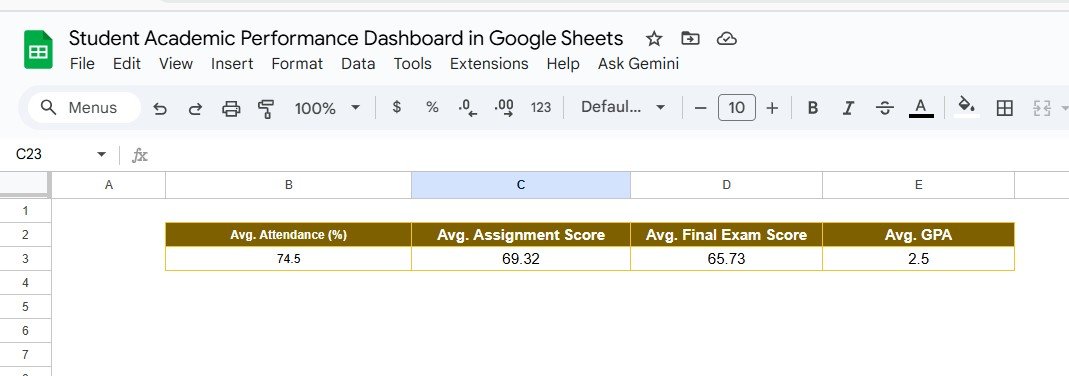
Cards Displayed:
Avg. Attendance (%): Overall attendance percentage across all students.
Avg. Assignment Score: Average marks achieved in assignments.
Avg. Final Exam Score: Total average of final exam performance.
Avg. GPA: Institution-wide average GPA score.
Charts Included:
👨🎓 Student Count by Gender – Understand gender distribution across students.
📚 Student Count by Course – Track enrollment strength by course.
📅 Avg. Attendance (%) – Evaluate attendance consistency across semesters.
🧮 Avg. Final Exam Score by Course – Compare results by subject or specialization.
🏢 Student Count by Department – Identify departmental student strength.
✅ Pass vs. Fail by Semester – Review student success rates over time.
📊 Avg. Final Exam Score by Department – Assess departmental academic performance.
🧠 Avg. GPA by Department – Benchmark academic outcomes institution-wide.
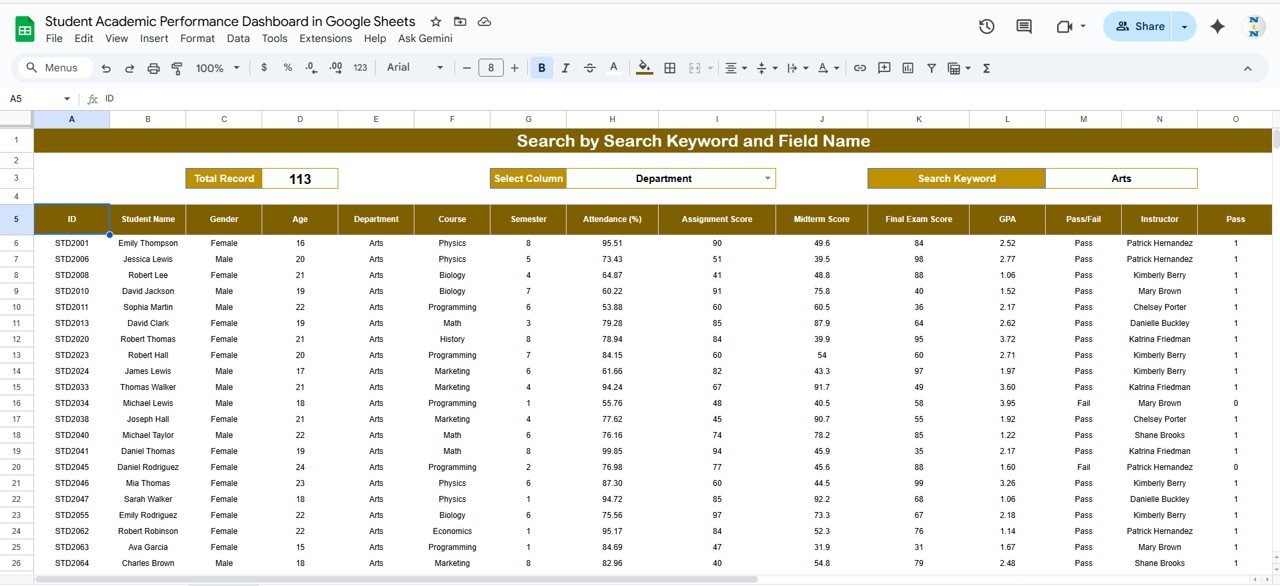
🔍 Search Sheet Tab (Dynamic Filtering)
Quickly search for specific student details using smart filters.
You can search by:
Student Name
Student ID
Department
Course
Semester
Pass/Fail Status
Example: Type “Computer Science” and instantly view all students under that department with real-time updates.
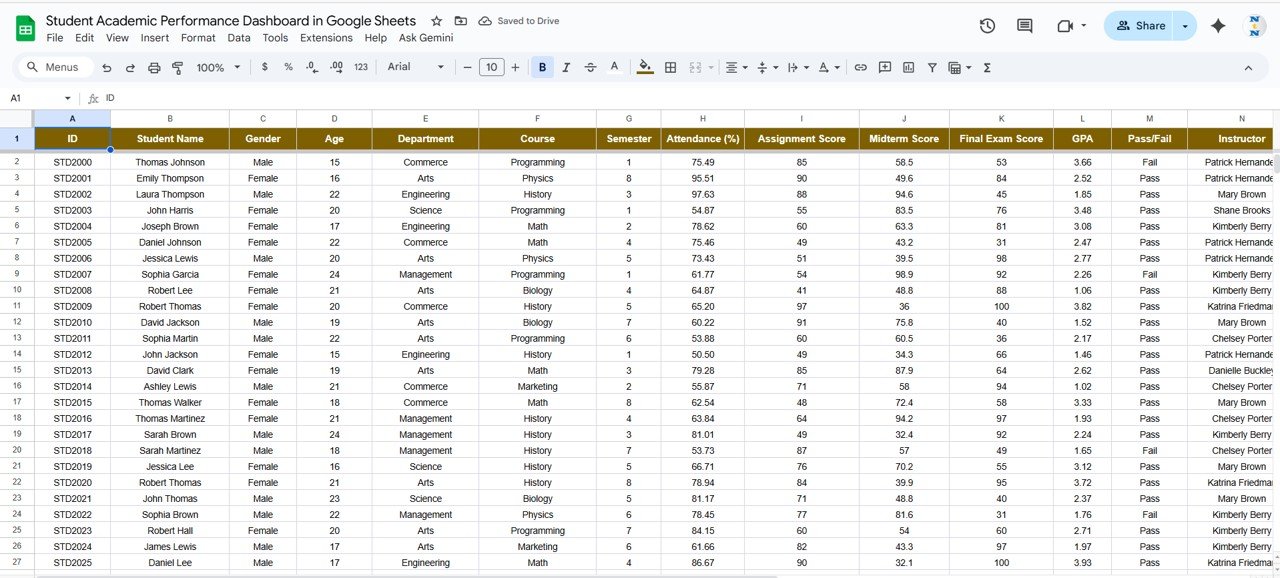
🧾 Data Sheet Tab (Master Input Data)
All academic information is stored here — the foundation of the dashboard.
Typical columns include:
Student ID / Name
Gender / Age
Department / Course / Semester
Attendance (%)
Assignment Score
Midterm and Final Exam Score
GPA
Pass/Fail Status
This sheet auto-updates all KPIs and charts, keeping the dashboard live and accurate.
⚙️ Support Sheet Tab (Dropdown & Validation Lists)
The support tab ensures data accuracy and consistency. It includes dropdown lists for departments, semesters, and grades — minimizing human error during data entry.
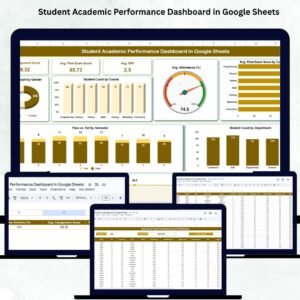
📦 What’s Inside the Dashboard
✅ Fully automated Google Sheets file with charts & summaries
✅ Predefined KPIs and formulas for instant calculations
✅ Interactive dashboard for student performance visualization
✅ Search-enabled sheet for fast lookups
✅ Data validation and dropdown setup for uniform entries
✅ Editable and customizable structure
✅ Cloud-based, shareable, and collaboration-friendly
Everything you need to manage academic reporting — visually, efficiently, and in real time. 🚀
🧑🏫 Who Can Benefit from This Dashboard
🎯 Teachers & Professors – Monitor classroom performance and attendance.
🎓 School & College Administrators – Evaluate academic trends institution-wide.
📈 Academic Coordinators – Identify departments needing support.
🏫 Principals & Deans – Get quick overviews for academic audits.
📚 Tutors & Mentors – Support underperforming students with data insights.
This dashboard transforms traditional grade tracking into a smart, automated monitoring system — enabling faster decisions and better results.
🧪 How to Use the Student Academic Performance Dashboard
1️⃣ Enter Student Data – Add student details in the Data Sheet tab.
2️⃣ Analyze Performance – View live dashboards for attendance, GPA, and course-wise scores.
3️⃣ Search Records – Filter specific students or departments in the Search tab.
4️⃣ Monitor Trends – Track academic progress by semester or department.
5️⃣ Collaborate Online – Share dashboards securely with faculty and management.
💡 Pro Tip: Use conditional formatting to highlight low-performing students automatically!
🌟 Why Choose This Dashboard
Instant academic insights through automated KPIs
Department and course-level tracking
Real-time updates across teams via Google Sheets
Fully customizable for any educational level
Ideal for academic audits, progress reviews, and student engagement tracking
The Student Academic Performance Dashboard in Google Sheets brings analytics-driven decision-making to the classroom — helping institutions improve performance, transparency, and accountability. 🌟
🔗 Click here to read the Detailed blog post
Watch the step-by-step video Demo:





























Reviews
There are no reviews yet.