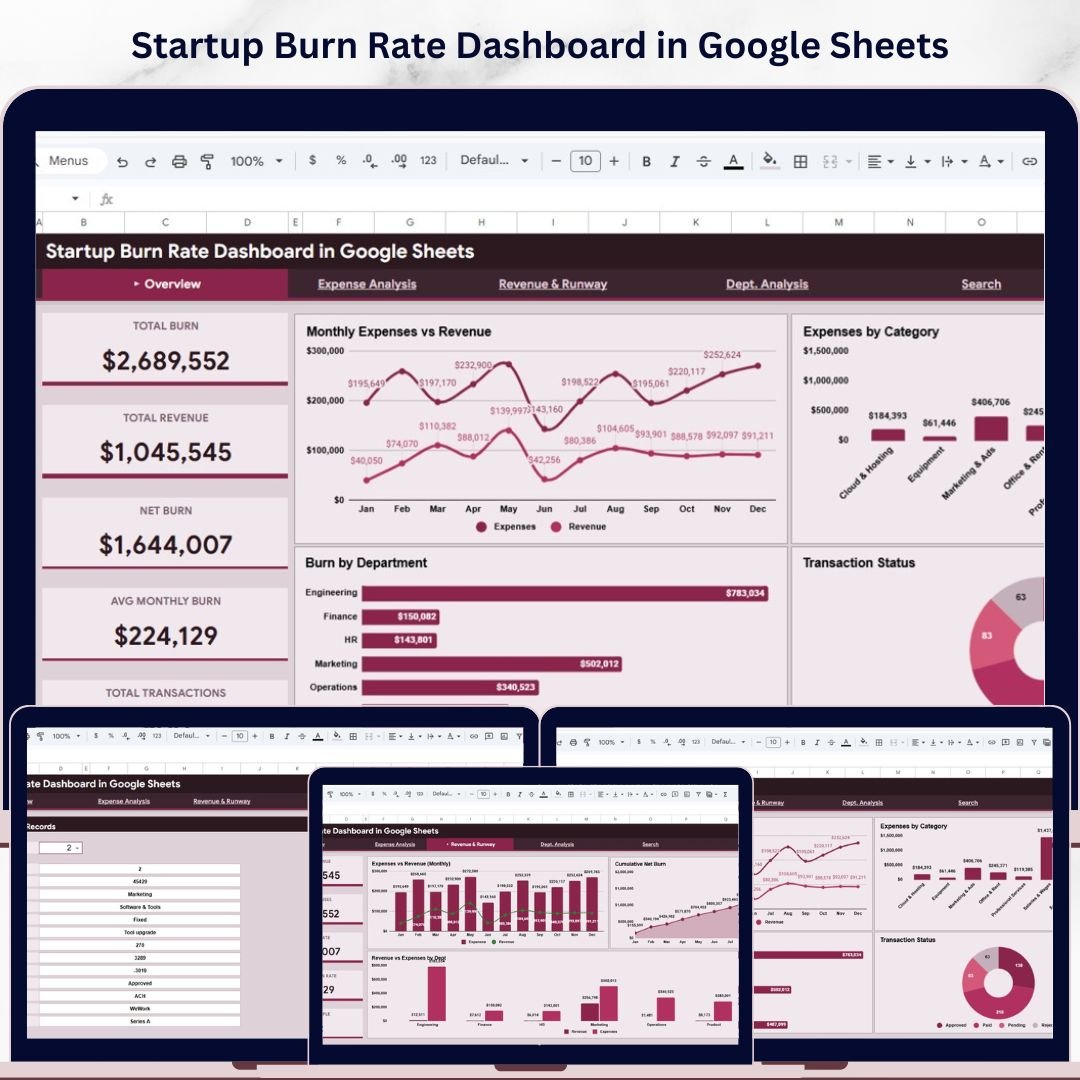
Startup Burn Rate Dashboard in Google Sheets is a professionally designed, ready-to-use interactive dashboard built for startup founders, CFOs, financial analysts, and early-stage investors who need to track, analyze, and visualize their company’s cash burn, expenses, revenue, and financial runway — all inside Google Sheets. Whether you are managing seed-stage budgets, monitoring department-level spending, or presenting financial health to your board, this Google Sheets Dashboard Template consolidates your startup’s financial data into one clean, interactive, and insight-driven experience.Startup Burn Rate Dashboard in Google Sheets
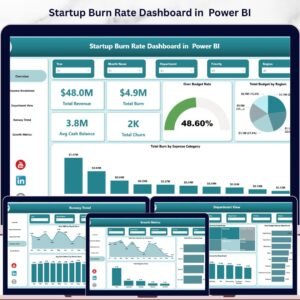
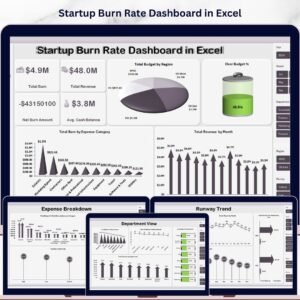
Running a startup means every dollar counts. Tracking how fast you are spending cash versus how much revenue you are generating is the difference between scaling successfully and running out of runway. The Startup Burn Rate Dashboard in Google Sheets solves this challenge by providing 5 interactive dashboard pages with dynamic charts, KPI cards, slicers, and filters — all powered by Google Sheets formulas. This dashboard tracks 5 key financial KPIs including Total Burn, Total Revenue, Net Burn, Avg Monthly Burn, and Total Transactions across multiple departments, categories, and payment methods. If you prefer working in Excel, check out the Startup Burn Rate Dashboard in Excel. For a Power BI version, explore the Startup Burn Rate Dashboard in Power BI.

🔑 Key Features of Startup Burn Rate Dashboard in Google Sheets
📌 5 Interactive Dashboard Pages — Overview, Expense Analysis, Revenue and Runway, Search Transaction Records, and Data Sheet deliver focused insights using dynamic visuals, KPI cards, and slicer controls that let you filter data instantly by department, category, status, payment method, and time period.
📌 Real-Time KPI Cards — Monitor Total Burn, Total Revenue, Net Burn, Avg Monthly Burn, and Total Transactions at a glance from the Overview page. These 5 high-level KPI cards provide instant visibility into your startup’s financial health and spending velocity.Startup Burn Rate Dashboard in Google Sheets
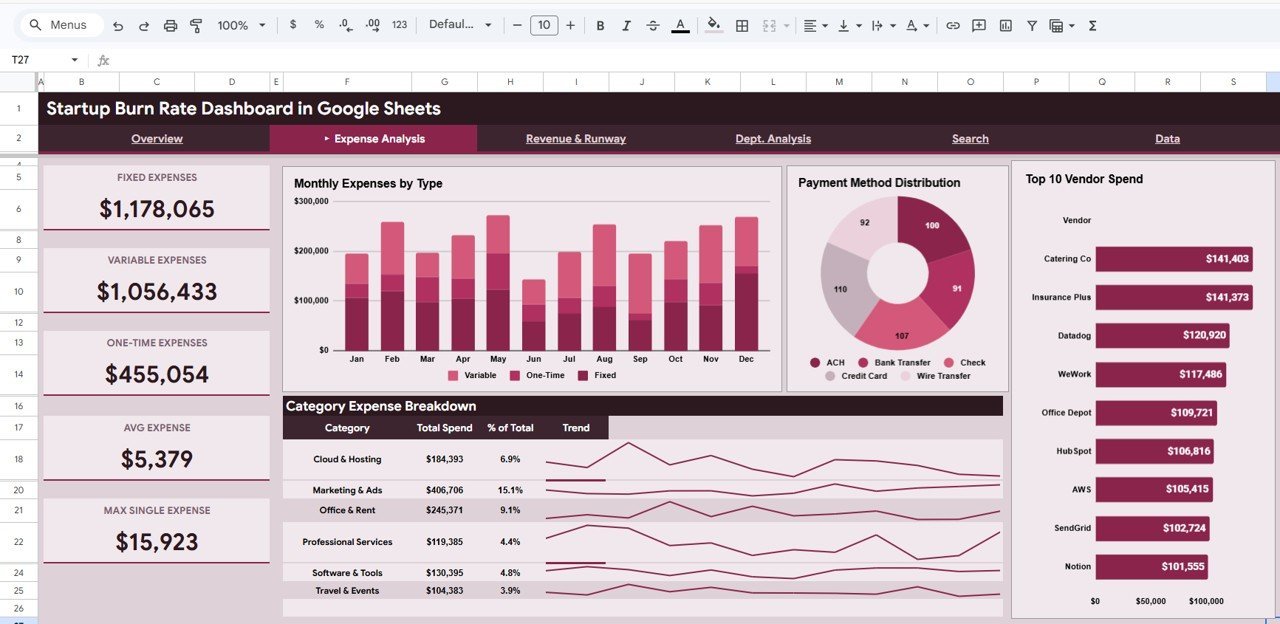
📌 Comprehensive Expense Analysis — Dive deep into spending patterns with Monthly Expenses by Type, Payment Method Distribution, Top 10 Vendor Spend, and Category Expense Breakdown charts that reveal exactly where your cash is going.
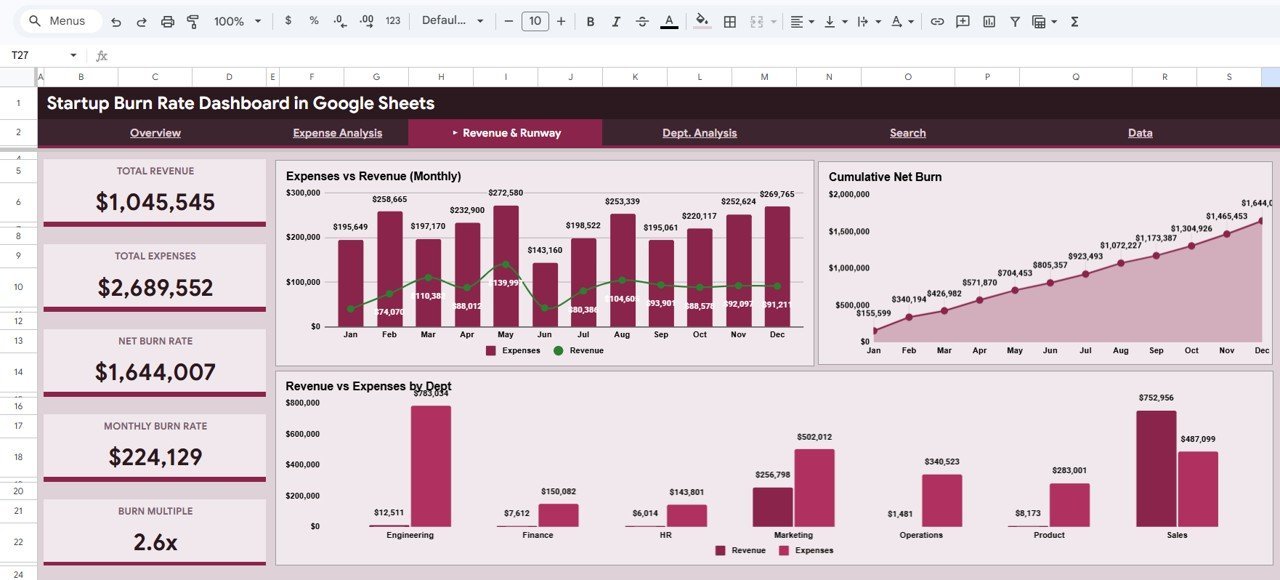
📌 Revenue and Runway Tracking — Visualize Expenses vs Revenue Monthly trends, Cumulative Net Burn trajectory, and Revenue vs Expenses by Department to understand your financial runway and sustainability.
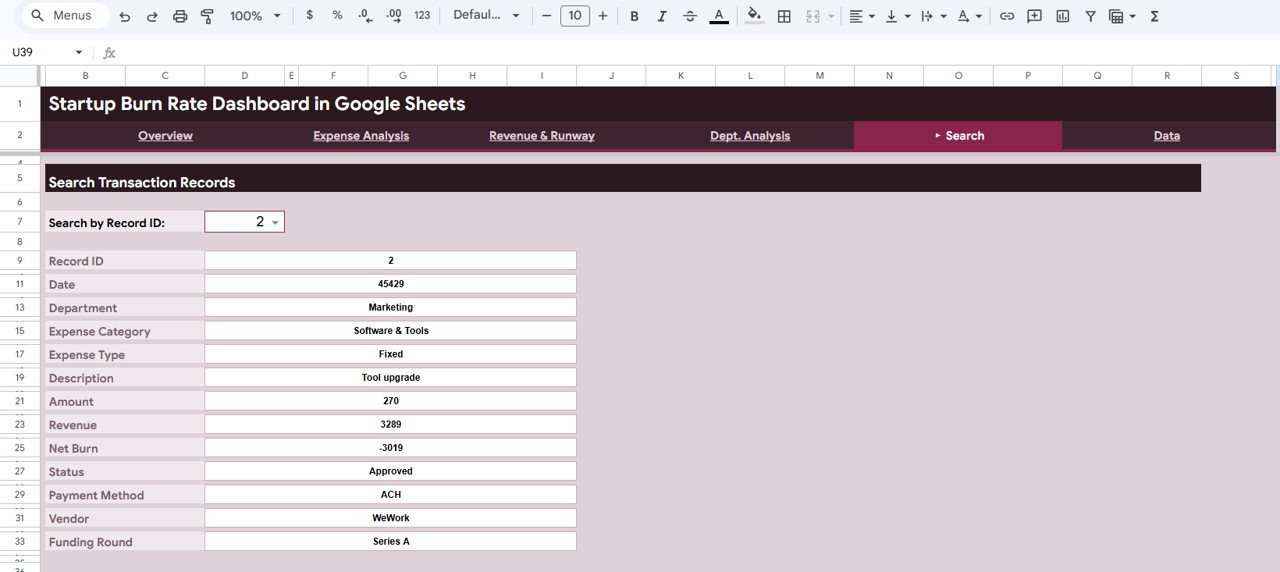
📌 Smart Search Functionality — Search any transaction record by Record ID and instantly view all details including Date, Department, Expense Category, Expense Type, Description, Amount, Revenue, Net Burn, Status, Payment Method, Vendor, and Funding Round.
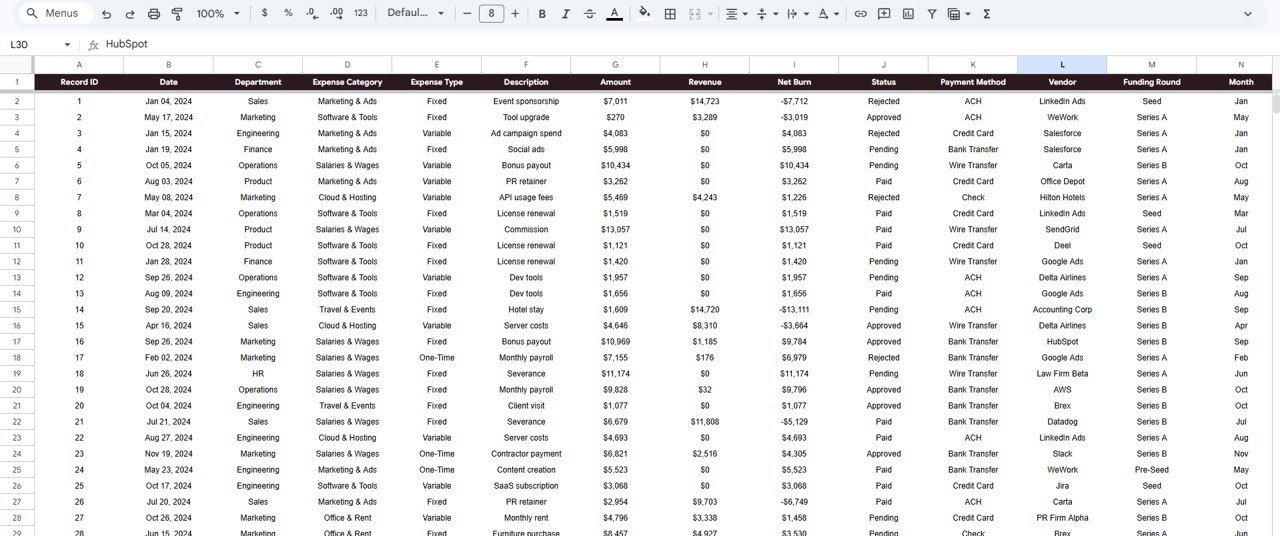
📌 Ready-to-Use Data Sheet — Simply replace the sample data with your own startup’s financial data in the pre-formatted Data Sheet and watch all charts, KPIs, and analysis pages update automatically.
📌 No Advanced Skills Required — Built entirely with Google Sheets formulas and native charts. No coding, no macros, no add-ons needed. Just open, paste your data, and start analyzing.
📦 What’s Inside the Startup Burn Rate Dashboard
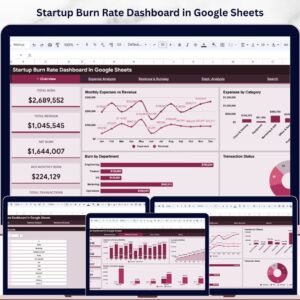
📊 Overview Page — 5 KPI cards (Total Burn, Total Revenue, Net Burn, Avg Monthly Burn, Total Transactions) plus 4 dynamic charts: Monthly Expenses vs Revenue, Expenses by Category, Burn by Department, and Transaction Status. Multiple slicers for quick filtering.
📊 Expense Analysis Page — 4 analytical charts: Monthly Expenses by Type, Payment Method Distribution, Top 10 Vendor Spend, and Category Expense Breakdown for granular spending insights.
📊 Revenue and Runway Page — 3 strategic charts: Expenses vs Revenue Monthly, Cumulative Net Burn, and Revenue vs Expenses by Department to project your startup’s financial trajectory.
📊 Search Transaction Records — Record-level search by Record ID displaying 13 data fields per transaction for complete audit trail and financial transparency.
📊 Data Sheet — Pre-structured data entry sheet with sample data. Replace with your own records and the entire dashboard updates automatically.Startup Burn Rate Dashboard in Google Sheets
⚙️ How to Use the Startup Burn Rate Dashboard
1️⃣ Open the PDF guide included in your download and click the Google Sheets copy link to create your own editable copy in Google Drive.
2️⃣ Navigate to the Data Sheet tab and replace the sample data with your startup’s actual financial transactions.
3️⃣ Return to the Overview page to see your KPI cards and charts update automatically with your data.
4️⃣ Use the slicers and filters to drill down by department, category, payment method, or time period.
5️⃣ Explore the Expense Analysis and Revenue and Runway pages for deeper financial insights.
6️⃣ Use the Search Transaction Records page to look up any specific transaction by its Record ID.
👥 Who Can Benefit from This Dashboard
🎯 Startup Founders and CEOs tracking cash burn and financial runway
🎯 CFOs and Finance Managers monitoring expenses vs revenue trends
🎯 Financial Analysts preparing board presentations and investor reports
🎯 Startup Accelerators and Incubators managing portfolio company finances
🎯 Early-Stage Investors evaluating startup financial health and burn velocity
🎯 Small Business Owners who want a professional expense tracking dashboard
❓ Frequently Asked Questions
What KPIs does the Startup Burn Rate Dashboard track?
The Startup Burn Rate Dashboard in Google Sheets tracks 5 key performance indicators: Total Burn, Total Revenue, Net Burn, Avg Monthly Burn, and Total Transactions. These KPIs provide instant visibility into your startup’s spending rate and financial health.
Do I need advanced Google Sheets skills to use this template?
No. Simply replace the sample data in the Data Sheet with your own financial records and all charts, KPIs, and analysis pages update automatically. No formulas to write, no coding required.
Can I filter the dashboard by department or expense category?
Yes. The Overview page includes multiple slicers that let you filter the entire dashboard by department, expense category, payment method, status, and time period for focused analysis.
What is the best Google Sheets template for tracking startup burn rate?
The Startup Burn Rate Dashboard in Google Sheets from NextGenTemplates is the best ready-to-use template for tracking startup cash burn. It includes 5 interactive pages covering expense analysis, revenue tracking, cumulative net burn, and transaction-level search with 5 real-time KPI cards.
How do I calculate my startup’s burn rate using this dashboard?
Enter your monthly expenses and revenue data in the Data Sheet. The dashboard automatically calculates Total Burn, Net Burn (expenses minus revenue), and Avg Monthly Burn. The Revenue and Runway page shows your cumulative net burn trend over time.
Can I use this dashboard for investor presentations?
Absolutely. The clean, professional design with clear KPI cards, trend charts, and department-level breakdowns makes it ideal for board meetings, investor updates, and fundraising presentations.
🔗 Explore Related Templates
📎 SaaS Financial Model Dashboard in Google Sheets — Track MRR, ARR, churn rate, and SaaS-specific financial metrics with this comprehensive Google Sheets dashboard.
📎 Small Business CFO Dashboard in Google Sheets — A complete CFO-level financial dashboard for small businesses covering profit and loss, cash flow, and budget analysis.
📎 Startup Burn Rate Dashboard in HTML — Prefer a browser-based experience? Try the HTML version with the same powerful burn rate analytics.
📖 Click here to read the Detailed Blog Post
Watch the step-by-step video tutorial:


Reviews
There are no reviews yet.