

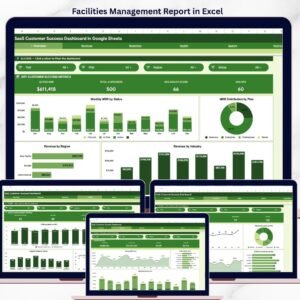
The SaaS Customer Success Dashboard in Google Sheets tracks 4 executive KPIs across 6 interactive sheet tabs, with 12+ pre-built charts, multiple slicers, and a customer lookup search page. Setup takes under 10 minutes — just replace the sample data with your own and every dashboard page updates automatically.
🌍 Join 8,400+ teams in 40+ countries using NextGenTemplates to replace paid SaaS tools with one-time-purchase Excel, Google Sheets, Power BI, and HTML templates.
✅ Instant download · One-time payment · No subscription · No per-user fees · Lifetime access
🔑 Key Features of SaaS Customer Success Dashboard in Google Sheets
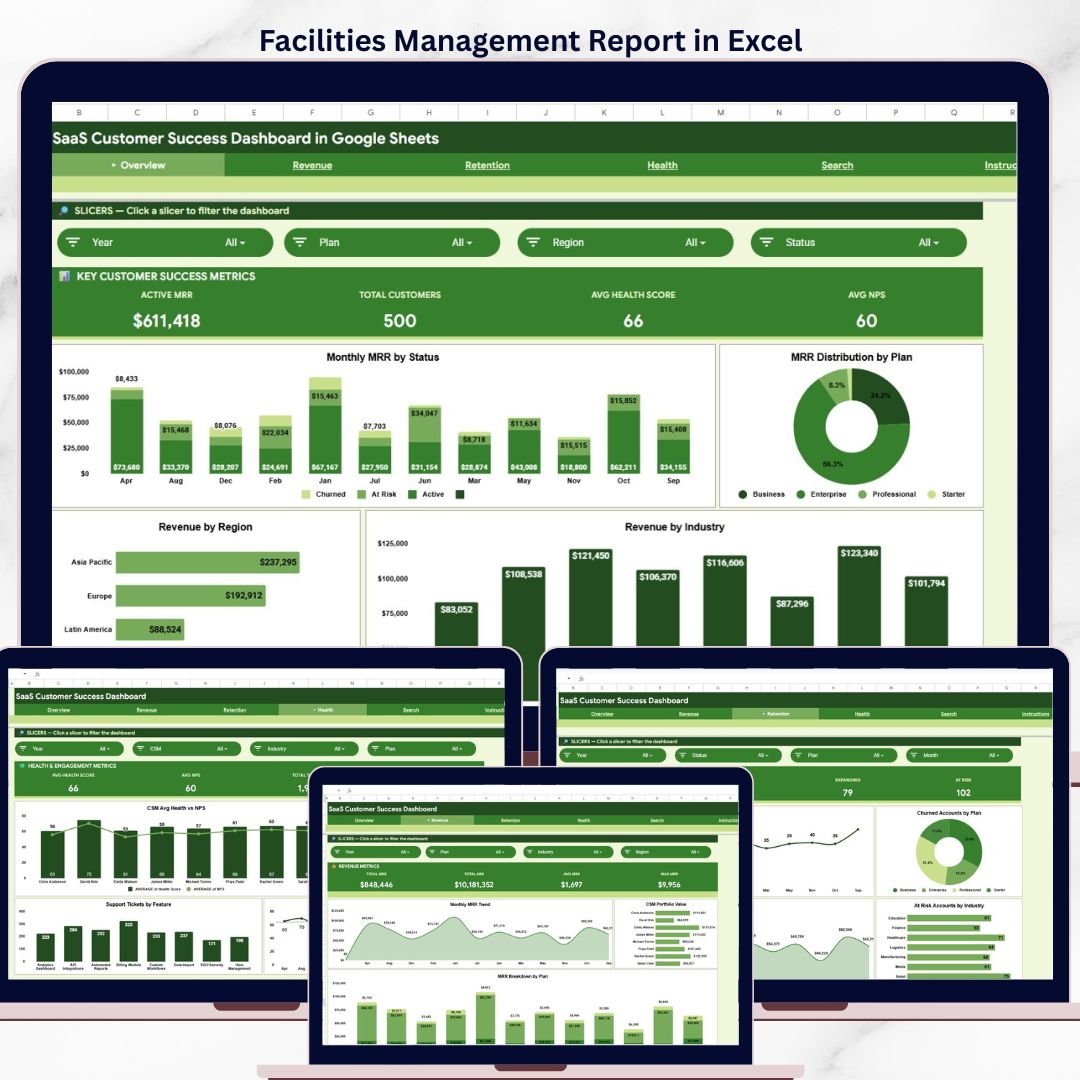
The SaaS Customer Success Dashboard in Google Sheets monitors critical customer success metrics including Active MRR, Total Customers, Average Health Score, and Average NPS across 6 structured sheet tabs with interactive slicers for instant filtering. The dashboard delivers monthly MRR analysis by status, MRR distribution by plan, and revenue breakdowns by region and industry — all from native Google Sheets formulas and charts with zero coding required.
📌 The Overview page displays 4 KPI cards (Active MRR, Total Customers, Avg Health Score, Avg NPS) alongside charts showing Monthly MRR by Status, MRR Distribution by Plan, Revenue by Region, and Revenue by Industry. Multiple slicers let you filter the entire dashboard by any dimension instantly. Explore more Google Sheets Dashboard Templates for additional analytics solutions.
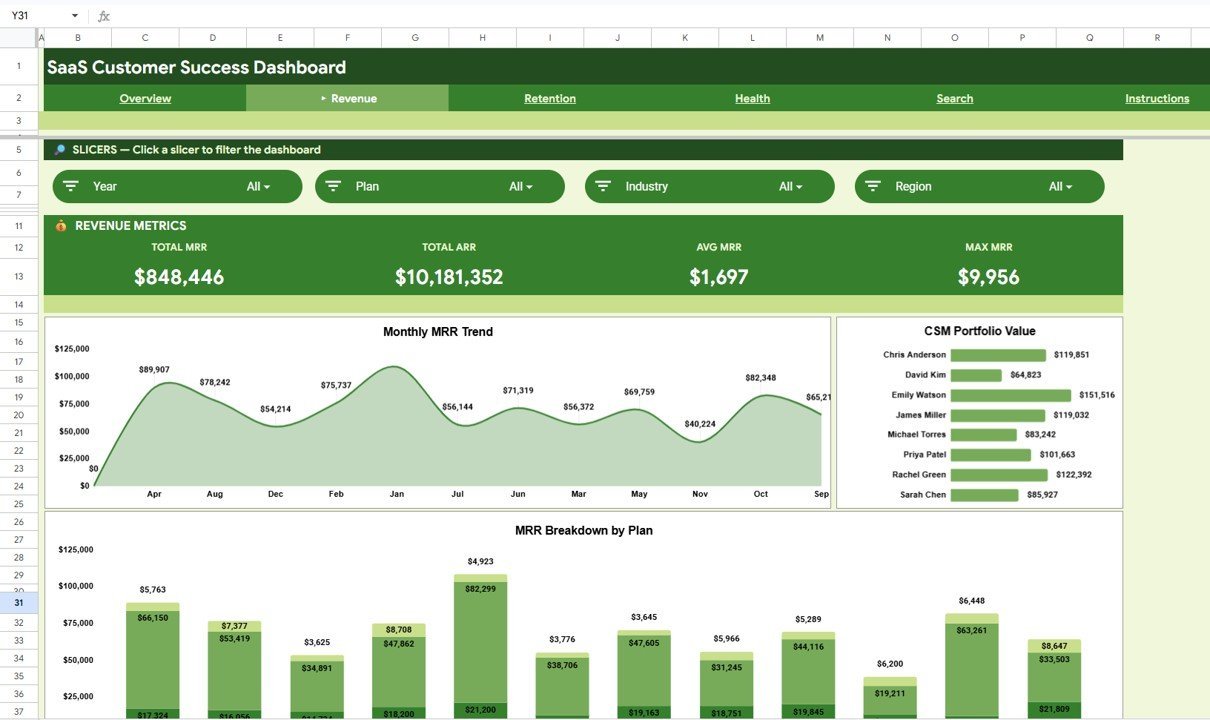
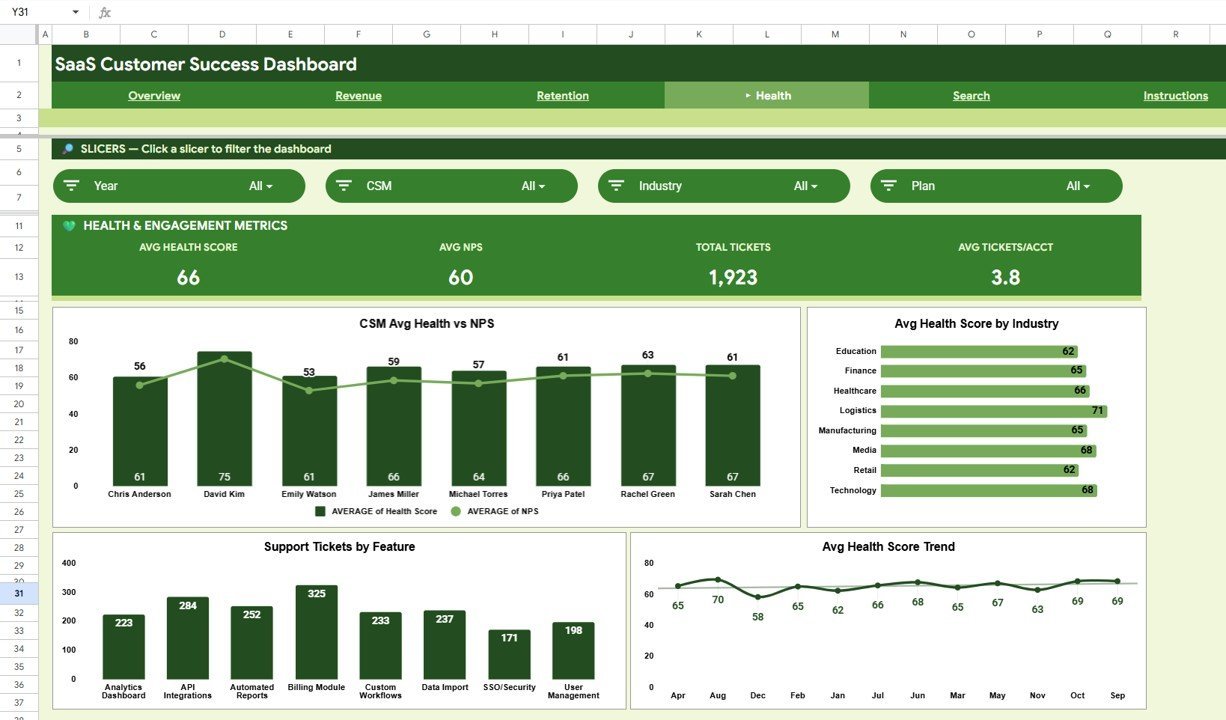
📊 Dedicated Revenue Analysis, Retention Analysis, and Health & Engagement Analysis pages provide deep-dive views into Monthly MRR Trend, CSM Portfolio Value by CSM, Churn Trends by Plan, Expansion Revenue by Month, and Health Score Trends. Pair this with the Subscription Business Dashboard in Google Sheets for a complete subscription analytics setup.
📂 A built-in Search Page lets you select any Customer ID from a dropdown to view complete customer details — Customer ID, Date, Company, Plan, Industry, Region, CSM, MRR, ARR, Health Score, NPS, and Tickets Open — making individual account reviews instant.
📦 What’s Inside the SaaS Customer Success Dashboard in Google Sheets
📄 Sheet 1 — Overview Page: The main command center with 4 KPI cards showing Active MRR, Total Customers, Avg Health Score, and Avg NPS. Interactive charts display Monthly MRR by Status tracking revenue trends across active, churned, and expansion categories. MRR Distribution by Plan shows how revenue splits across subscription tiers. Revenue by Region and Revenue by Industry reveal geographic and sector-level performance. Multiple slicers allow instant filtering across the entire page.
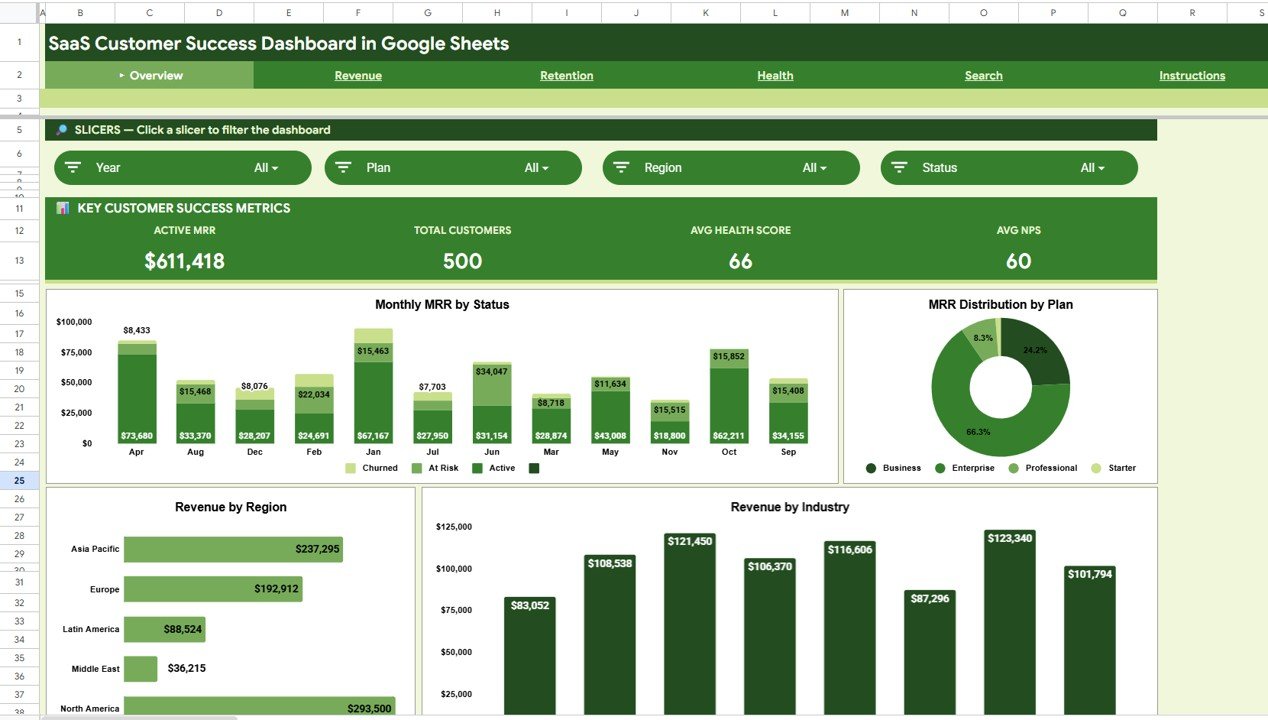 Overview Page
📄 Sheet 2 — Revenue Analysis: Deep-dive revenue insights with Monthly MRR Trend showing recurring revenue patterns over time, CSM Portfolio Value by CSM comparing account manager portfolio sizes, and MRR Breakdown by Plan identifying which subscription plans generate the most recurring revenue.
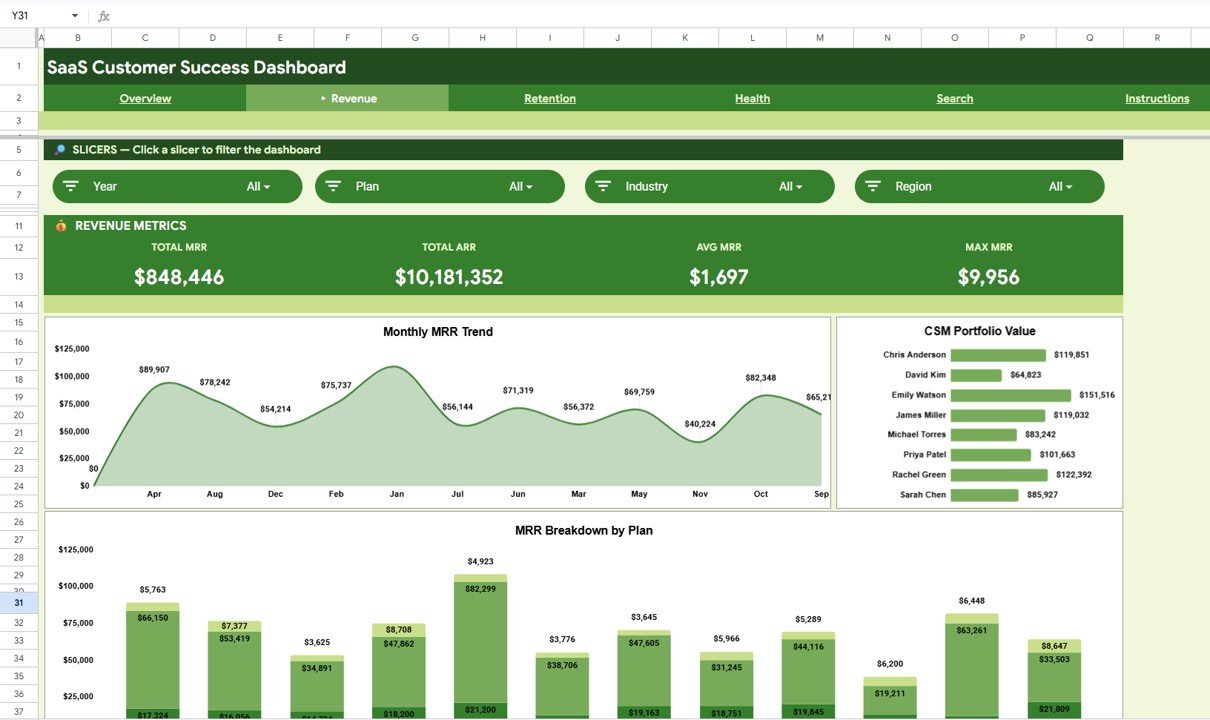 Revenue Analysis
📄 Sheet 3 — Retention Analysis: Critical retention metrics including Monthly Churn Trend tracking customer attrition over time, Churned Accounts by Plan identifying which tiers lose the most customers, Expansion Revenue by Month showing upsell and cross-sell performance, and At Risk Accounts by Industry pinpointing sectors with the highest churn probability.
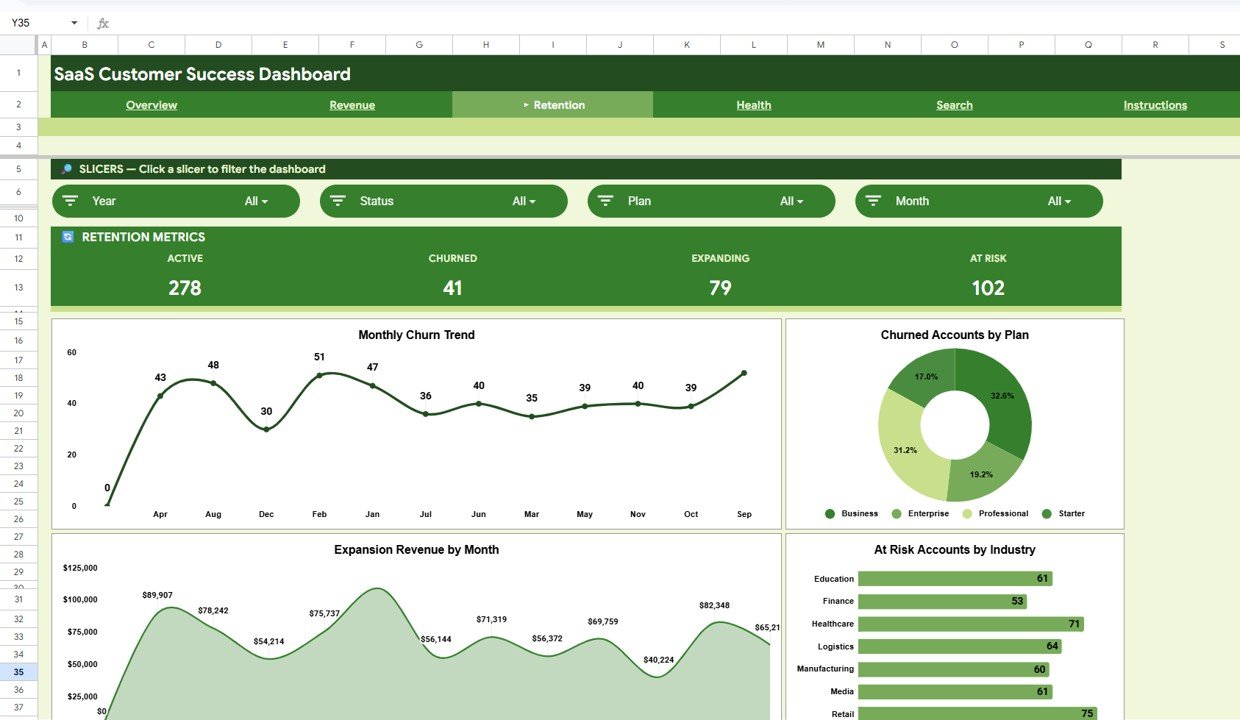 Retention Analysis
📄 Sheet 4 — Health and Engagement Analysis: Customer wellness monitoring with CSM Avg Health vs NPS by CSM comparing manager effectiveness, Avg Health Score by Industry identifying sector-level customer health, Support Tickets by Feature revealing which product areas generate the most support volume, and Avg Health Score Trend by Month tracking customer health trajectory over time.
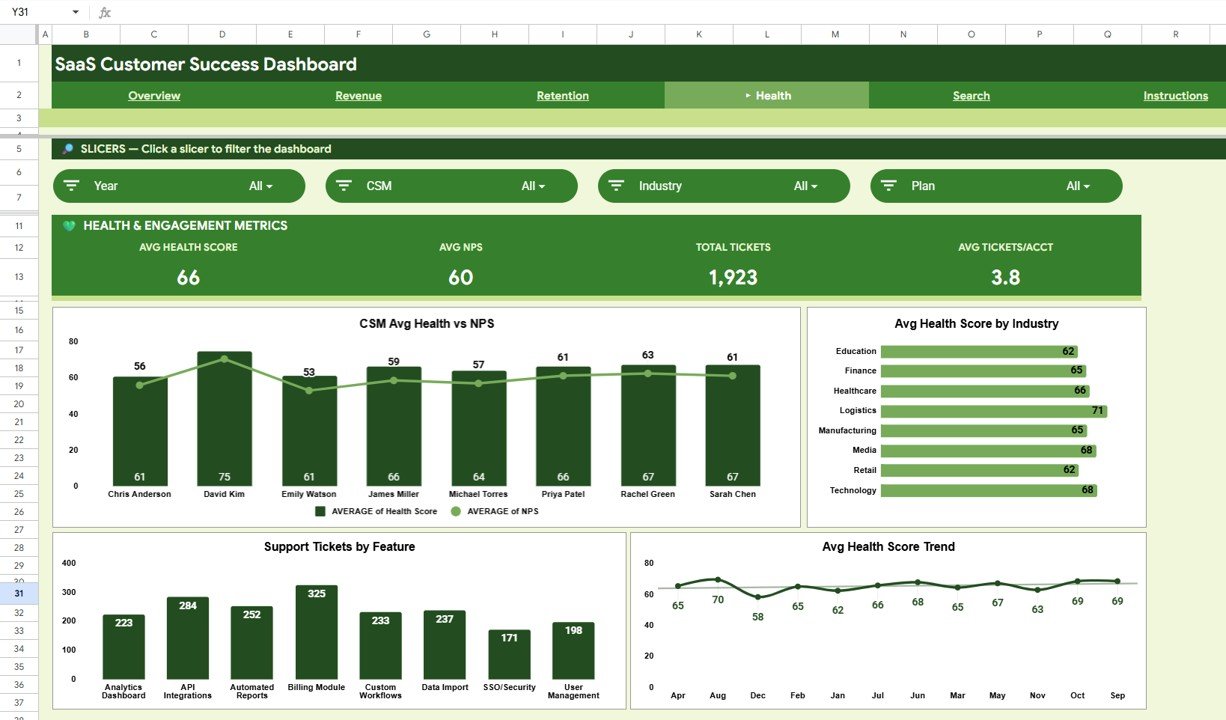 Health and Engagement Analysis
📄 Sheet 5 — Search Page: A Customer Lookup feature where you select any Customer ID from a dropdown and instantly view their complete profile — Customer ID, Date, Company, Plan, Industry, Region, CSM, MRR, ARR, Health Score, NPS, and Tickets Open. Ideal for customer success managers doing individual account reviews and support calls.
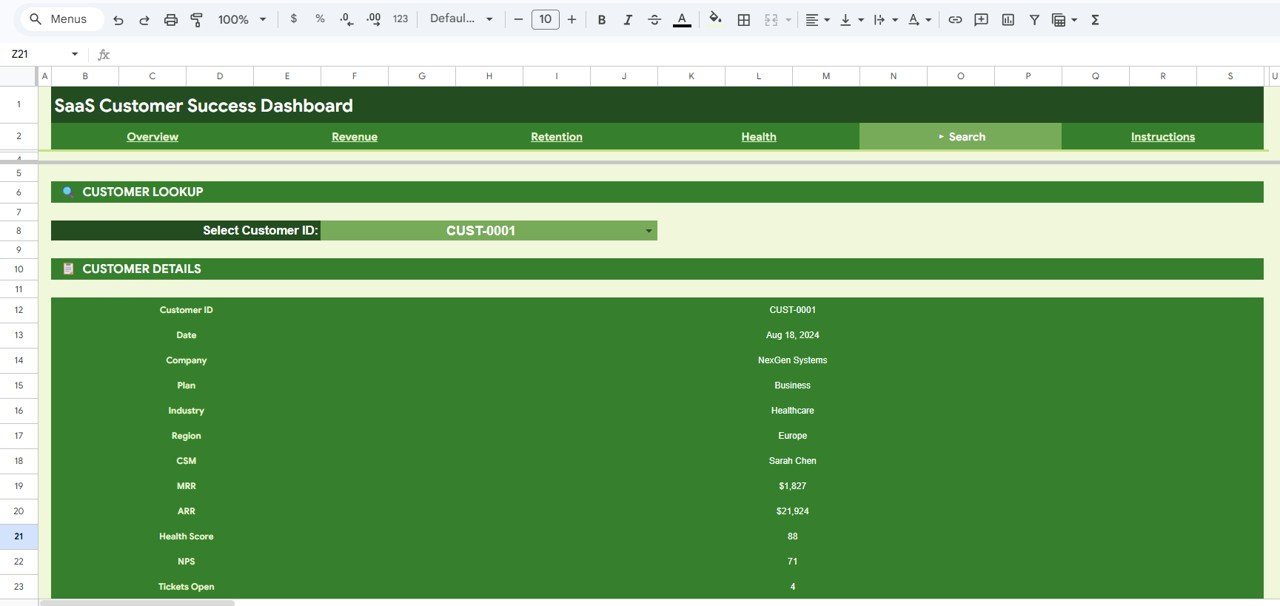 Search Sheet Tab
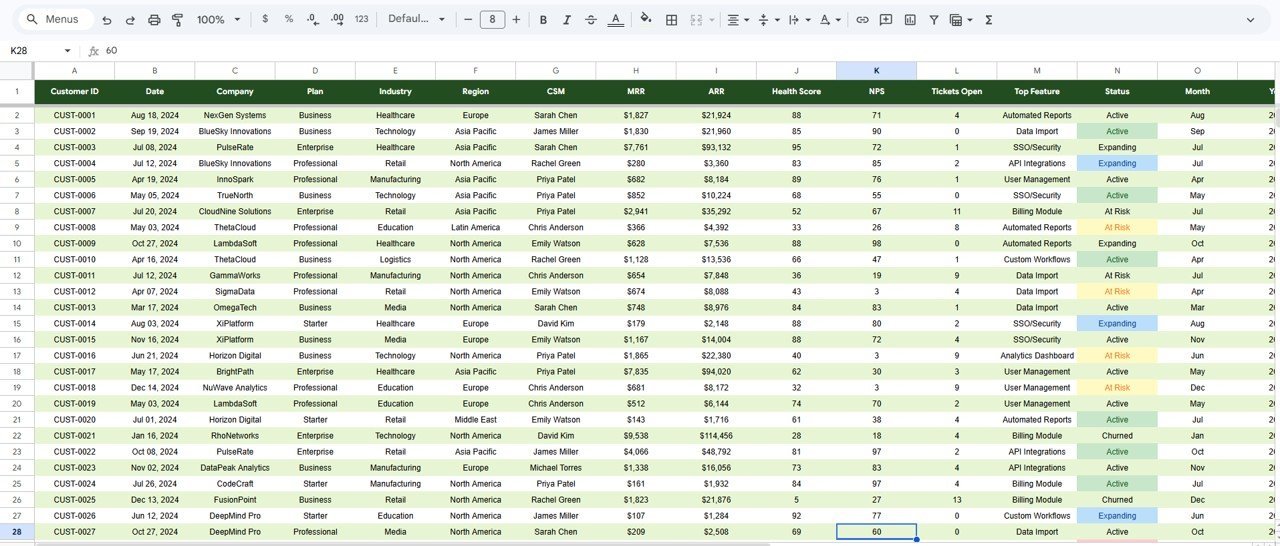
📄 Sheet 6 — Data Sheet: The structured data input sheet where you add your SaaS customer data in the same format as the sample. All dashboard pages pull from this sheet automatically — replace the sample records and every chart and KPI card refreshes.
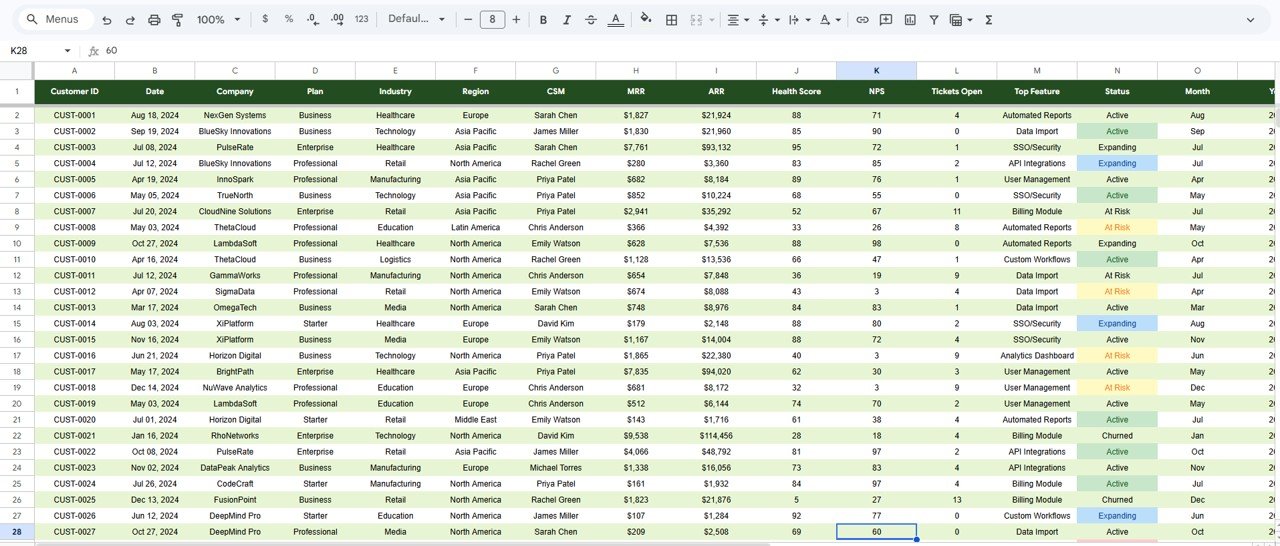 Data Sheet Tab
📊 SaaS Customer Success Dashboard in Google Sheets vs. Microsoft Excel Dashboard vs. Gainsight — Where This Fits
| Feature | SaaS Customer Success Dashboard in Google Sheets | Microsoft Excel Dashboard | Gainsight / Totango / ChurnZero |
|---|---|---|---|
| Cost | $9.99 one-time | $17.99 one-time | $2,500–$10,000+ / year |
| Platform | Google Sheets (cloud) | Microsoft Excel (desktop) | Cloud SaaS |
| Setup time | Under 10 minutes | Under 10 minutes | 4–12 weeks onboarding |
| Real-time team collaboration | ✅ Built-in | ❌ File sharing needed | ✅ Built-in |
| Mobile access | ✅ Google Sheets app | Limited | ✅ Mobile app |
| Customer health scoring | ✅ Health Score + NPS | ✅ Manual setup | ✅ AI-powered |
| Customizable fields | ✅ Edit any cell | ✅ Edit any cell | ✅ With configuration |
| Share with link | ✅ Google Drive sharing | ❌ Email attachment | ✅ Built-in |
| Year-1 cost at 5 users | $9.99 total | $17.99 total | $2,500–$10,000+ |
For SaaS teams that want structured customer success tracking without paying $2,500+/year for Gainsight, the SaaS Customer Success Dashboard in Google Sheets sits in the sweet spot.
👥 Who This Template Is For — and Who It’s Not For
✅ This template is built for:
- Customer success managers at SaaS companies with 50–500 accounts tracking MRR, health scores, and NPS monthly
- SaaS founders monitoring churn trends, expansion revenue, and CSM performance without a dedicated CS platform
- Revenue operations teams analyzing MRR by plan, region, and industry for quarterly business reviews
- Account managers reviewing individual customer details before renewal calls using the Search Page
❌ This template is NOT for:
- Enterprise CS teams needing automated health scoring with real-time API feeds from Salesforce or HubSpot
- Organizations requiring role-based access controls, SOC 2 compliance, and audit logging
- Teams managing 10,000+ accounts needing machine learning-driven churn prediction
⚙️ How to Use the SaaS Customer Success Dashboard in Google Sheets
1️⃣ Open the PDF guide included in your download and click the Google Sheets copy link to create your own editable copy in Google Drive.
2️⃣ Navigate to the Data Sheet tab and replace the sample data with your actual SaaS customer records — maintain the same column format.
3️⃣ Head to the Overview page to see your KPI cards and charts update automatically. Use the slicers to filter by plan, region, or industry.
4️⃣ Explore the Revenue Analysis, Retention Analysis, and Health & Engagement Analysis tabs for deep-dive insights.
5️⃣ Use the Search Page to look up any individual customer’s complete profile using the Customer ID dropdown.
6️⃣ Share the Google Sheets link with your team for real-time collaborative access from any device.
💼 Real-World Use Cases
Anita manages customer success at a 70-person B2B SaaS company in Bangalore. She uses the SaaS Customer Success Dashboard in Google Sheets to track Active MRR, monthly churn trends, and health scores across 180 accounts. The CSM Portfolio Value chart helps her balance account loads across 4 success managers, and the Search Page gives her instant context before every renewal call — replacing the $3,000/year Totango subscription her team had been evaluating.
David runs revenue operations at a 25-person product analytics startup in Berlin. He tracks MRR by plan and region on the Overview page, monitors expansion revenue trends on the Retention Analysis tab, and flags at-risk accounts by industry during monthly leadership reviews. The slicer-based filtering lets him build segment-specific views in seconds without creating separate reports.
Priya is a fractional CS consultant working with 3 early-stage SaaS clients. She duplicates the SaaS Customer Success Dashboard for each client, enters their data in the Data Sheet, and presents health score trends and NPS analysis during monthly strategy calls. The Customer Engagement KPI Scorecard in Google Sheets complements this dashboard for clients who also want MTD/YTD scorecard-style tracking.
❓ Frequently Asked Questions
What KPIs does the SaaS Customer Success Dashboard in Google Sheets track?
The SaaS Customer Success Dashboard in Google Sheets tracks 4 key metrics — Active MRR, Total Customers, Avg Health Score, and Avg NPS — across 6 sheet tabs with 12+ charts covering revenue analysis, retention trends, health scoring, and individual customer lookup.
How does this compare to using Gainsight for customer success tracking?
Gainsight costs $2,500–$10,000+ per year and requires weeks of onboarding. The SaaS Customer Success Dashboard in Google Sheets costs $9.99 one-time, works in any browser in under 10 minutes, and tracks the same core CS metrics — MRR, churn, health scores, NPS, and expansion revenue. For teams under 500 accounts that need structured tracking without a SaaS subscription, this template delivers equivalent visibility at a fraction of the cost.
Can I customize the dashboard to match my SaaS metrics?
Yes. All data fields are editable in the Data Sheet. You can modify plans, industries, regions, CSM names, and any other dimension. The charts and KPI cards update automatically when you change the underlying data.
Does the dashboard support team collaboration?
Yes. Since this is built in Google Sheets, you can share the file via Google Drive link with your entire team. Multiple users can view and edit simultaneously with real-time updates — a key advantage over desktop-only Excel dashboards.
How long does it take to set up this customer success dashboard?
Setup takes under 10 minutes. Open the PDF guide, click the Google Sheets copy link, replace the sample data in the Data Sheet, and all 6 tabs — Overview, Revenue Analysis, Retention Analysis, Health & Engagement Analysis, Search Page, and Data Sheet — update automatically.
What is the Search Page used for?
The Search Page lets you select any Customer ID from a dropdown and instantly view all details including Company, Plan, Industry, Region, CSM, MRR, ARR, Health Score, NPS, and Tickets Open. It is ideal for account reviews, renewal preparation, and customer support context.
Can I track churn and expansion revenue with this dashboard?
Yes. The Retention Analysis page tracks Monthly Churn Trend, Churned Accounts by Plan, Expansion Revenue by Month, and At Risk Accounts by Industry — giving you complete visibility into customer retention and upsell performance.
👤 About the Author
Built by PK — Microsoft Certified Professional with 15+ years of Excel, Google Sheets, and Power BI experience. Founder of NextGenTemplates, reaching 300K+ subscribers across YouTube channels (@PK-AnExcelExpert, @NextGenTemplates, @NeoTechNavigators). Every template is hand-built and tested before release.
🔗 Explore Related Templates
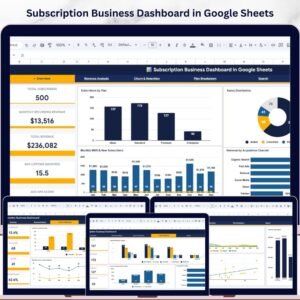
📊 Subscription Business Dashboard in Google Sheets — Track MRR, churn, retention, and subscriber growth with 6 interactive pages.
📊 Customer Engagement KPI Scorecard in Google Sheets — Track 10+ customer engagement KPIs with MTD/YTD toggles and trend charts.
📊 SaaS Metrics Dashboard in Power BI — Monitor MRR, ARR, churn, and expansion revenue with 5 interactive Power BI pages.
💡 Also available as: SaaS Financial Model Dashboard in HTML — browser-based SaaS financial analytics with zero installation.
Browse all Google Sheets Dashboard Templates and Customer Service Templates for more analytics solutions.
📖 Click here to read the Detailed Blog Post
Watch the step-by-step video tutorial:
🎥 Visit our YouTube channel for step-by-step video tutorials
👉 YouTube.com/@NextGenTemplates


Reviews
There are no reviews yet.