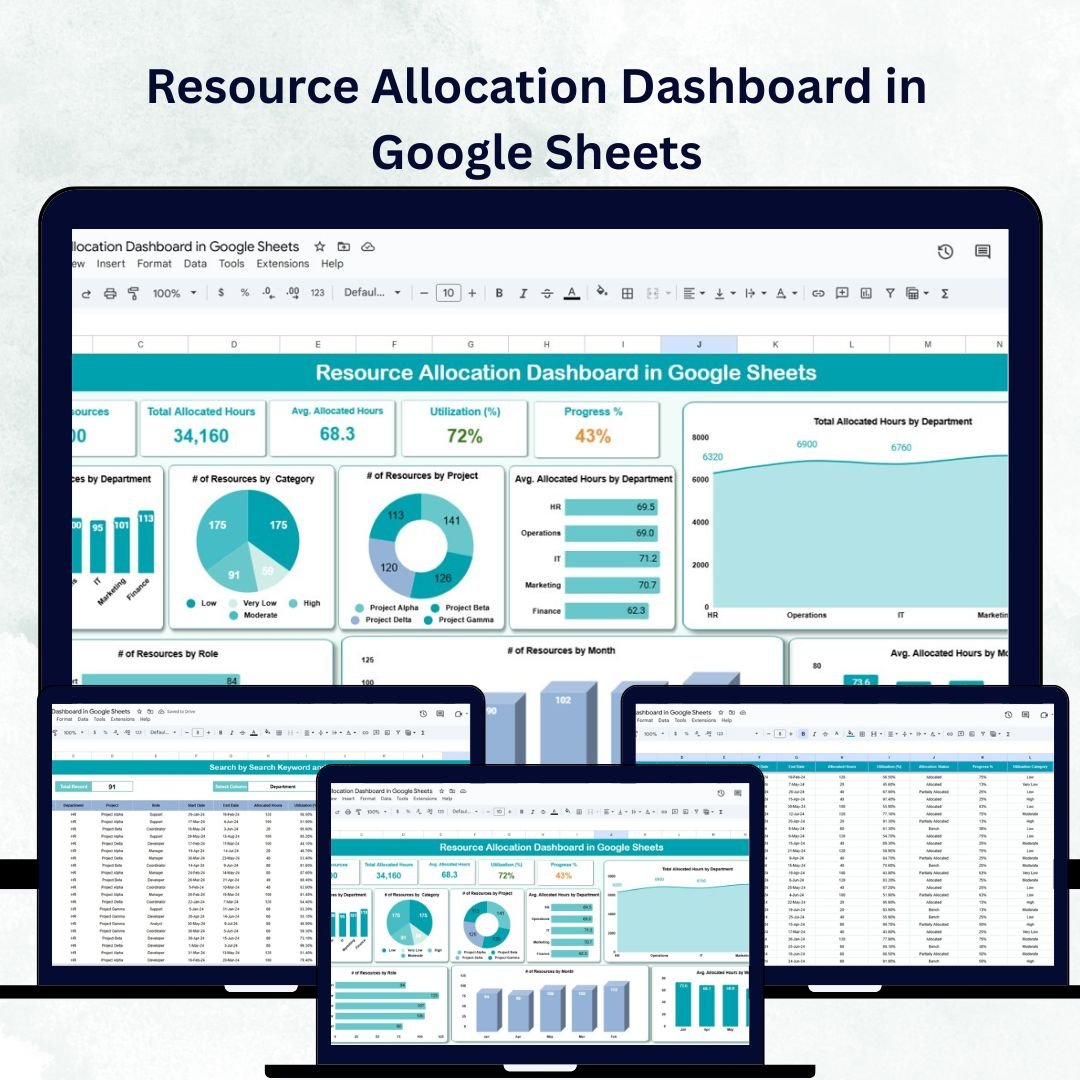
Managing resources effectively is one of the biggest challenges in project management. The Resource Allocation Dashboard in Google Sheets is a ready-to-use solution that empowers managers to track resource utilization, allocation, and productivity — all from one interactive dashboard. 🚀
Designed for project managers, HR professionals, and operations teams, this dashboard simplifies how organizations plan, allocate, and monitor their workforce. It helps identify underutilized and over-allocated employees, balance workloads, and ensure every team member contributes effectively to organizational goals.

🔑 Key Features of the Resource Allocation Dashboard in Google Sheets
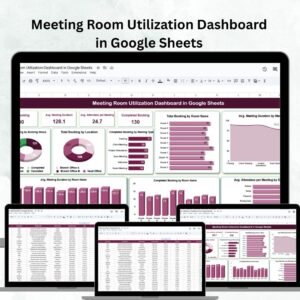
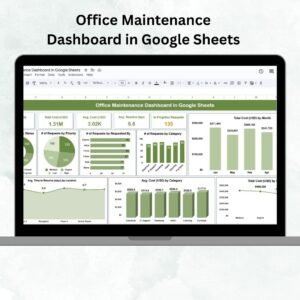
📊 Dashboard Sheet Tab
The Dashboard Sheet gives a complete visual summary of all allocation and utilization data:
-
Cards Section:
-
of Resources 👥 – Total number of employees or team members
-
Total Allocated Hours ⏱️ – Combined hours assigned across all projects
-
Avg. Allocated Hours 🕓 – Average hours per resource
-
Utilization (%) 💼 – Percentage of total capacity used
-
Progress % 📈 – Overall progress across all tasks or projects
-
-
Charts Section:
-
of Resources by Department – Shows distribution across departments
-
of Resources by Category – Analyzes allocation by skill or role category
-
of Resources by Project – Identifies which projects use the most resources
-
Avg. Allocated Hours by Department – Highlights workload balance
-
Total Allocated Hours by Department – Tracks departmental demand
-
Avg. Allocated Hours by Month – Detects utilization patterns over time
-
of Resources by Month – Shows monthly staffing trends
-
of Resources by Role – Breaks down workforce allocation by position
-
This sheet gives an at-a-glance overview of how your workforce is distributed and performing.
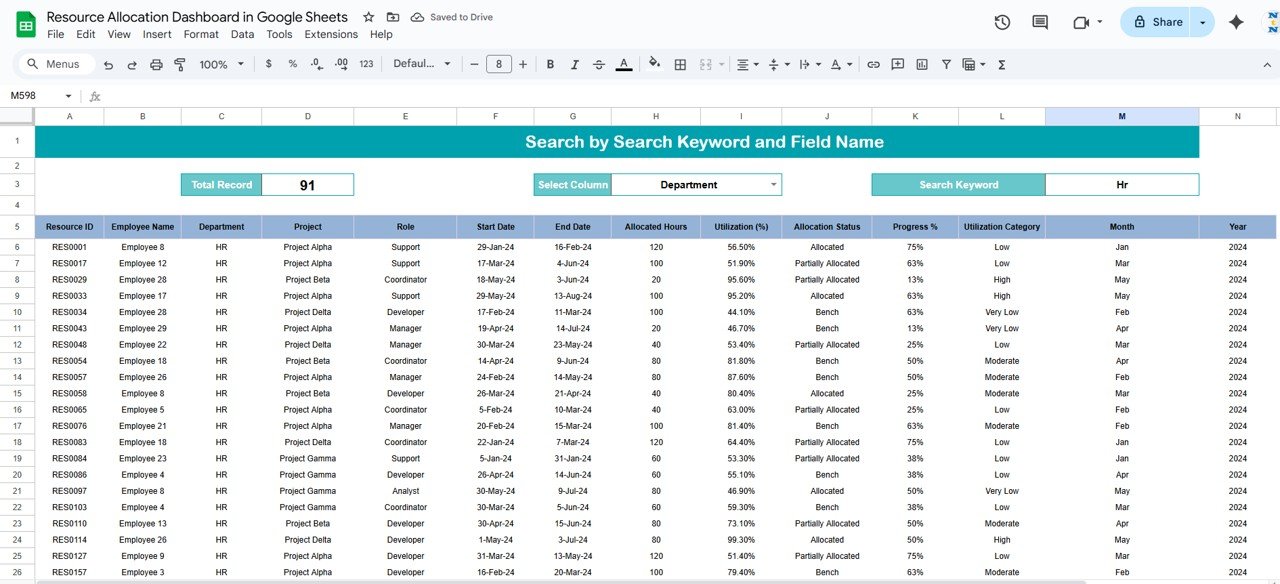
🔍 Search Sheet Tab
-
Instantly find any record using keyword or field-based search
-
Search by resource name, project, department, or role
-
Great for large teams and organizations managing multiple projects
This makes it simple for managers to locate, analyze, and verify resource records without wasting time scrolling through extensive datasets.
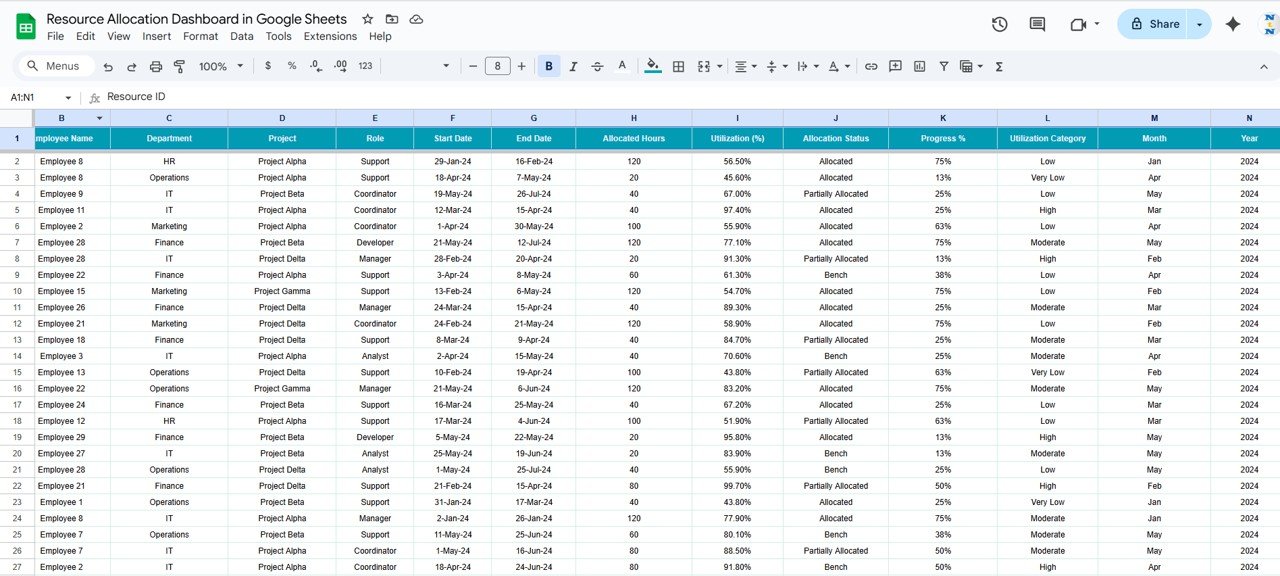
🧾 Data Sheet Tab
The Data Sheet is the backbone of the dashboard where all records are stored:
-
Fields include Resource Name, Department, Project, Role, Allocated Hours, Month, and Progress %
-
Automatically updates charts and KPIs across the dashboard
-
Supports real-time collaboration for multiple users in Google Sheets
With structured input and automated visualizations, it ensures accurate, reliable, and up-to-date tracking of your organization’s workforce allocation.
📦 What’s Inside the Resource Allocation Dashboard?
✅ Dashboard Sheet – Visual insights into allocation metrics
✅ Search Sheet – Quick record search and retrieval
✅ Data Sheet – Centralized data input and tracking
✅ Preloaded Sample Data – Ready to test and understand instantly
✅ Automated Charts & Cards – Real-time visualization
✅ Fully Customizable Fields – Add or modify based on your structure
Everything is interconnected and auto-updating — enter your data once and let the dashboard handle the rest. ⚡
🧑💼 Who Can Benefit from This Dashboard?
👨💼 Project Managers – Balance workloads and track team utilization
🏢 HR Professionals – Allocate staff efficiently across departments
🧩 Operations Managers – Identify resource gaps and optimize scheduling
📊 Department Heads – Track performance by department or role
💼 Executives – View overall workforce efficiency at a glance
It’s ideal for organizations managing multiple projects, departments, or client accounts simultaneously.
🧪 How to Use the Resource Allocation Dashboard
-
Input Data – Enter allocation details in the Data Sheet
-
Review Dashboard – Analyze charts and KPIs on the main dashboard
-
Search Records – Use the Search tab for quick lookups
-
Monitor Utilization – Track workload balance across teams
-
Optimize Resources – Use insights to redistribute underutilized employees
Built on Google Sheets, the dashboard supports real-time updates, team collaboration, and seamless sharing — making it perfect for remote or hybrid teams. 🌐
🌟 Why Choose This Dashboard?
-
Real-time visibility into workforce utilization
-
Interactive charts and automatic calculations
-
Department, project, and role-based tracking
-
Detect over-allocation and balance workloads
-
Fully editable and easy to customize
-
No coding or add-ons required — just plug and play!
With the Resource Allocation Dashboard in Google Sheets, you can transform how you manage human capital, reduce inefficiencies, and make data-driven staffing decisions to keep your projects on track and your team performing at its best. 💪📈


Reviews
There are no reviews yet.