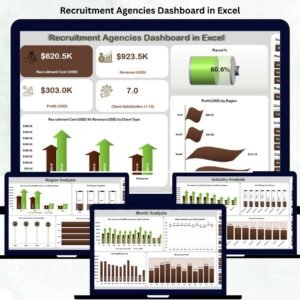
The Recruitment Agencies Dashboard in Excel is your all-in-one analytical toolkit to manage placements, clients, and profitability like a pro. Designed for staffing and recruitment professionals, this dashboard turns your everyday hiring data into visual insights that drive growth, transparency, and better decision-making.
Whether you handle a few clients or hundreds, this Excel-based solution helps you track key performance indicators (KPIs) such as Recruitment Cost vs Revenue, Profit Margin, Placement Ratio, and Client Satisfaction — all in one interactive, easy-to-use file. No coding. No extra software. Just smart analytics that work right inside Microsoft Excel.
✨ Key Features of the Recruitment Agencies Dashboard in Excel
✅ 📊 Overview Page – Central Command Center

Get a 360-degree snapshot of your agency’s health.
Includes:
KPI Cards: Total Placements, Total Revenue, Profit Margin %, Client Satisfaction Score.
Charts:
Placed % – track successful hires vs total openings.
Recruitment Cost (USD) vs Revenue (USD) by Client Type.
Profit (USD) by Region.
🎯 Instantly see where your agency performs best and where margins can improve.
✅ 🏭 Industry Analysis Page – Know Your Most Profitable Sectors
Visualize which industries deliver the highest ROI.
Compare Cost vs Revenue by Industry.
Track Profit Margin %, Client Satisfaction (1–10), and Placed % by Industry.
💡 Focus your resources on the sectors that bring in maximum placements and profits.
✅ 🌍 Region Analysis Page – Identify High-Performing Areas
Analyze geographical trends with ease.
Cost vs Revenue by Region.
Profit Margin % by Region.
Client Satisfaction and Placement Rate by Region.
📈 Perfect for agencies operating in multiple locations or countries.
✅ 👤 Candidate Source Analysis Page – Evaluate Sourcing Channels
Measure how each sourcing platform performs — job portals, referrals, LinkedIn, or databases.
Compare Cost vs Revenue and Profit by Candidate Source.
Measure Satisfaction Scores by Source.
🚀 Discover which sourcing channels produce top candidates and highest ROI.
✅ 📅 Month Analysis Page – Trend Tracking Made Simple
Uncover performance trends over time.
Monthly Cost vs Revenue, Profit, and Placement %.
Satisfaction score trends by month.
📆 Plan budgets, set realistic goals, and identify seasonal hiring patterns.
📦 What’s Inside the Dashboard
📁 Five Analytical Pages: Overview | Industry | Region | Candidate Source | Month
📂 Data Sheet: A structured backend to store all recruitment details —
Client Name, Industry, Region, Candidate Source, Recruitment Cost, Revenue, Profit, Placement Status, Client Satisfaction (1–10), and Month/Year.
All pages refresh automatically when new data is added — thanks to Excel’s powerful pivot tables and slicers.
⚙️ How to Use the Dashboard
1️⃣ Input Data: Enter client, cost, and placement info into the Data Sheet.
2️⃣ Refresh Dashboard: Click “Refresh All” — all KPIs and charts update instantly.
3️⃣ Use Slicers: Filter by Client Type, Industry, Region, or Month.
4️⃣ Analyze Insights: Review profit, satisfaction, and placement trends.
5️⃣ Share Reports: Export visuals as PDFs or images for clients or management.
💡 No advanced Excel knowledge required — everything works automatically.
👥 Who Can Benefit from This Dashboard
🏢 Recruitment Agencies & Staffing Firms – Monitor cost efficiency and placement ratios.
👩💼 HR Consultants – Track multiple client accounts with accuracy.
💻 Talent Acquisition Managers – Evaluate hiring success across regions or industries.
📊 Business Owners – Gain a clear financial view of agency performance.
🧠 Analysts & Team Leads – Measure recruiter productivity and profitability.
This Excel template is ideal for small, medium, or enterprise-level recruitment businesses.
💡 Advantages of Using the Recruitment Agencies Dashboard
✅ Centralized recruitment data — manage clients, candidates, and costs in one file.
✅ Real-time analytics — pivot charts and slicers refresh instantly.
✅ Smarter decisions — pinpoint profitable industries, clients, and sources.
✅ Time savings — automated summaries eliminate manual reports.
✅ Improved transparency — share visual reports with clients and teams.
✅ Easy scalability — expand to new clients or recruiters effortlessly.
✅ Excel-based simplicity — no complex software or subscriptions needed.
🔗 Click here to read the Detailed Blog Post
🎥 Visit our YouTube channel to learn step-by-step video tutorials