

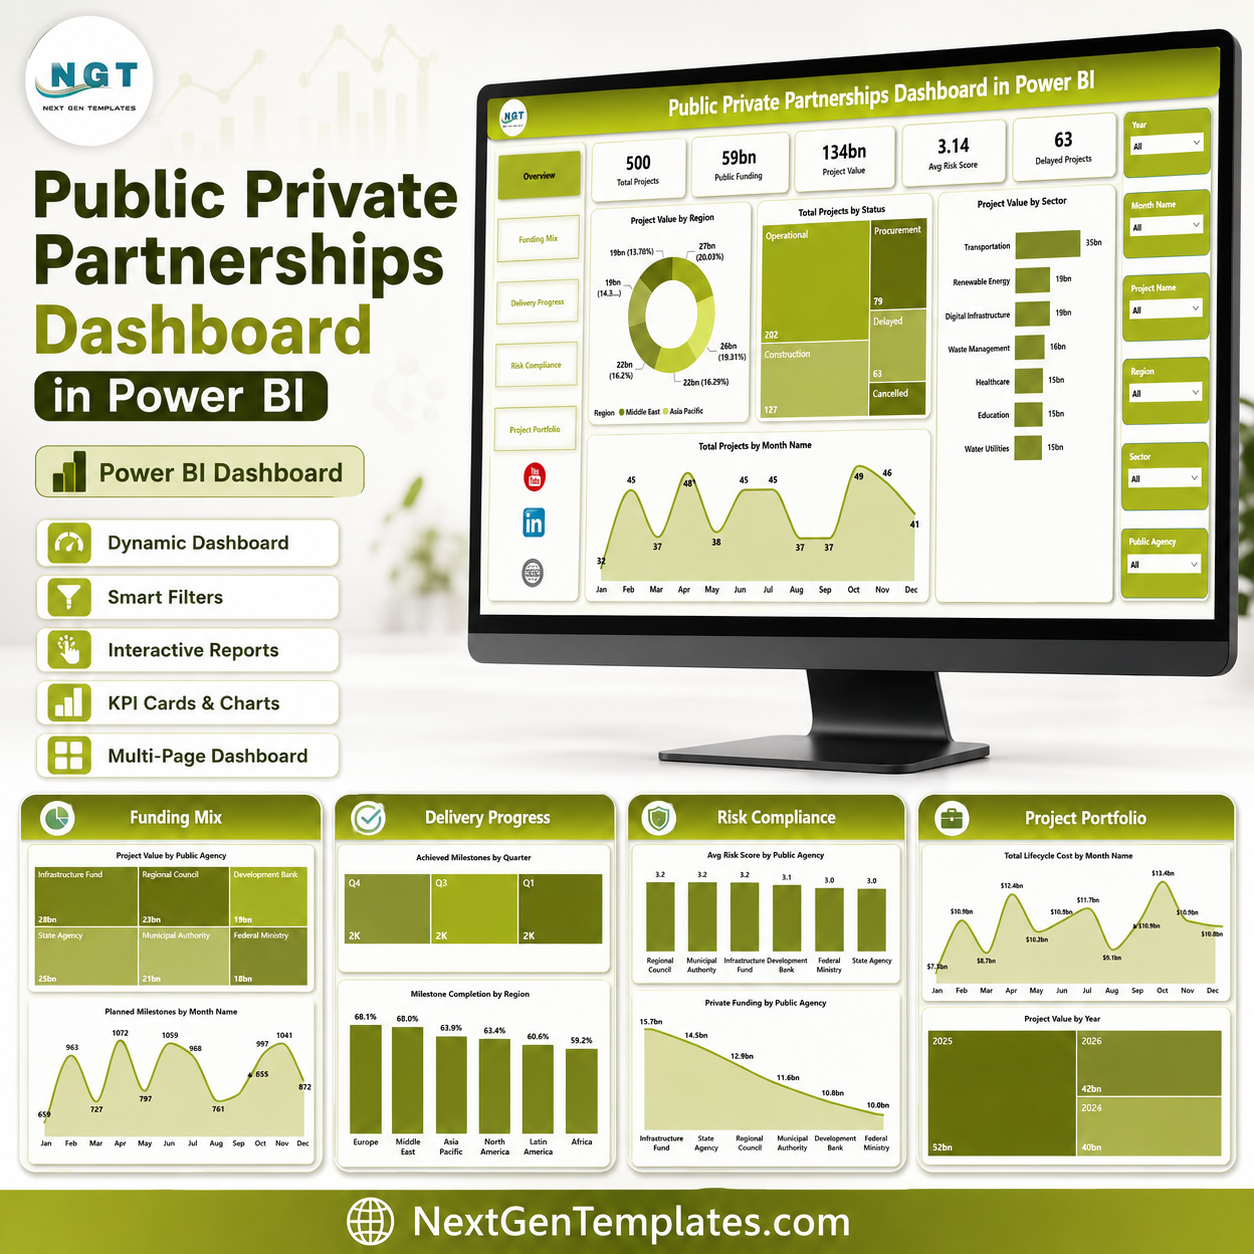

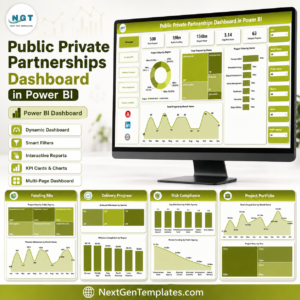
Public Private Partnerships Dashboard in Power BI gives PPP units, infrastructure agencies, government finance teams, PMOs, and concession managers a ready PBIX report with 5 report pages, 5 executive KPI cards, 16 chart views, and multiple slicers for fast portfolio review. Instead of building a PPP reporting model from a blank Power BI canvas, open the file in Power BI Desktop, connect or replace the sample data, and review project value, public funding, risk score, delays, milestones, sectors, regions, agencies, and lifecycle cost. Built by PK for a 300K+ analytics audience, this is a one-time $17.99 template purchase with no recurring dashboard SaaS fee.
Key Features of Public Private Partnerships Dashboard in Power BI
- 5 Power BI pages: Overview, Funding Mix, Delivery Progress, Risk Compliance, and Project Portfolio.
- Executive KPI cards: Track Total Projects, Public Funding, Project Value, Avg Risk Score, and Delayed Projects.
- Funding and value analysis: Compare project value by region, sector, public agency, year, and month.
- Milestone tracking: Review planned milestones, achieved milestones, and milestone completion by region and sector.
- Risk and compliance views: Analyze average risk score by public agency and sector with funding context.
- Editable PBIX file: Customize pages, visuals, measures, relationships, colors, slicers, and source connections in Power BI Desktop.
What’s Inside the Public Private Partnerships Dashboard in Power BI
1 – Overview Page
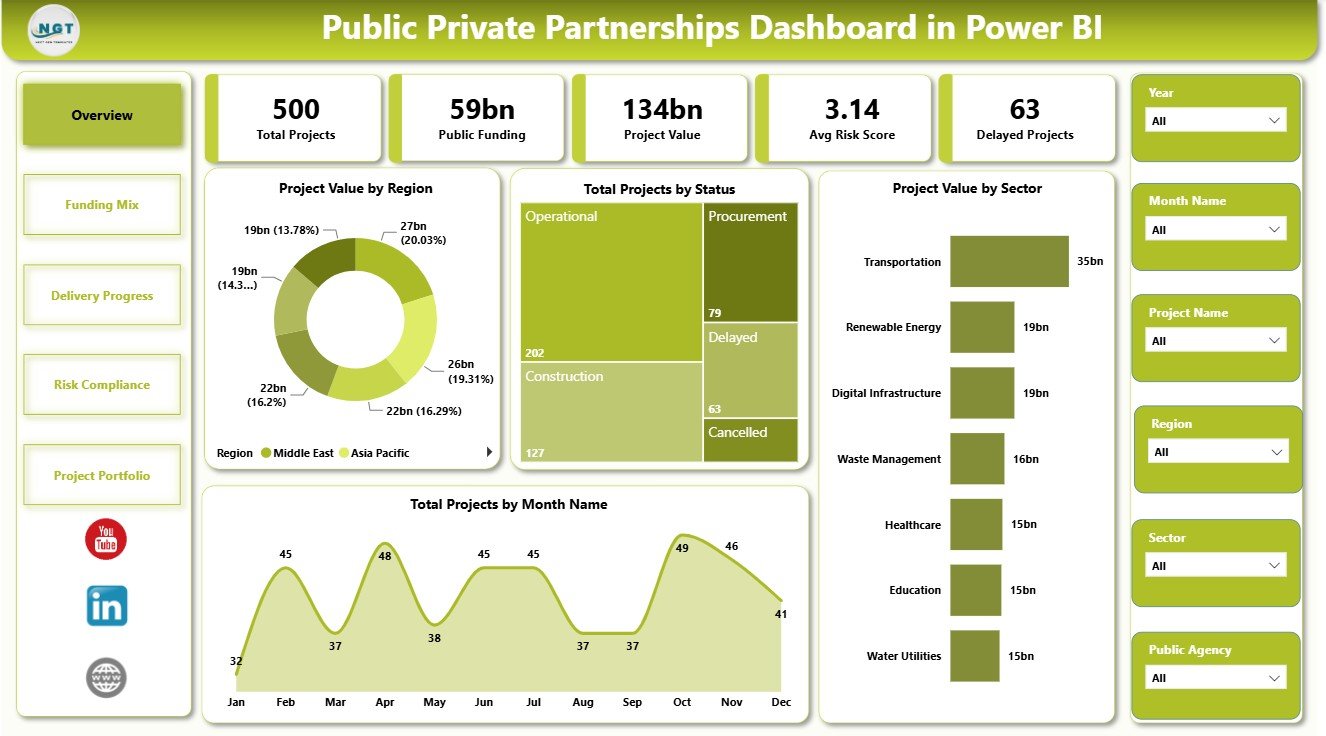
The Overview Page gives decision-makers a quick view of the PPP portfolio. The top cards show Total Projects, Public Funding, Project Value, Avg Risk Score, and Delayed Projects, so users can scan portfolio scale, funding exposure, and delivery risk before opening the detailed pages.
Project Value by Region: This chart compares PPP value across regions. It helps leaders identify where the largest project exposure sits and which geographic areas need closer review.
Total Projects by Status: This visual groups projects by delivery status. It helps teams see whether projects are active, delayed, completed, planned, or in another status group.
Project Value by Sector: This chart compares value across sectors such as transport, energy, health, education, utilities, or public services. It helps agencies understand which sectors dominate the PPP portfolio.
Total Projects by Month Name: This trend shows project count by month. It helps reviewers understand project timing, seasonality, and reporting concentration.
2 – Funding Mix
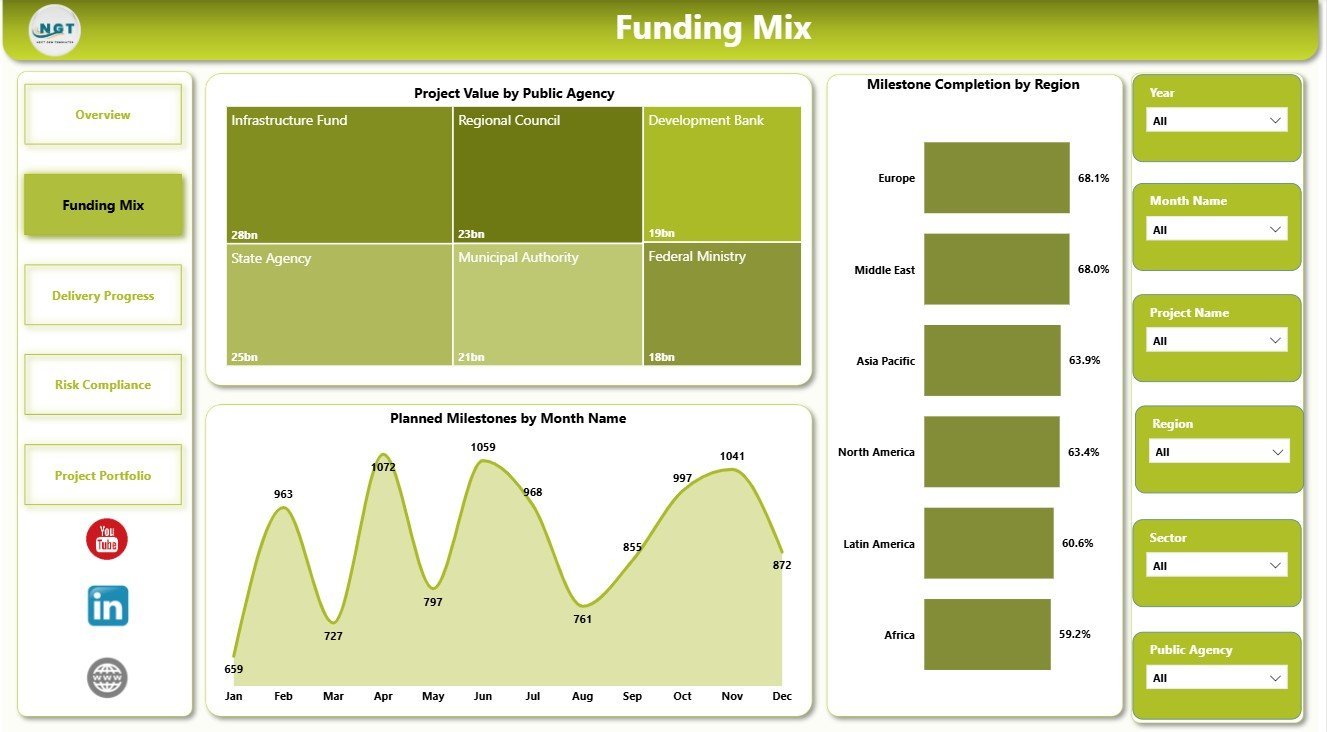
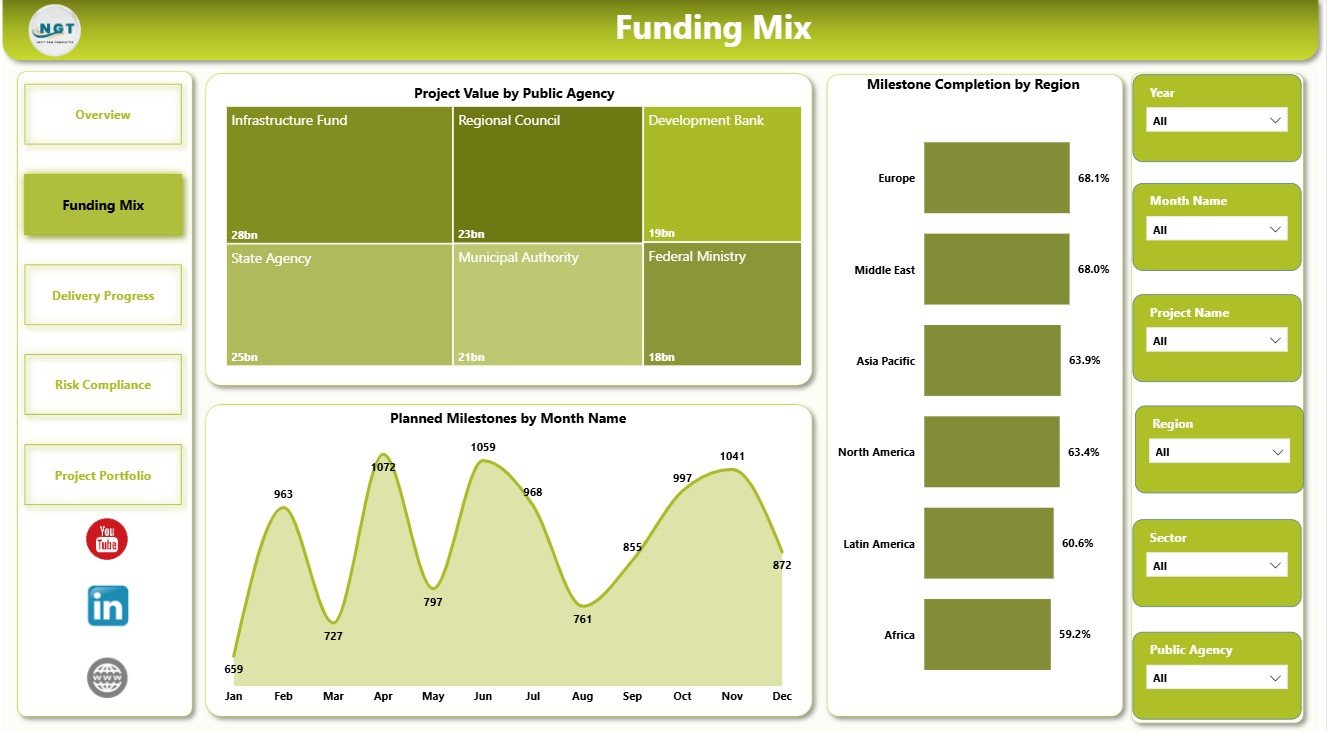
The Funding Mix page focuses on funding distribution and milestone planning. It helps public finance teams and PPP program leads compare agencies, months, and regional progress.
Project Value by Public Agency: This chart compares project value managed by each public agency. It helps identify agencies responsible for the largest financial commitments.
Planned Milestones by Month Name: This visual shows when upcoming milestones are planned. It helps teams prepare for peak delivery periods and milestone review meetings.
Milestone Completion by Region: This chart compares completion performance across regions. It helps show which regions are progressing well and which need follow-up.
3 – Delivery Progress
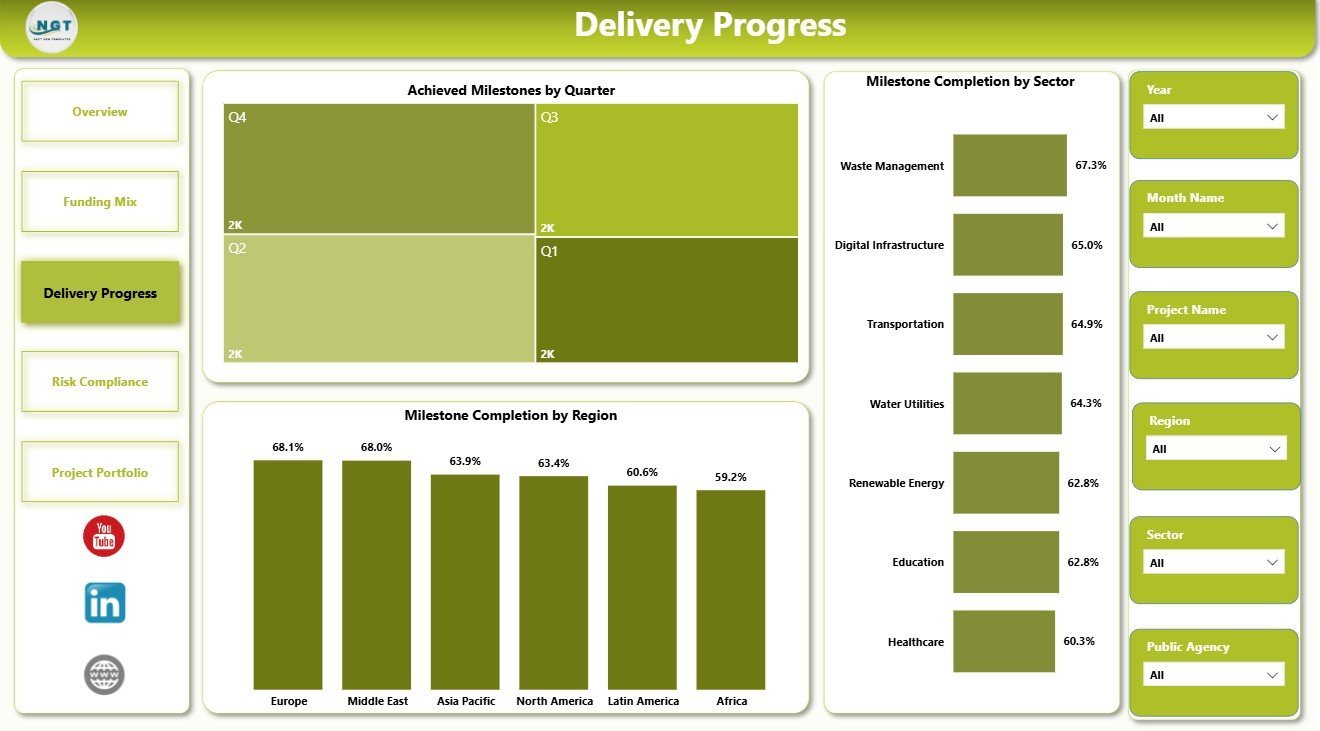
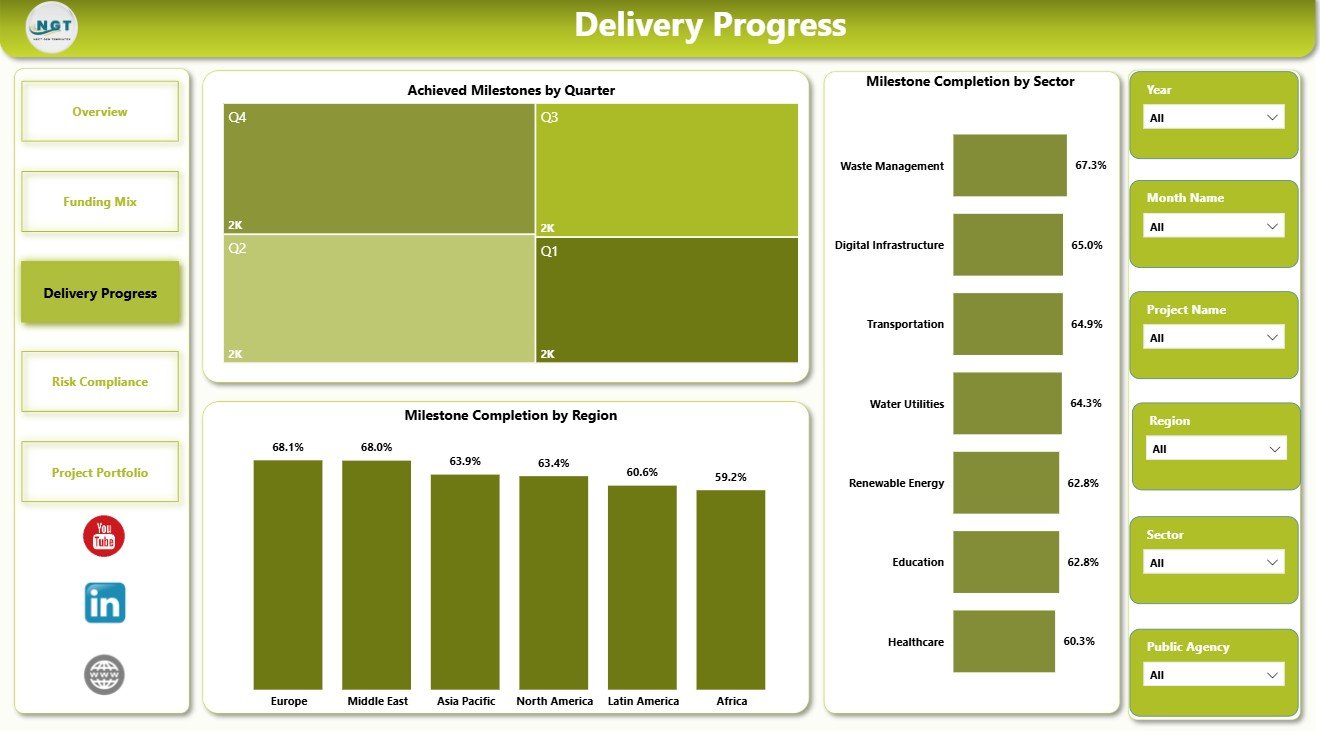
The Delivery Progress page is built for project review meetings. It focuses on achieved milestones and completion performance across quarters, regions, and sectors.
Achieved Milestones by Quarter: This chart shows delivery output by quarter. It helps management compare milestone achievement over time and spot slow periods.
Milestone Completion by Region: This visual compares completion progress by geography. It helps regional teams identify where execution is on track or falling behind.
Milestone Completion by Sector: This chart compares milestone performance by sector. It helps agencies understand whether certain PPP sectors have stronger or weaker delivery progress.
4 – Risk Compliance
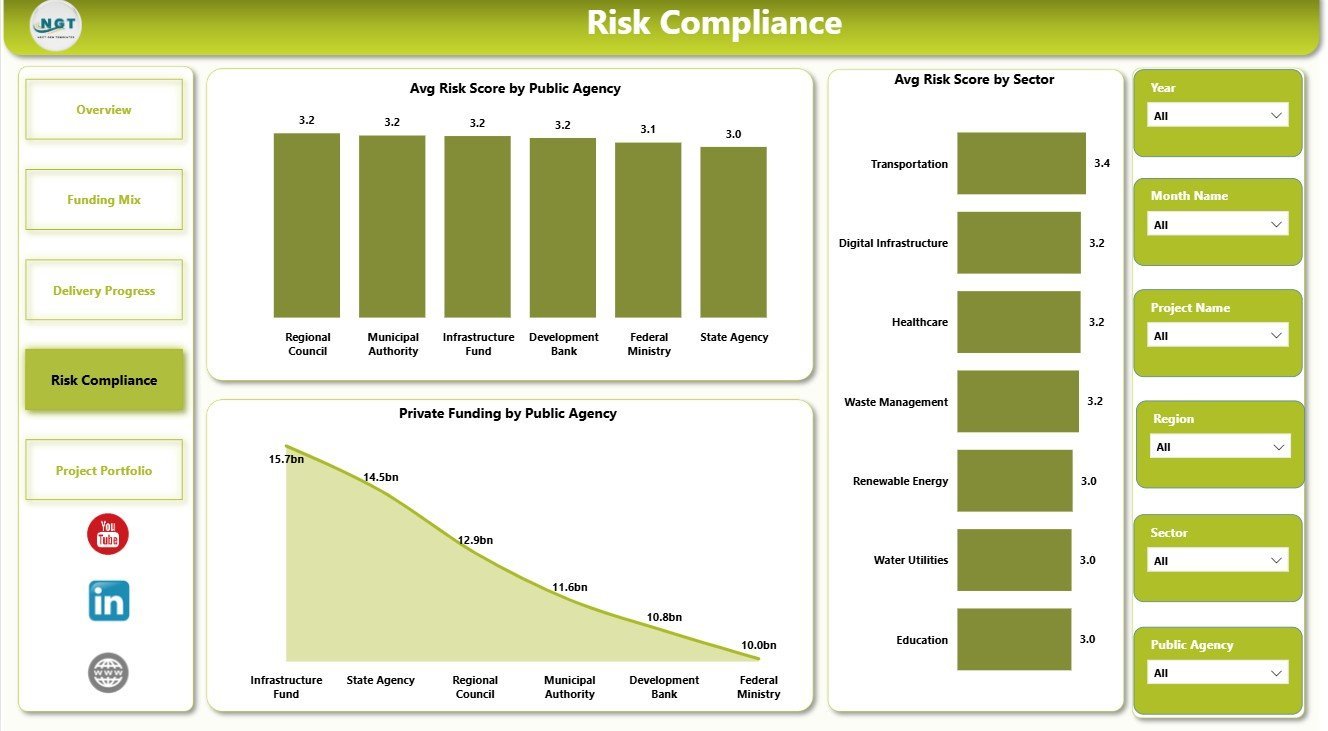
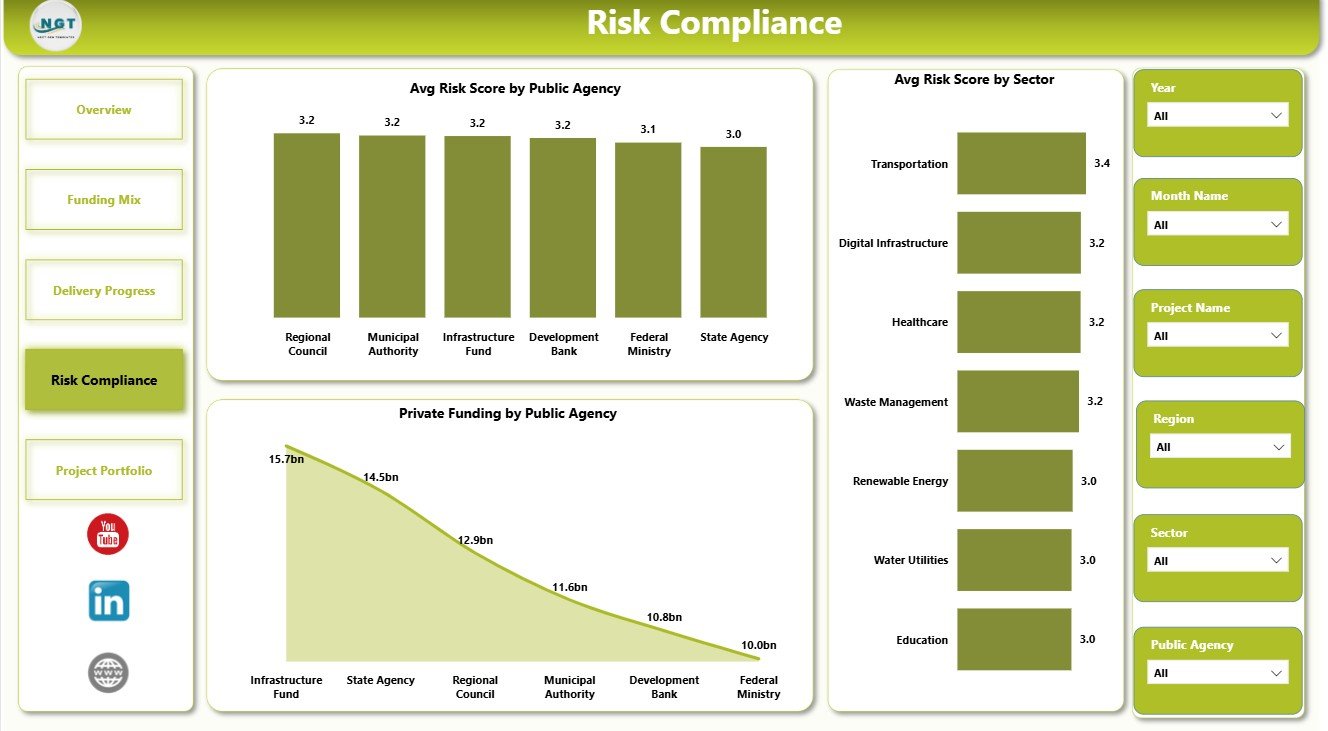
The Risk Compliance page helps PPP teams connect funding exposure with governance and risk performance. It is useful for audits, steering committees, and concession reviews.
Avg Risk Score by Public Agency: This chart compares risk score by agency. It helps reviewers see which agencies may need closer governance support.
Private Funding by Public Agency: This visual compares private funding by agency. It adds financial context to risk conversations and partner exposure.
Avg Risk Score by Sector: This chart compares risk levels across sectors. It helps users identify sectors where delivery, financial, or compliance risk may be higher.
5 – Project Portfolio
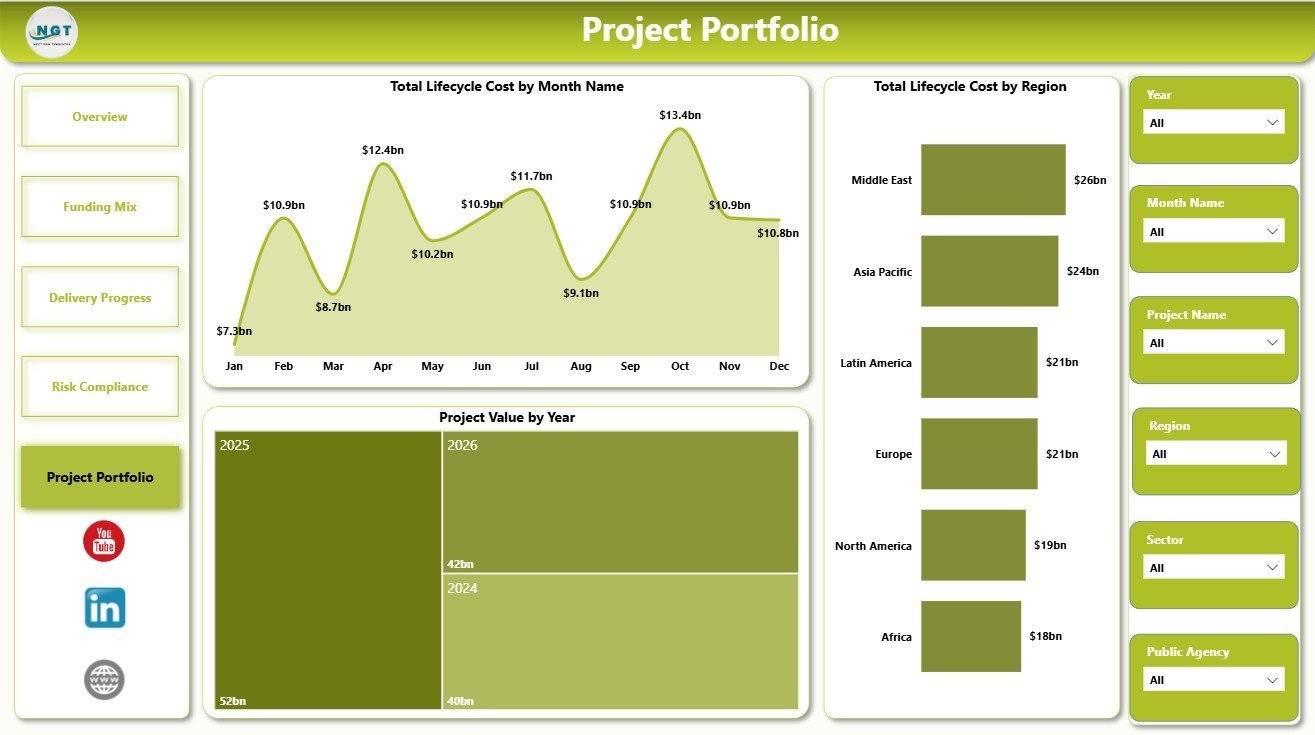
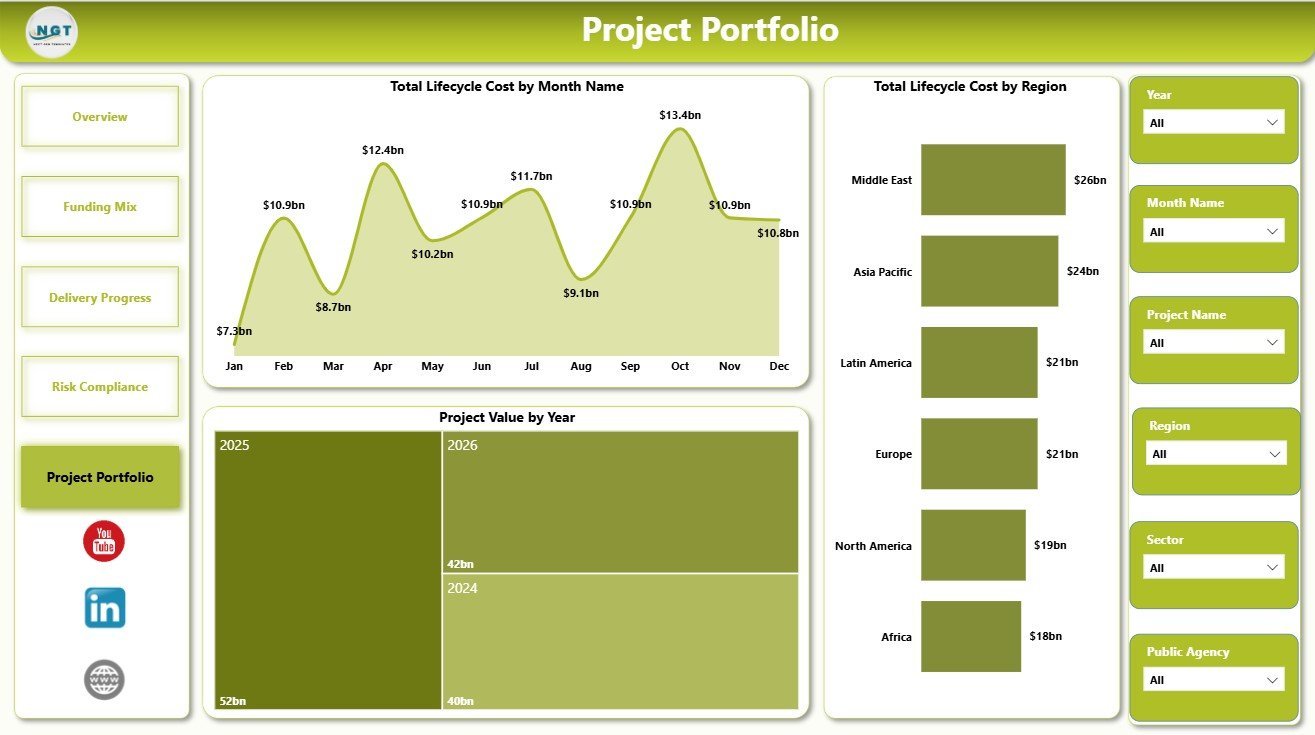
The Project Portfolio page supports long-range portfolio review. It helps leaders compare lifecycle cost, yearly project value, and regional cost exposure.
Total Lifecycle Cost by Month Name: This chart shows lifecycle cost by month. It helps teams review cost timing and identify periods with higher long-term cost pressure.
Project Value by Year: This visual compares project value by year. It helps leadership understand investment trends and prepare annual reporting.
Total Lifecycle Cost by Region: This chart compares lifecycle cost across regions. It helps agencies see where long-term PPP cost exposure is concentrated.
Public Private Partnerships Dashboard in Power BI vs. Tableau vs. Paid CRM/SaaS – Where This Fits
| Feature | This Power BI template | Tableau or Qlik alternative | Paid project SaaS |
|---|---|---|---|
| Cost | $17.99 one-time sale price | BI license plus report build time | Monthly or annual subscription |
| Platform | Power BI Desktop and optional Power BI Service | BI platform setup required | Vendor-hosted application |
| Setup time | Open PBIX, replace source, refresh | Build model, measures, and visuals | Onboarding and workflow configuration |
| Customizable fields | Edit visuals, measures, pages, fields, and data connections | Editable with BI skills | Often limited by plan and admin settings |
| Share with link | Available through Power BI Service when licensed | Available through cloud/server plans | Usually included |
| Year-1 cost at 5 users | Template cost plus Microsoft licensing choice | License cost plus analyst time | Often hundreds or thousands per year |
| PPP reporting fit | Best for portfolio reporting and management review | Best when your team already uses another BI stack | Best for live workflow and approvals |
Who This Template Is For – and Who It’s Not For
This template is for public private partnership units, government infrastructure agencies, public finance teams, concession authorities, PMOs, PPP consultants, and analysts who need a Power BI reporting layer for project value, funding, milestones, risk, and lifecycle cost.
It is not a contract management system, approval workflow, document repository, procurement portal, or live project execution app. If you need those controls, use this dashboard as the reporting layer above your operational systems.
How to Use the Public Private Partnerships Dashboard in Power BI
- Download and unzip the Power BI dashboard file.
- Open the PBIX file in Power BI Desktop.
- Replace or connect the sample data source with your PPP project data.
- Refresh the model and verify KPI cards, slicers, and charts.
- Use filters to review region, sector, public agency, status, month, quarter, and year.
- Customize visuals, measures, pages, colors, or relationships as needed.
Real-World Use Cases
Asha, PPP program director: Asha uses the Overview page before a monthly steering committee to explain total projects, public funding, project value, risk score, and delayed projects.
Rohan, public finance analyst: Rohan reviews the Funding Mix page to compare project value by agency and planned milestones by month before budget discussions.
Meera, infrastructure consultant: Meera uses the Risk Compliance and Project Portfolio pages to identify sectors and regions with high lifecycle cost or risk exposure.
Frequently Asked Questions
Do I need Power BI Desktop?
Yes. Power BI Desktop is required to open and edit the PBIX file. Power BI Service is optional for online sharing and scheduled refresh.
Can I use my own PPP project data?
Yes. Replace or connect the sample source with your structured project data, then refresh the report.
How many pages are included?
The dashboard includes 5 report pages: Overview, Funding Mix, Delivery Progress, Risk Compliance, and Project Portfolio.
What KPI cards are shown on the Overview page?
The Overview page includes Total Projects, Public Funding, Project Value, Avg Risk Score, and Delayed Projects.
Can I customize the report?
Yes. You can edit visuals, fields, slicers, measures, relationships, colors, and source connections in Power BI Desktop.
Does this replace PPP project management software?
No. It is an analytics dashboard template, not a workflow, procurement, contract, or document management system.
About the Author
Built by PK – Microsoft Certified Professional with 15+ years of Excel, Google Sheets, and Power BI experience. Founder of NextGenTemplates, reaching 300K+ subscribers across YouTube channels. Every template is hand-built and tested before release.
Explore Related Templates
- Risk Management Dashboard in Power BI
- Private Clubs Dashboard in Power BI
- Recycling Infrastructure KPI Dashboard in Power BI
- Power BI templates
- Power BI dashboard templates
Read the full Public Private Partnerships Dashboard in Power BI guide when you want a page-by-page walkthrough before purchase.
Watch the demo video:
Compatibility and Requirements
- Works in Power BI Desktop, which is free. Download it from Get Power BI Desktop.
- You open the PBIX file in Power BI Desktop and replace or connect the sample data with your own PPP project data.
- Power BI Service is optional and is only needed for online sharing and scheduled refresh.
More Questions About This Template
Is there an Excel version of this PPP dashboard?
Yes. See the Public Private Partnerships Dashboard in Excel.
Which risk measures does the dashboard show?
The Risk Compliance page shows average risk score by public agency and by sector, plus private funding by public agency. The Overview page also has an Avg Risk Score card and a Delayed Projects card.
Can I filter the dashboard by region or sector?
Yes. The report has slicers, so you can review the portfolio by region, sector, public agency, status, month, quarter and year.
Does the dashboard track lifecycle cost?
Yes. The Project Portfolio page shows total lifecycle cost by month and by region, and project value by year.
Related Public Sector and Power BI Templates
- Public Private Partnerships Dashboard in Excel: the same PPP topic in Excel
- Public Sector KPI Dashboard in Power BI: KPI view for public sector teams
- Public Safety Dashboard in Power BI: another public agency dashboard in Power BI
- Private Equity KPI Dashboard in Power BI: investment portfolio reporting
- Power BI Dashboard Mega Collection: 15 Power BI templates in one download
Browse all Power BI dashboard templates.


























Reviews
There are no reviews yet.