

Port contract management is one of the most critical and risk-sensitive functions in port operations. Ports manage high-value contracts across terminal operations, logistics, cargo handling, maintenance, dredging, security, and infrastructure services. Each contract carries financial commitments, performance obligations, renewal timelines, and vendor dependencies. When contract data is scattered across spreadsheets and static reports, teams lose visibility, renewals get delayed, and financial risks increase.
That is exactly where the Port Contract Management Dashboard in Power BI becomes an essential solution.
This ready-to-use Power BI dashboard transforms complex contract data into a centralized, interactive, and decision-ready analytics platform. It allows port authorities, contract managers, finance teams, and leadership to monitor contract value, revenue, cost, profit, vendor contribution, renewal exposure, and monthly trends from a single screen. Instead of reacting to issues after they occur, teams gain early visibility and act proactively.
Because it is built in Power BI, the dashboard delivers real-time insights, fast filtering, and drill-down analysis without relying on manual reporting.
✨ Key Features of the Port Contract Management Dashboard in Power BI
📊 Centralized Contract KPIs
Track total contracts, contract value, actual cost, revenue, and profit in one executive-level view.
💰 Strong Financial Visibility
Monitor revenue, cost, and profit trends across ports, vendors, and contract types to reduce financial leakage.
🔁 Renewal & Lifecycle Monitoring
Identify active, under-renewal, expired, and closed contracts early to avoid service disruption.
🤝 Vendor & Contractor Performance Insights
Analyze vendor contribution, dependency, and revenue concentration to improve negotiation and governance.
📅 Monthly Trend & Forecasting Support
Understand how contracts evolve month by month and support better planning and budgeting.
📦 What’s Inside the Port Contract Management Dashboard in Power BI
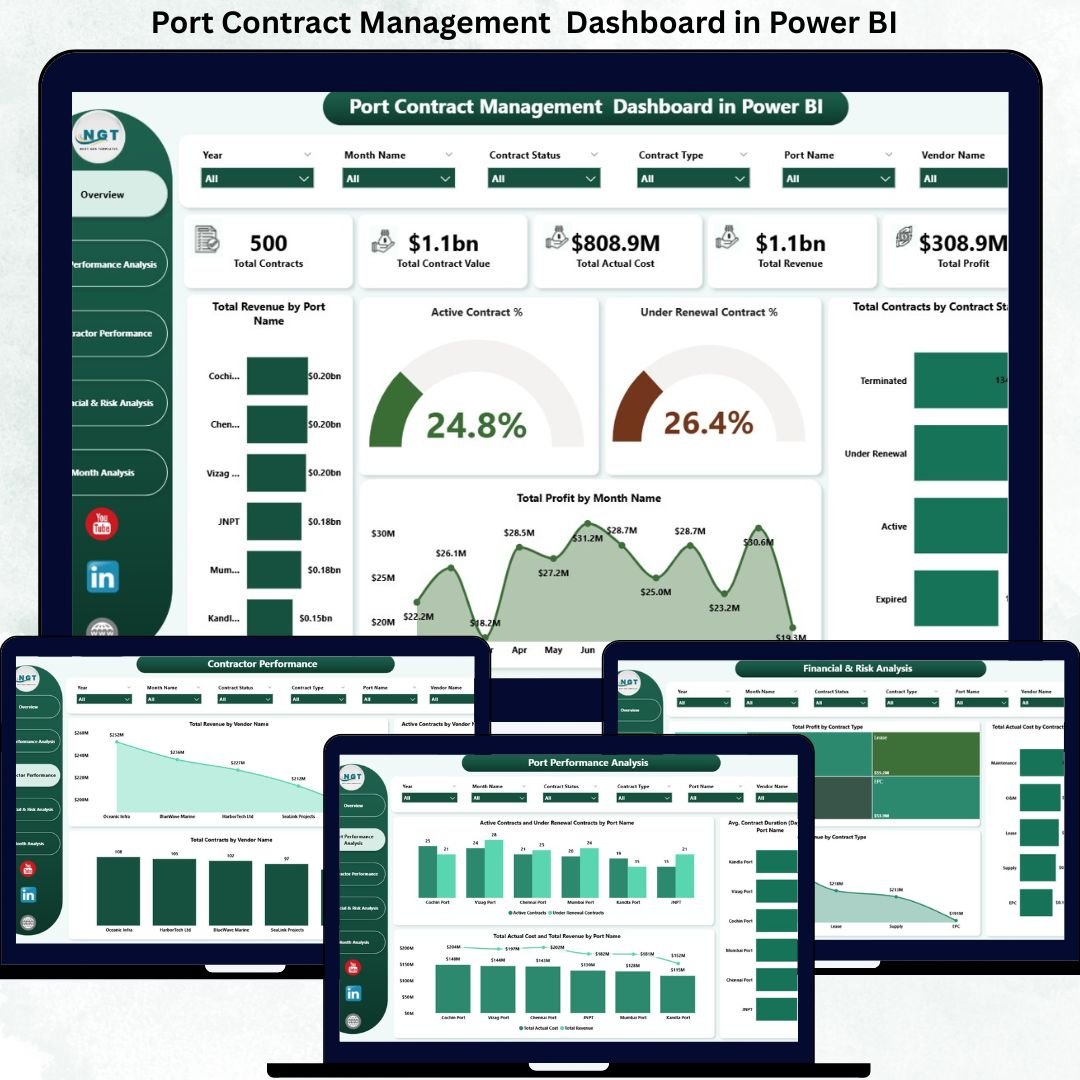
🖥️ Overview Section – Executive Snapshot
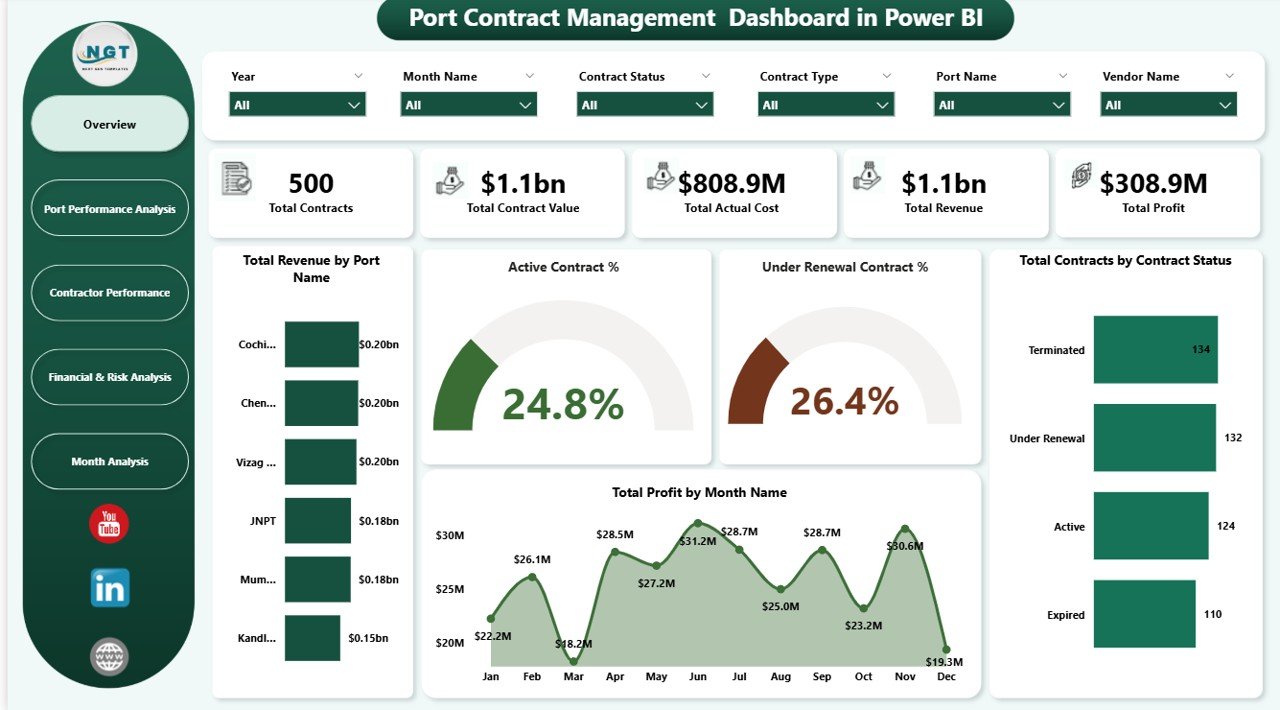
The Overview page acts as the command center of the dashboard and provides instant clarity on overall contract health.
KPI Cards Included
Total Contracts – Number of contracts under management
Total Contract Value – Combined value of all contracts
Total Actual Cost – Cost incurred across contracts
Total Revenue – Revenue generated from contracts
Total Profit – Net profit after cost deduction
Overview Charts
Total Revenue by Port Name – Identifies high-performing ports
Active Contract % – Measures operational continuity
Under Renewal Contract % – Highlights renewal risk
Total Contracts by Contract Status – Active, Under Renewal, Expired, Closed
Total Profit by Month Name – Tracks profitability trends
These visuals allow leadership to assess financial and operational performance in seconds.
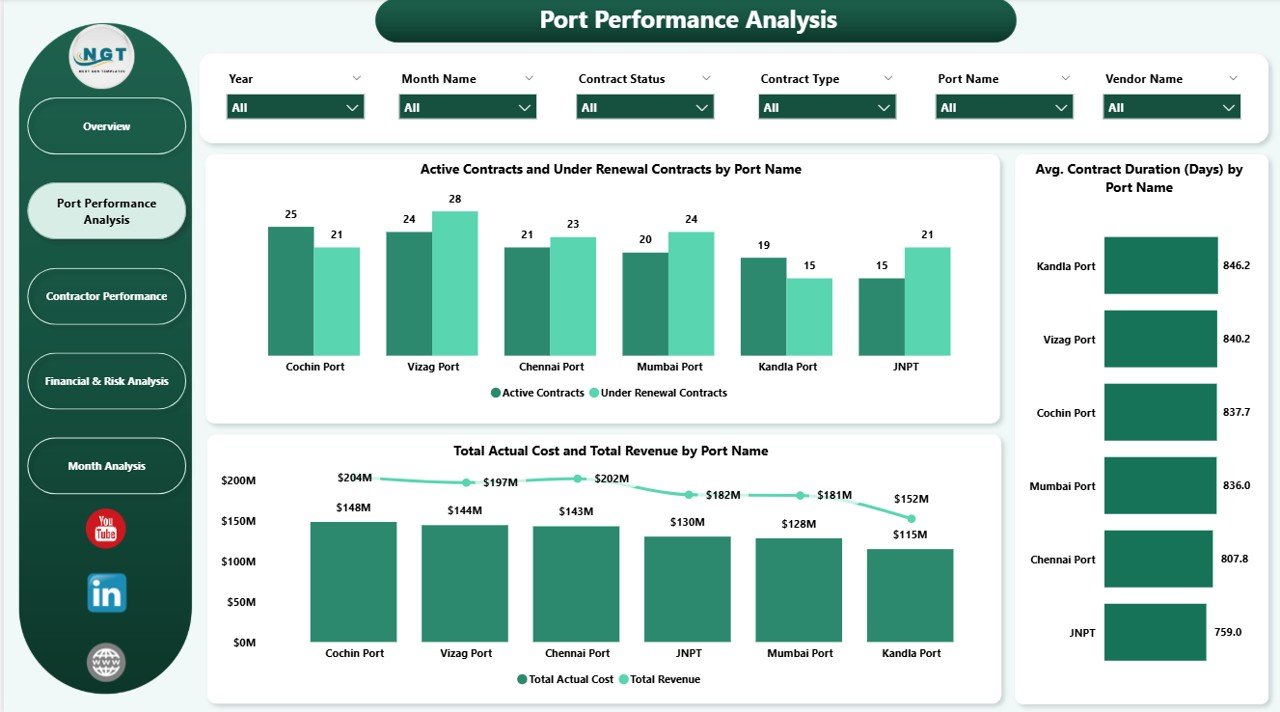
⚓ Port Performance Analysis
This section evaluates contract performance at the port level.
Charts Included
Active vs Under Renewal Contracts by Port Name – Supports renewal prioritization
Total Actual Cost vs Total Revenue by Port Name – Highlights cost efficiency
Average Contract Duration (Days) by Port Name – Measures long-term engagement
This analysis helps ports optimize contract strategies and improve profitability by location.
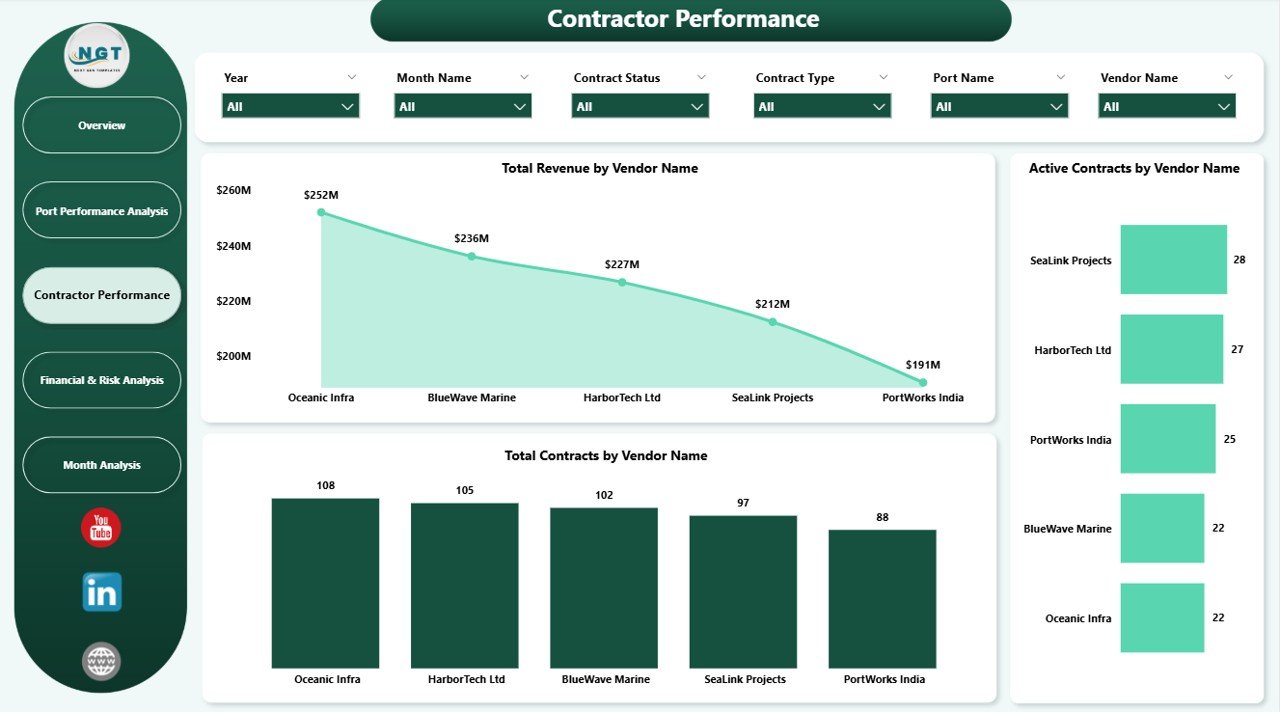
🏗️ Contractor Performance Analysis
Vendors play a major role in service quality and financial outcomes.
Charts Included
Total Revenue by Vendor Name – Identifies top revenue-contributing vendors
Total Contracts by Vendor Name – Highlights dependency and concentration risk
These insights help ports strengthen vendor oversight, reduce over-dependency, and improve contract negotiations.
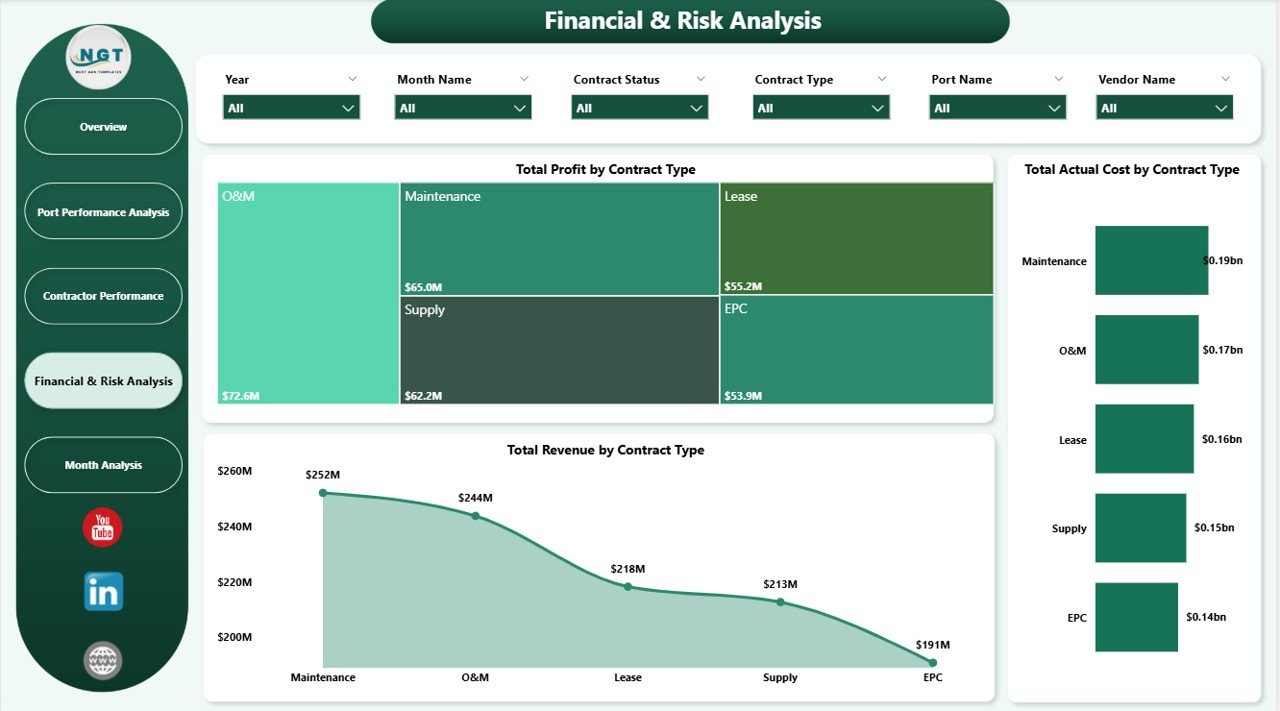
💰 Financial & Risk Analysis
This section focuses on profitability and exposure across contract types.
Charts Included
Total Profit by Contract Type – Highlights high-margin contracts
Total Actual Cost by Contract Type – Identifies cost-heavy contracts
Total Revenue by Contract Type – Aligns revenue strategy with contract mix
Finance and risk teams use this analysis to control exposure and optimize the contract portfolio.
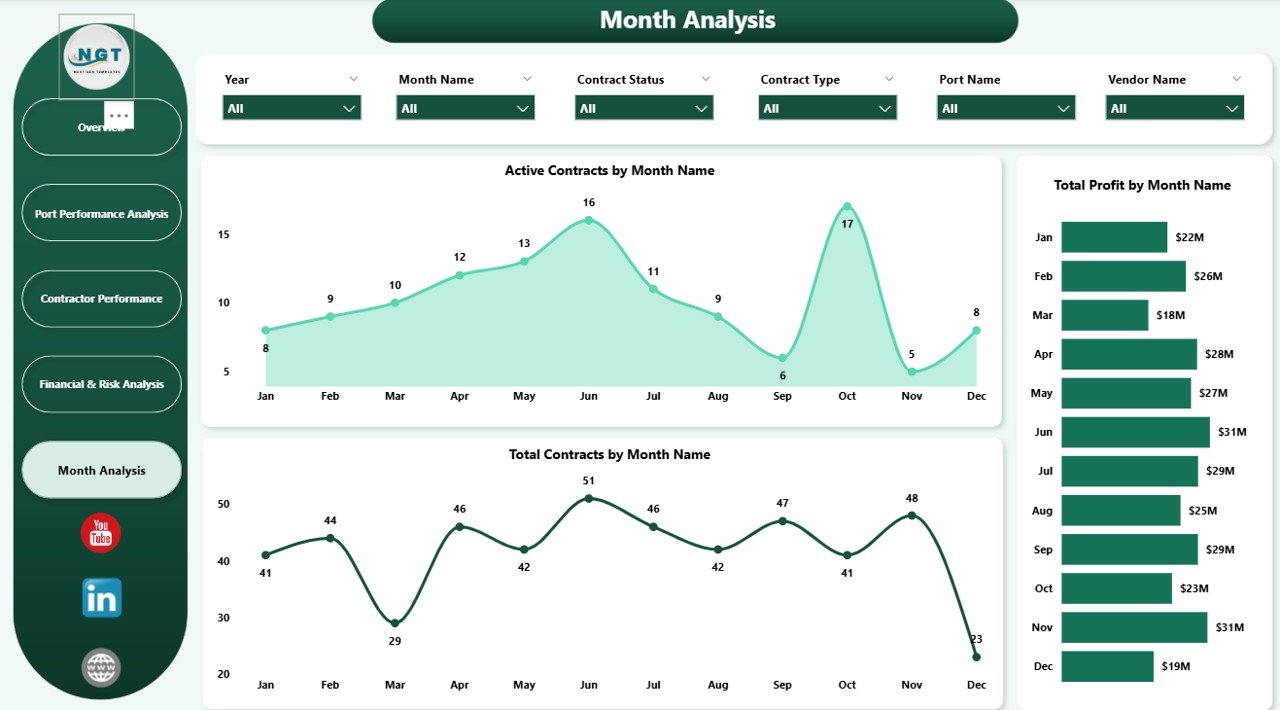
📅 Monthly Analysis – Contract Trends Over Time
Monthly trends provide clarity on contract evolution.
Charts Included
Active Contracts by Month Name
Total Contracts by Month Name
Total Profit by Month Name
These trends support forecasting, budgeting, and capacity planning.
🎯 Who Can Benefit from This Port Contract Management Dashboard
⚓ Port Authorities – Gain transparency and financial control
📊 Contract Management Teams – Track lifecycle and renewals
💼 Finance & Accounting Teams – Monitor cost, revenue, and profit
🏗️ Operations Managers – Improve service continuity
🧠 Executive Leadership – Make faster, data-backed decisions
### Click here to read the Detailed blog post
Watch the step-by-step video tutorial:






























Reviews
There are no reviews yet.