

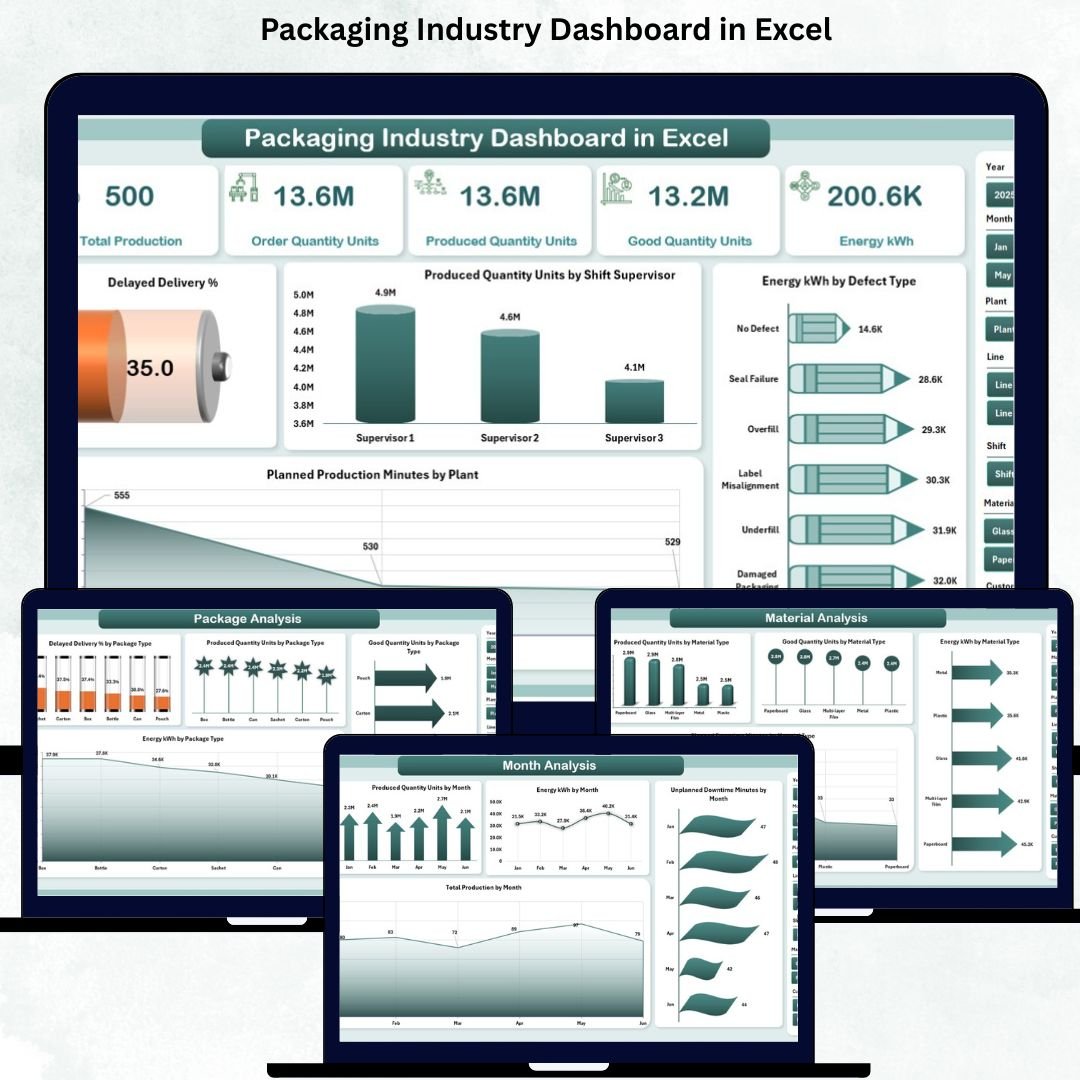

The packaging industry runs on speed, accuracy, and continuous production. Every day, packaging lines manage thousands of units, track multiple materials, monitor quality, analyze downtime, and ensure timely deliveries. Without a centralized system, teams spend hours preparing reports, cross-checking data, and trying to understand performance. This slows down decision-making—and delays directly impact cost, productivity, and customer satisfaction.
A Packaging Industry Dashboard in Excel solves this challenge instantly. It brings all major KPIs into one smart, interactive, and ready-to-use dashboard. Whether you manage plastic packaging, paper packaging, cartons, boxes, corrugated sheets, bottles, or pouches—this dashboard gives you full visibility of your production and quality performance. With slicers, automated charts, and dynamic formulas, the dashboard updates instantly whenever you enter new data.
Designed for supervisors, plant managers, quality engineers, and operations teams, the dashboard helps you take faster actions, reduce delays, improve material planning, and track your overall packaging performance clearly and confidently.
📦 Key Features of the Packaging Industry Dashboard in Excel
This dashboard includes five highly useful analysis pages, plus support sheets for smooth calculation. Everything is structured, automated, and beginner-friendly.
✔ Left-side Page Navigator for quick movement
✔ Right-side Slicers for month, plant, supervisor, category, and material
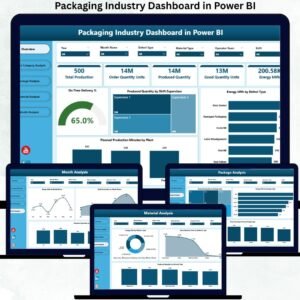
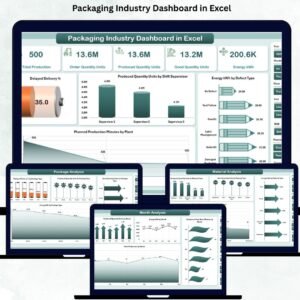
✔ 5 KPI Cards showing total production, good quantity, delays, energy, and downtime
✔ Automated Charts with instant filtering
✔ Support Sheets for lookup values
✔ Data Entry Sheet for daily updates
✔ 100% Excel-based—no macros or coding required
📊 What’s Inside the Packaging Industry Dashboard in Excel?
Below is a breakdown of every page included in the dashboard.
⭐ Overview Page – Complete Performance Snapshot
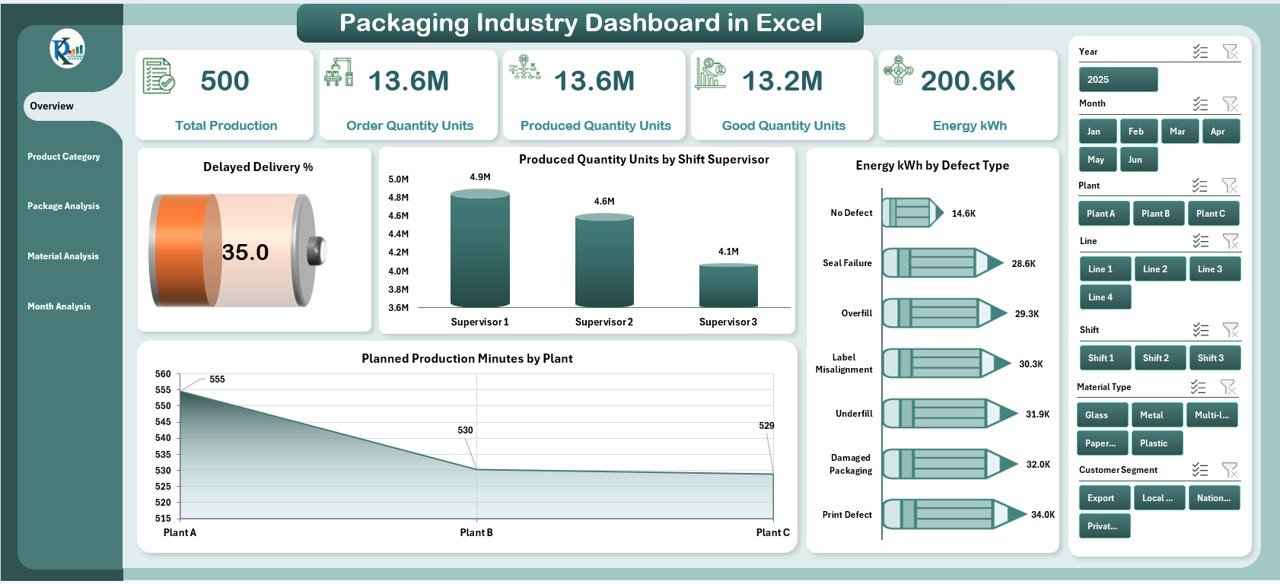
The Overview Page is the home screen where you see the entire operation at a glance. It includes slicers on the right to filter by:
Month
Plant
Material type
Supervisor
Product category
KPI Cards Show:
📦 Total Production
✅ Good Quantity
🚚 Delayed Deliveries
⚡ Energy Consumption
⏱️ Downtime Overview
Key Charts:
Delayed Delivery %
Produced Quantity by Shift Supervisor
Energy (kWh) by Defect Type
Planned Production Minutes by Plant
This page helps managers understand the current performance immediately.
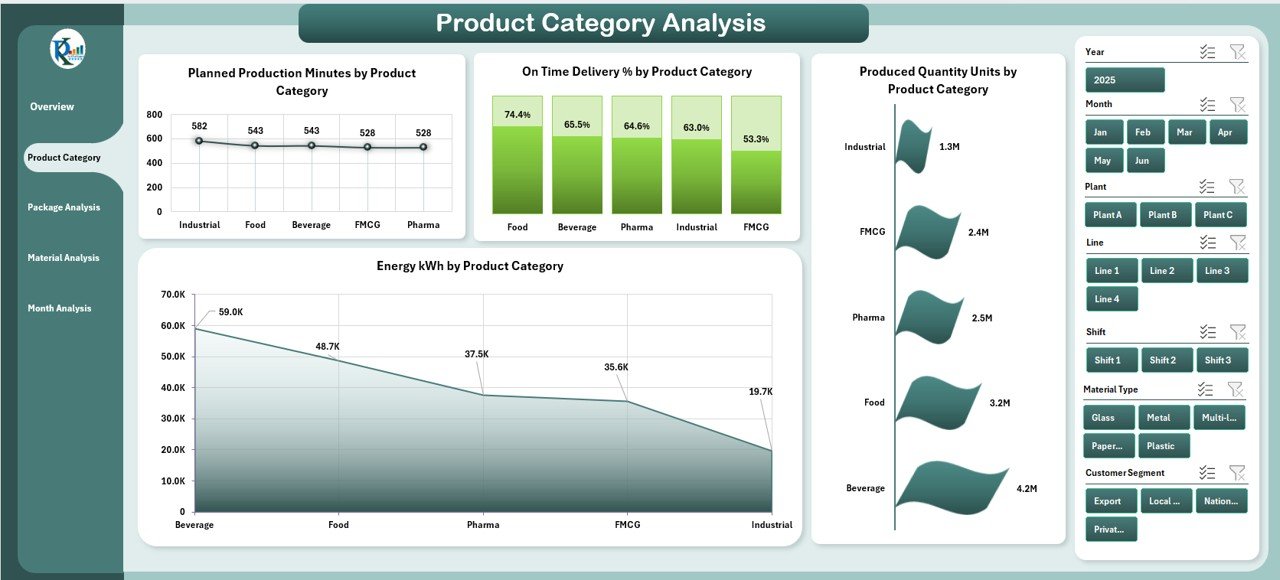
⭐ Product Category Analysis – Understand Category Performance
Every packaging company handles multiple categories. This page shows how each category affects production, quality, and energy.
Charts Include:
Planned Production Minutes by Category
On-Time Delivery % by Category
Produced Quantity by Category
Energy Consumption by Category
You can instantly identify top-performing and low-performing categories.
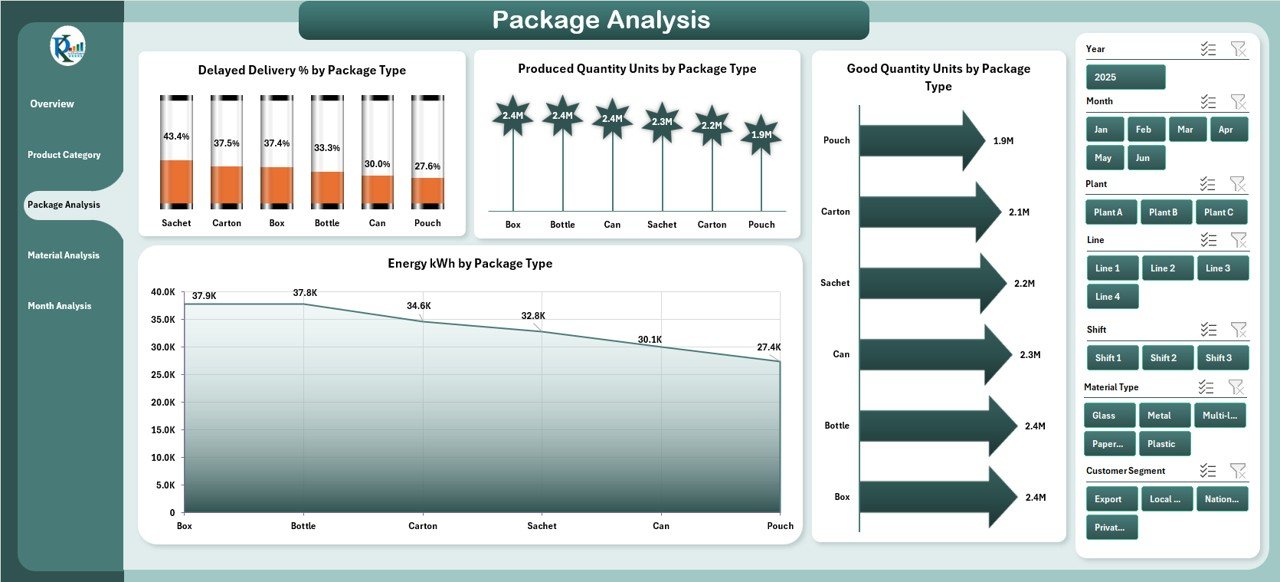
⭐ Package Type Analysis – Compare Packaging Formats
Packaging plants manufacture a variety of product types. This page highlights the performance of each type clearly.
Charts Include:
Delayed Delivery % by Package Type
Produced Quantity by Package Type
Good Quantity by Package Type
Energy Consumption by Package Type
This helps managers plan packaging lines better based on product type demand.
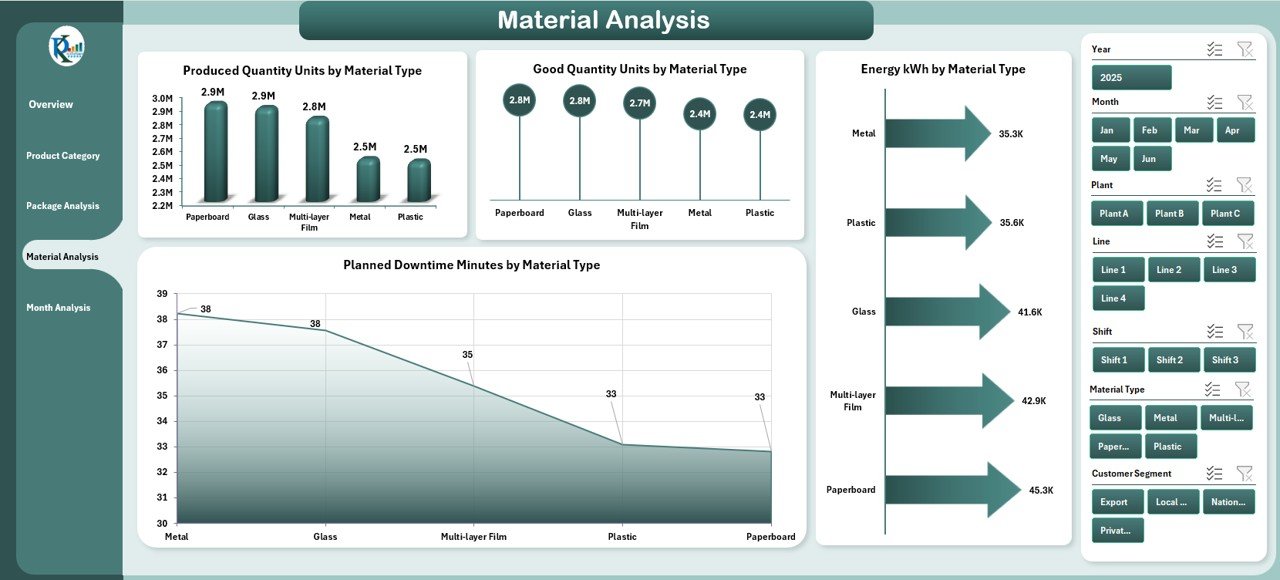
⭐ Material Analysis – Identify Material Efficiency & Waste
Materials impact cost, downtime, energy usage, and quality. This page shows:
Produced Quantity by Material Type
Good Quantity by Material Type
Energy kWh by Material Type
Planned Downtime Minutes by Material Type
This helps identify materials that cause more issues or require process adjustments.
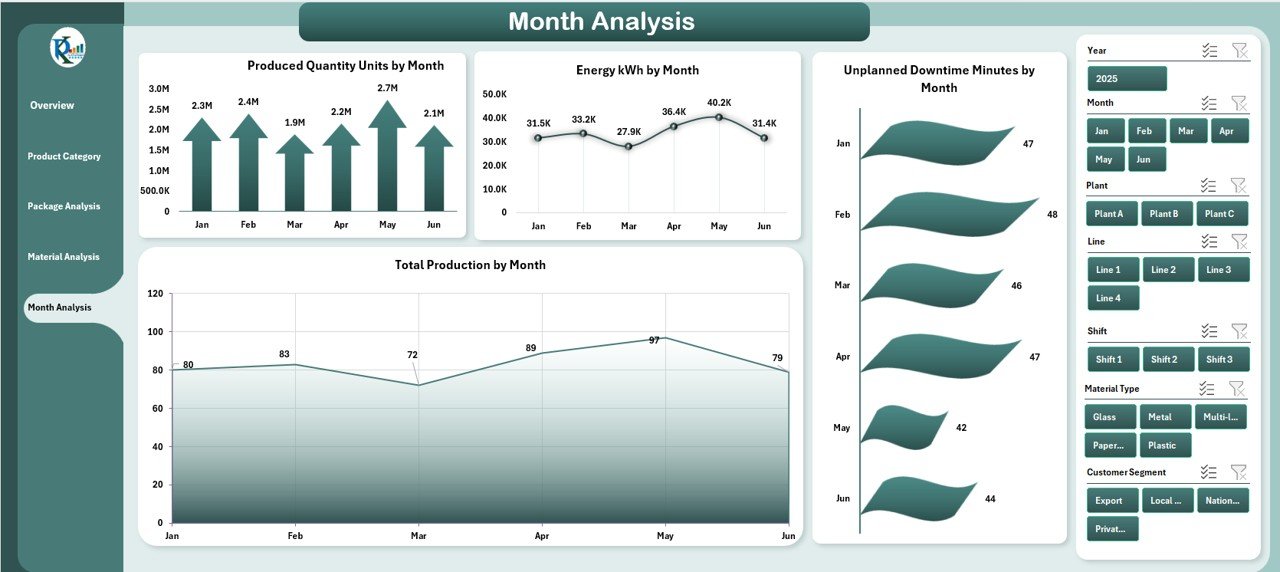
⭐ Month Analysis – Track Monthly & Seasonal Trends
This page is perfect for performance reviews, budget planning, and seasonal forecasting.
Charts Include:
Produced Quantity by Month
Energy Usage by Month
Unplanned Downtime Minutes by Month
Total Production by Month
This helps leaders compare month-wise productivity and resource usage.
👥 Who Can Benefit from This Dashboard?
Plant Managers
Packaging Supervisors
Quality Managers
Production Teams
Industrial Engineers
Maintenance Teams
Operations & Supply Chain Managers
Manufacturing Directors
Anyone who needs fast insights into packaging performance will find this dashboard extremely valuable.
🧭 How to Use the Packaging Dashboard
Enter production, energy, material, and downtime data in the Data Sheet
Use slicers to filter by plant, month, material, or category
Review KPI cards and charts for quick insights
Compare monthly and category-wise trends
Track delayed deliveries and quality issues
Use insights for planning and process improvement
### Click here to read the Detailed Blog Post
📺 Visit our YouTube channel to learn step-by-step video tutorials
👉 https://youtube.com/@PKAnExcelExpert
Watch the step-by-step video tutorial:
Compatibility and Requirements
- Works in Microsoft Excel desktop (Excel 2016 or later, or Microsoft 365).
- The dashboard uses slicers for month, plant, supervisor, category and material. Microsoft explains them in Use slicers to filter data.
Frequently Asked Questions
Which analysis pages are included?
Five pages: Overview, Product Category Analysis, Package Type Analysis, Material Analysis and Month Analysis. Support sheets and a data entry sheet sit behind them.
Which KPIs show on the Overview page?
Five KPI cards: Total Production, Good Quantity, Delayed Deliveries, Energy Consumption and Downtime Overview.
How do I update the dashboard?
Enter your production, energy, material and downtime data in the data sheet. The charts and KPI cards update from it, and you can filter them with the slicers.
Can I filter by plant, material or supervisor?
Yes. The slicers on the right side filter by month, plant, material type, supervisor and product category.
Is there a Power BI or KPI-focused version?
Yes. See the Packaging Industry Dashboard in Power BI and the Packaging Industry KPI Dashboard in Excel.
Related Packaging and Manufacturing Templates
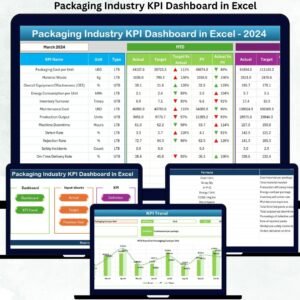
- Packaging Industry KPI Dashboard in Excel: a KPI-focused view for packaging
- Packaging Industry Dashboard in Power BI: the Power BI edition
- Packaging Sustainability KPI Dashboard in Excel: tracks sustainability metrics for packaging
- Food Packaging KPI Dashboard in Excel: a dashboard for food packaging lines
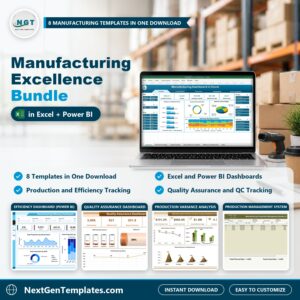
- Manufacturing Excellence Bundle: 8 Excel and Power BI templates for manufacturing in one download
Browse all Excel dashboards or Manufacturing templates.























Reviews
There are no reviews yet.