

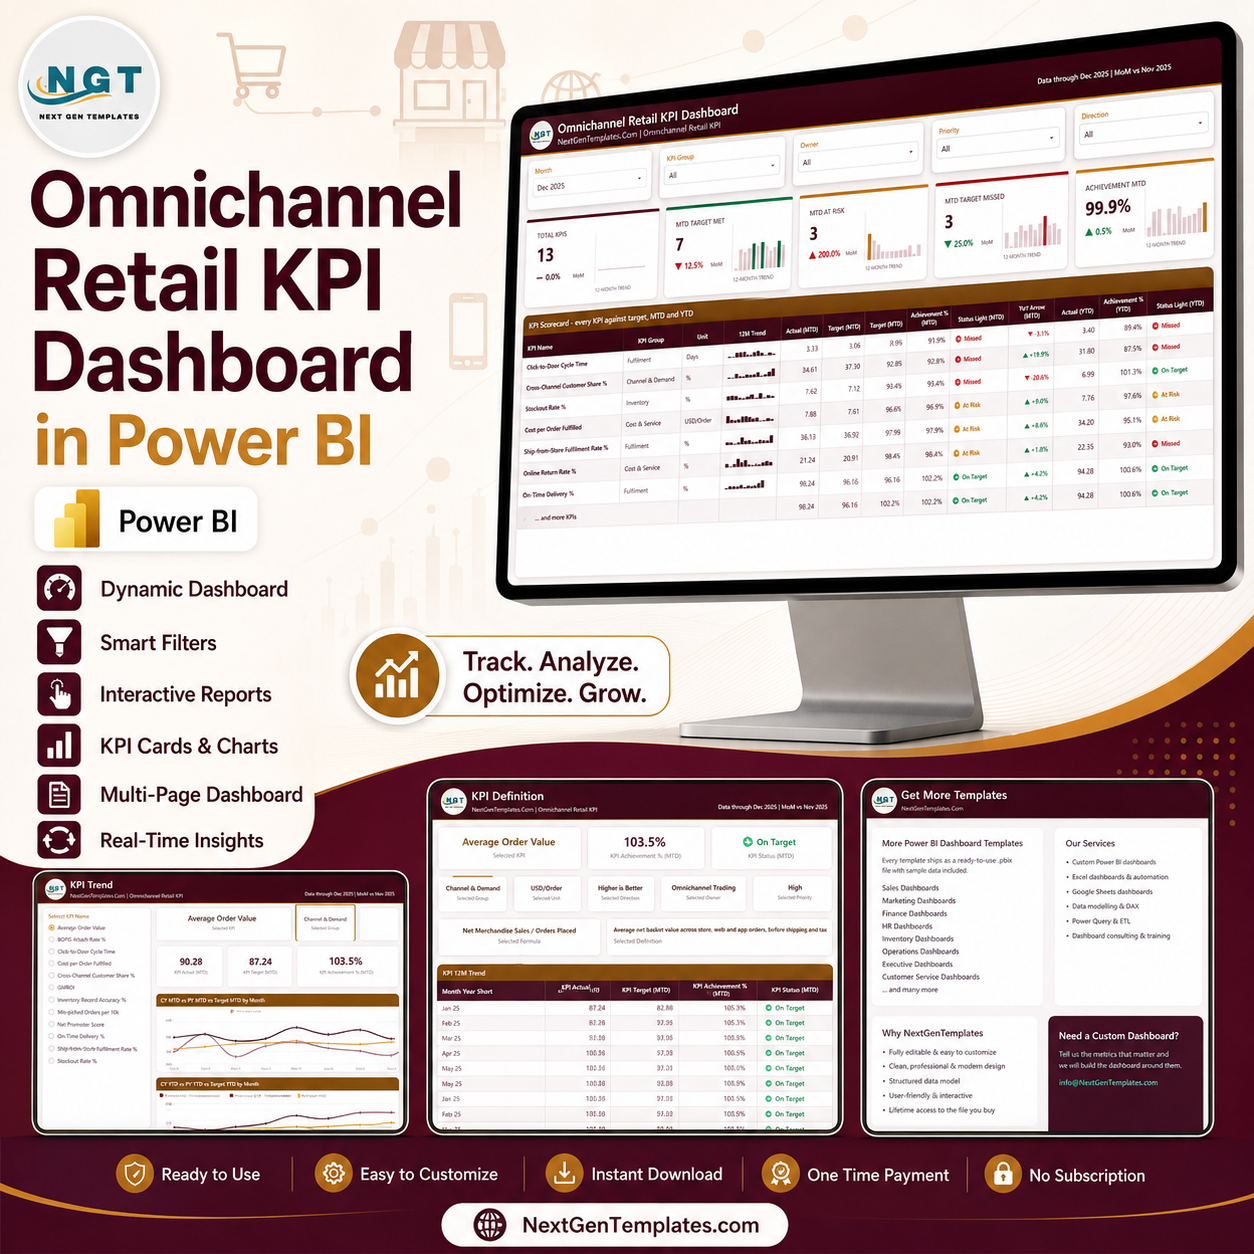
13 retail KPIs. 12 months of MTD and YTD comparisons. 5 slicers. 3 analysis pages plus a built-in resources page. The Omnichannel Retail KPI Dashboard in Power BI is a ready-to-use scorecard for teams that need one view of store, web, app, fulfilment, inventory, cost, and customer-experience performance. Replace the sample values in the included Excel data pack, refresh the PBIX, and compare actuals with your own targets and prior-year results. There is no subscription and no locked SaaS workflow: you receive the editable Power BI file, source workbook, and user manual. The sample figures are demonstration data, not retail benchmarks or recommendations.
Key Features of Omnichannel Retail KPI Dashboard in Power BI
- 13 editable KPIs: BOPIS Attach Rate, Cross-Channel Customer Share, Average Order Value, Ship-from-Store Fulfilment Rate, On-Time Delivery, Mis-picked Orders per 10k, Click-to-Door Cycle Time, Inventory Record Accuracy, Stockout Rate, GMROI, Cost per Order Fulfilled, Online Return Rate, and Net Promoter Score.
- Direction-aware scoring: higher-is-better and lower-is-better KPIs are evaluated correctly against the target.
- MTD and YTD views: compare current actuals, targets, prior-year values, achievement percentages, and status lights.
- Five report slicers: Month, KPI Group, Owner, Priority, and Direction.
- 12-month context: sparklines and full trend charts reveal movement that a single status card cannot show.
- Editable source pack: add, rename, or remove KPIs by updating KPI Definition, Input_ Target, and Input_ Actual sheets, then refresh.
- Native Power BI experience: interactive selection, synced KPI filtering, report-page tooltips, and editable visuals.
- Documented handover: the ZIP contains the PBIX, Data.xlsx, and a PDF user manual.
What’s Inside the Omnichannel Retail KPI Dashboard in Power BI
KPI Scorecard Page
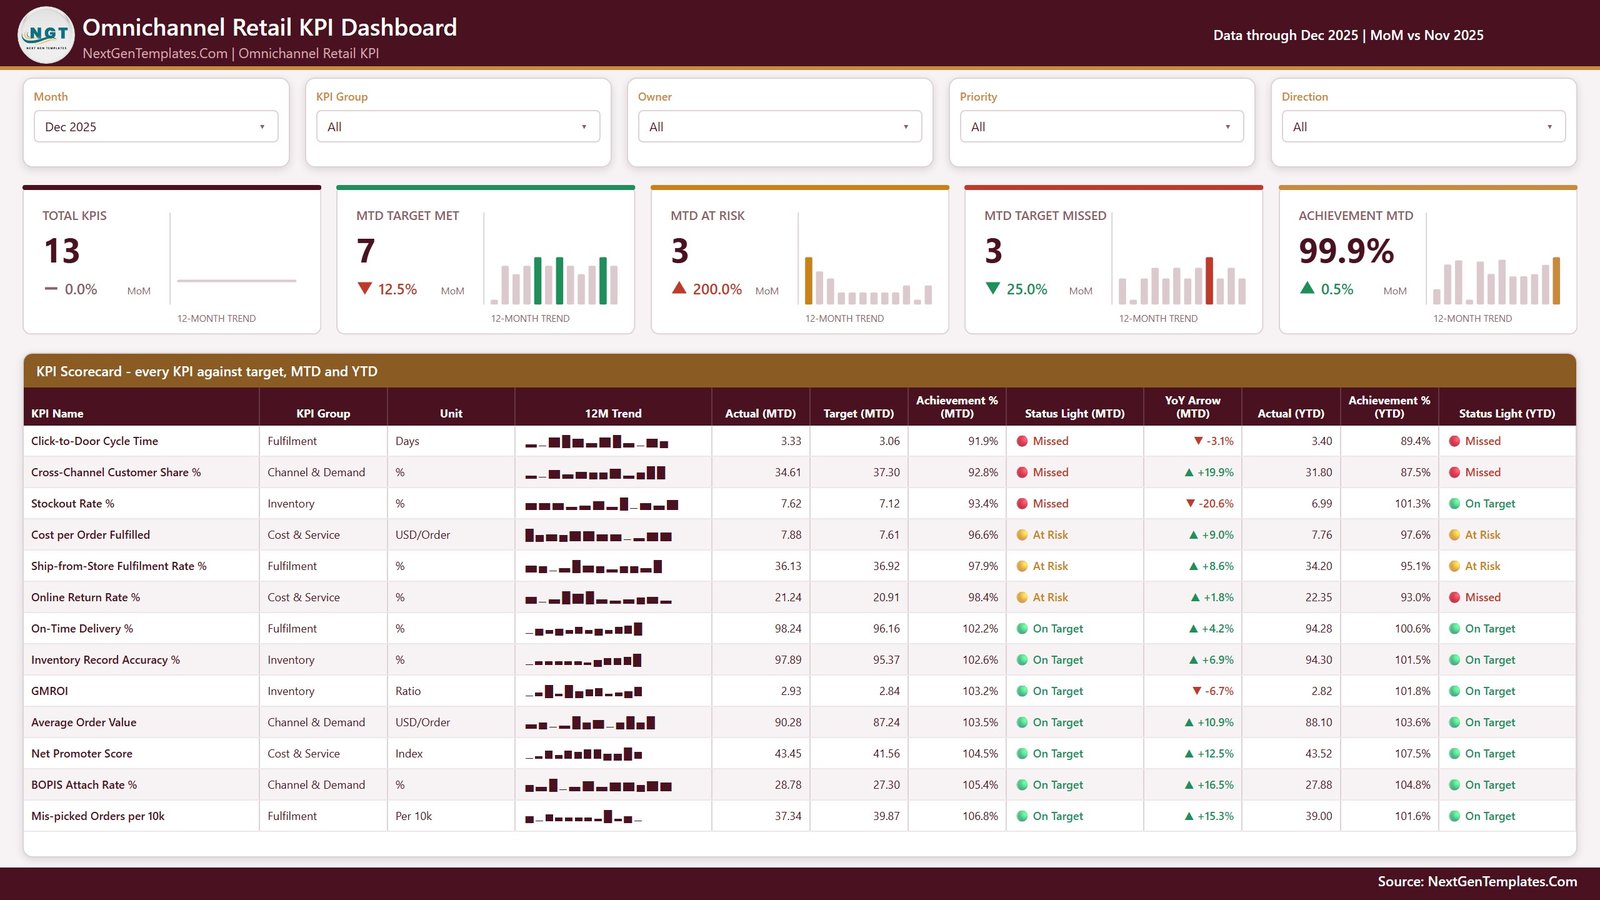
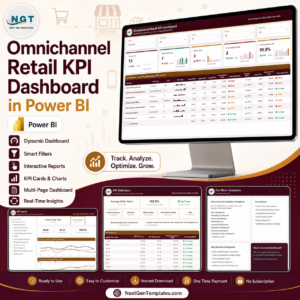
The main scorecard places all 13 KPIs in one table with KPI group, unit, 12-month trend, MTD actual and target, MTD achievement, MTD status, year-over-year movement, YTD actual, YTD achievement, and YTD status. Summary cards count total KPIs, target met, at risk, and target missed, while the Achievement MTD card gives an overall direction-aware view.
KPI Trend Page
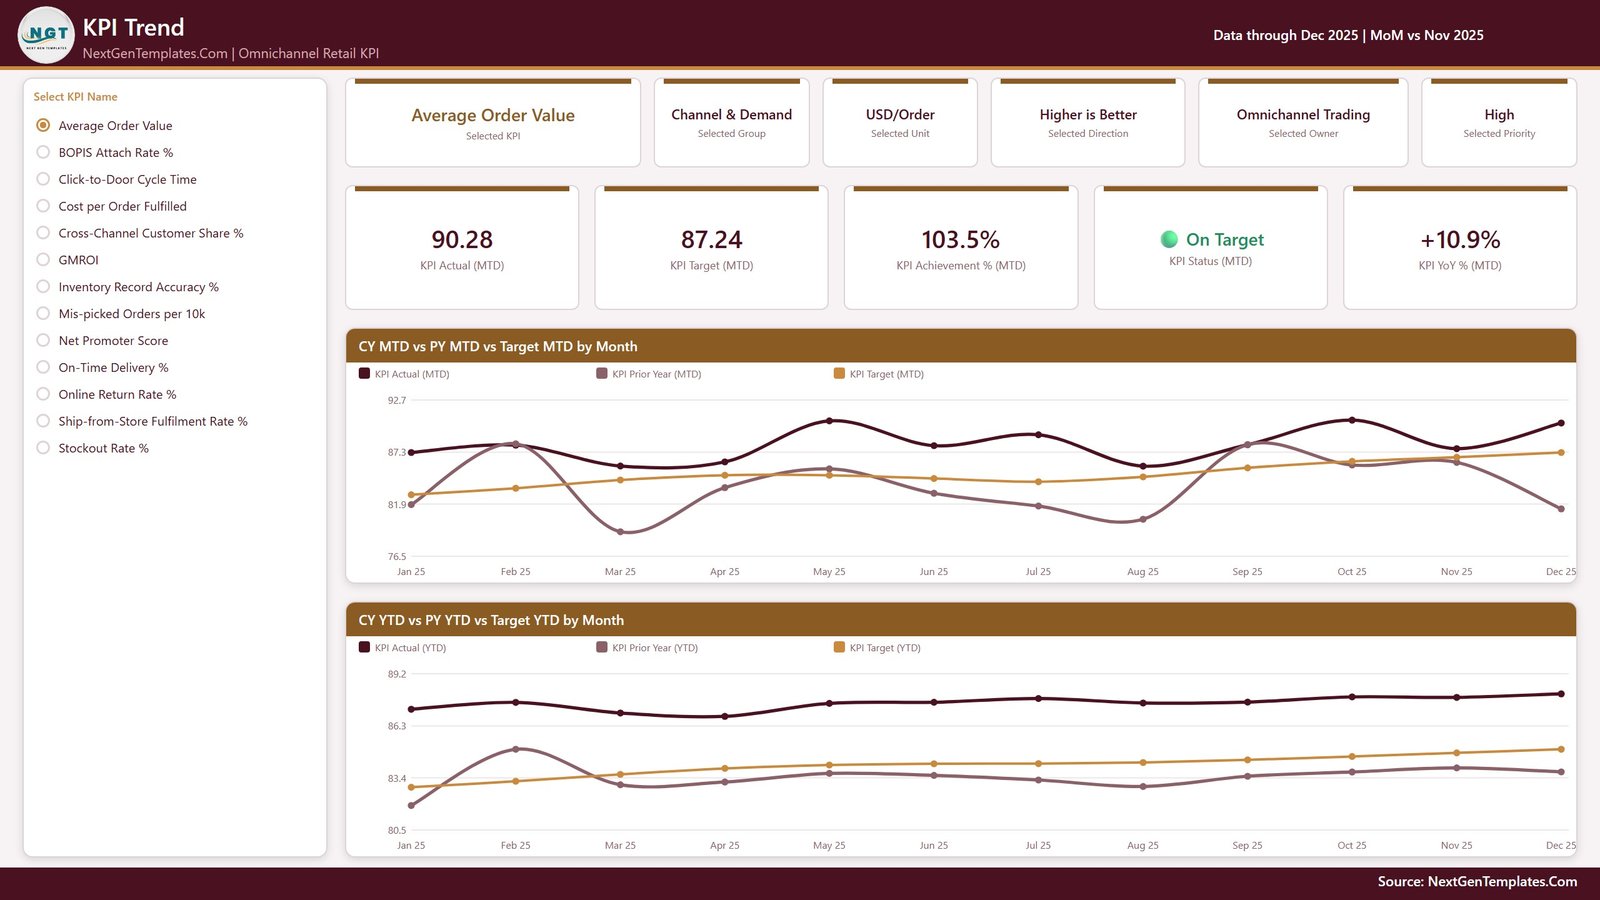
Select one KPI to see its group, unit, direction, owner, priority, actual, target, achievement, status, and year-over-year result. Two 12-month charts compare current-year MTD and YTD values with prior-year results and targets.
KPI Definition Page
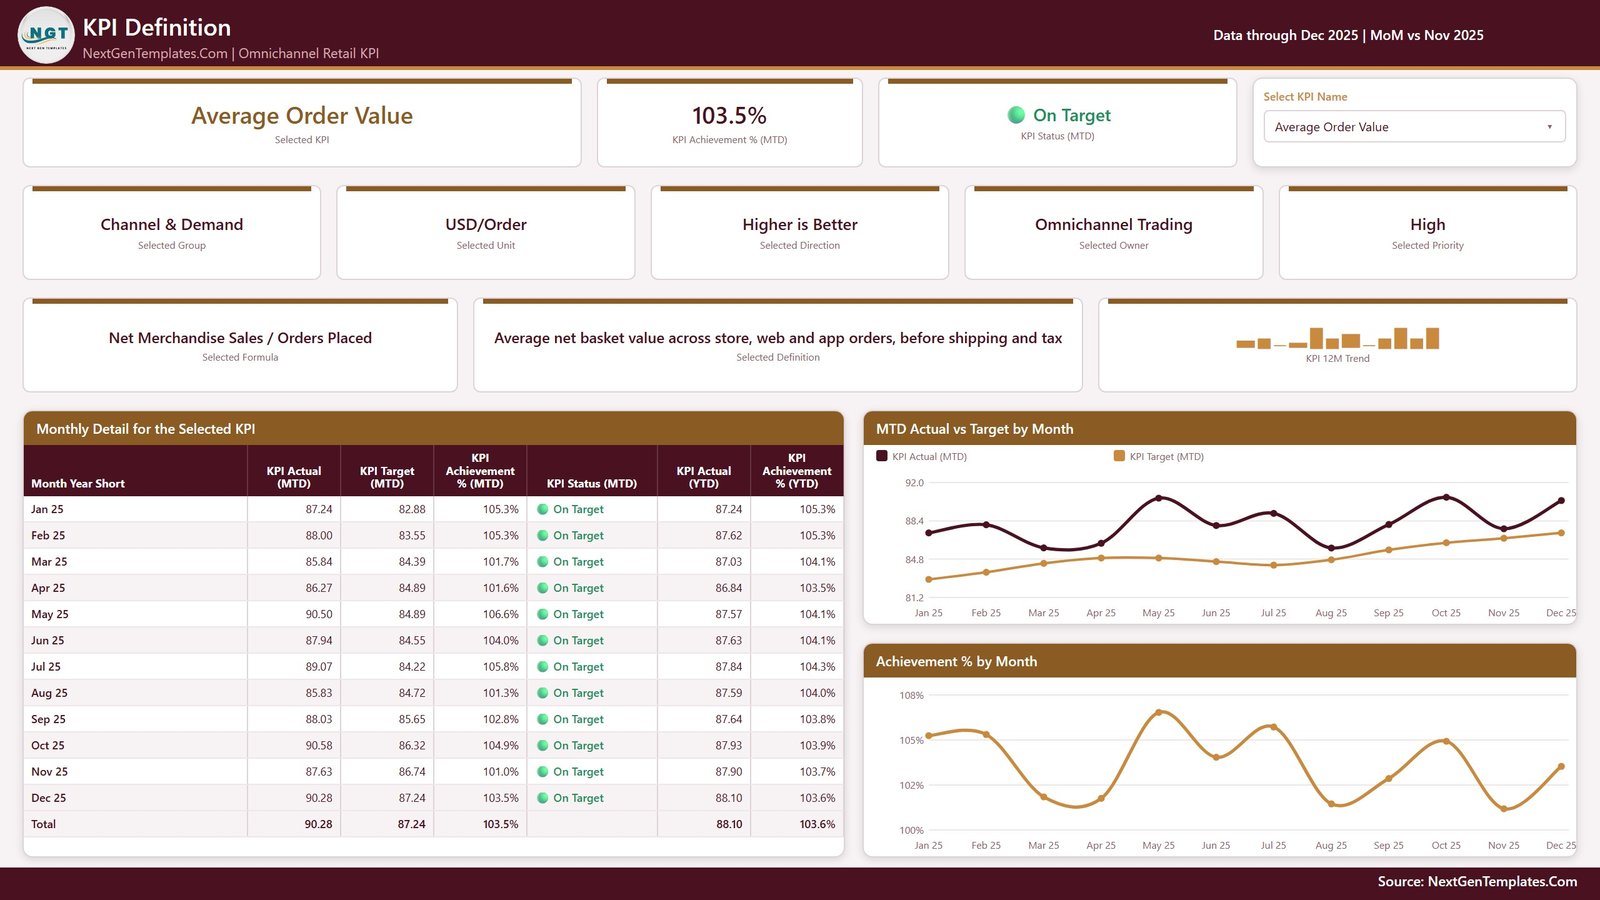
This page explains the selected KPI through its formula, definition, group, unit, direction, owner, and priority. A month-by-month table and two charts connect the definition to actual-versus-target performance.
Get More Templates Page
The report includes a resources page with usage reminders, customisation guidance, and links to related dashboard families.
Omnichannel Retail KPI Dashboard in Power BI vs. Google Sheets vs. Paid Retail BI – Where This Fits
| Consideration | This Power BI template | Google Sheets alternative | Paid retail BI/SaaS |
|---|---|---|---|
| Cost | One-time purchase | One-time template purchase | Usually recurring licence |
| Platform | Power BI Desktop | Browser-based Google Sheets | Vendor cloud platform |
| Setup | Replace Excel inputs and refresh | Make a copy and enter data | Configuration and integration project |
| Interactive analysis | Five slicers, KPI selection, tooltips | Spreadsheet filters and charts | Depends on plan and implementation |
| Custom fields and KPIs | Edit the source pack and model | Edit sheet rows and formulas | May need admin or consulting work |
| Live system connection | Not included | Not included | Often available through connectors |
| Mobile access | Requires publishing to your Power BI environment | Available through Google Sheets | Usually included |
| Retail scorecard focus | 13 supplied omnichannel KPIs | Template-dependent | Broader operational suite |
Who This Template Is For – and Who It’s Not For
It fits omnichannel trading managers, retail operations analysts, fulfilment leaders, inventory-control teams, merchandise planners, and consultants who already use Power BI and can maintain a structured Excel input. It is especially useful for monthly business reviews where target status and prior-year movement need to be visible together.
It is not a POS, OMS, WMS, CRM, demand-forecasting engine, or live connector. It does not collect transactions, calculate recommended targets, certify inventory accuracy, or prove customer satisfaction. Teams needing automated feeds, row-level security, alerts, governance, or a hosted collaboration layer should plan additional Power BI development or use an integrated retail platform.
How to Use the Omnichannel Retail KPI Dashboard in Power BI
- Download and extract the ZIP.
- Keep the PBIX and Data.xlsx together.
- Update KPI Definition with your KPI names, groups, units, formulas, definitions, direction, owners, and priorities.
- Enter monthly targets in Input_ Target and current/prior-year actuals in Input_ Actual.
- Open the PBIX in Power BI Desktop and choose Home > Refresh.
- Use the Month, KPI Group, Owner, Priority, and Direction slicers on the scorecard.
- Select a KPI on the Trend or Definition page for detailed analysis.
- Validate calculations and target logic against your own retail definitions before sharing.
Real-World Use Cases
Monthly Omnichannel Trading Review
A trading director can review BOPIS, cross-channel customer share, average order value, and return rate beside the targets the business actually approved.
Fulfilment and Inventory Exception Meeting
An operations analyst can isolate missed or at-risk KPIs such as stockout rate, click-to-door cycle time, mis-picks, on-time delivery, and ship-from-store fulfilment.
Retail Consulting Handover
A consultant can replace the sample KPI definitions and owners, apply the client’s terminology, and deliver a repeatable monthly scorecard without starting the Power BI layout from zero.
Frequently Asked Questions
Does this dashboard connect directly to my POS, ecommerce platform, OMS, or WMS?
No. The supplied workflow uses Data.xlsx. Direct connections require separate configuration.
Are the targets and sample numbers industry benchmarks?
No. They are editable demonstration values only. Replace them with approved definitions and targets from your business.
Can I add or rename KPIs?
Yes. Keep the KPI name consistent across KPI Definition, Input_ Target, and Input_ Actual, then refresh the report.
Does it support lower-is-better KPIs?
Yes. Cost, return rate, stockout rate, mis-picks, and cycle time can use direction-aware LTB scoring.
Do I need a paid Power BI licence?
Power BI Desktop can open and edit the PBIX. Publishing and sharing through the Power BI service may require Microsoft licensing based on your environment.
Is this the same as the analytical Retail Dashboard in Power BI?
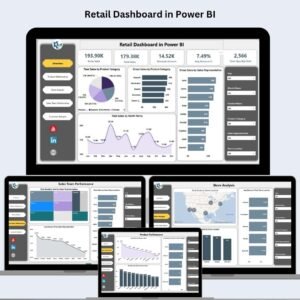
No. This is the KPI scorecard family: targets, status lights, MTD/YTD comparisons, KPI Trend, and KPI Definition. The analytical retail dashboard is a separate product for broader slicing and chart exploration.
Is support for real-time data included?
No. Refresh frequency depends on the data connection you configure. The included source is an Excel workbook.
About the Author
Built by PK – Microsoft Certified Professional with 15+ years of Excel, Google Sheets, and Power BI experience. Founder of NextGenTemplates, reaching 300K+ subscribers across YouTube channels. Every template is hand-built and tested before release.
Explore Related Templates
- Omnichannel Retail KPI Dashboard in Google Sheets – the cross-platform KPI-dashboard alternative.
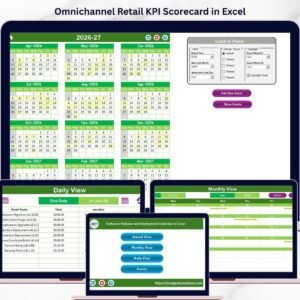
- Omnichannel Retail KPI Scorecard in Excel – a spreadsheet scorecard for the same domain.
- Retail Dashboard in Power BI – a separate analytical dashboard family.
- Out-of-Stock Rate KPI Dashboard in Power BI.
- Shelf Space Utilization KPI Dashboard in Power BI.
Browse more Power BI KPI Dashboard templates or read the companion guide on PK-AnExcelExpert.
Ready to replace scattered retail KPI files with one editable scorecard? Download the template, add your definitions and targets, refresh, and review every KPI from the same Power BI report.
Last updated: August 18, 2026.






























Reviews
There are no reviews yet.