


Efficient Office Space Utilization Report Excel, Space Usage Dashboard, Meeting Room Tracker, Workplace Efficiency Excel, Facility Management Template, Office Occupancy Report, Excel Resource Utilization, HR Space Planning Excel, Corporate Office Management Excel is no longer just about cutting rental costs—it’s about creating smarter workplaces. With hybrid work models on the rise, companies must ensure that every square foot of office space is optimized for productivity, collaboration, and employee satisfaction. But without structured tracking, organizations risk wasted resources, overcrowded rooms, and underutilized facilities.
The Office Space Utilization Report in Excel offers a ready-to-use, data-driven solution for facility managers, HR teams, and business leaders. Built with Excel’s powerful features—charts, slicers, and formulas—this tool transforms raw occupancy and booking data into actionable insights. It helps identify usage patterns, improve resource allocation, and plan for future needs with confidence.
Unlike expensive workplace management software, this Excel template is cost-effective, customizable, and easy to use, making it a perfect solution for businesses of all sizes.
✨ Key Features of Office Space Utilization Report

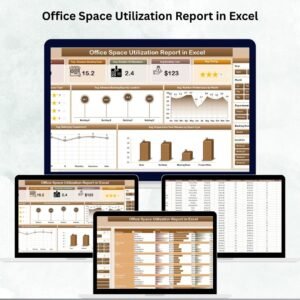
✅ Summary Dashboard – KPI cards for total bookings, utilization %, and average ratings.
✅ Interactive Slicers – Filter data by department, location, or time period for detailed insights.
✅ Charts for Key Metrics – Analyze trends like:
Average Rating by Space Type
Advance Booking Days by Location
Attendees per Month
Department-specific ratings
Preparation Time by Space Type
✅ Report Page – Tabular view with slicers for detailed drill-downs.
✅ Data Sheet – Central database for bookings and utilization records, automatically powering reports.
✅ Support Sheet – Reference data for dropdowns (departments, space types, ratings).
✅ Customizable Layout – Add or modify charts and metrics to suit your business needs.
✅ Scalable – Suitable for single offices, multi-branch companies, coworking spaces, or institutions.
📦 What’s Inside the Office Space Utilization Report
When you download this Excel template, you get:
Summary Page – Quick snapshot of KPIs and utilization trends.
Report Page – Detailed breakdown with slicer-based filtering.
Data Sheet – Core record-keeping for bookings and usage details.
Support Sheet – Reference lists for departments, space types, and ratings.
This ensures a complete reporting system where raw data seamlessly converts into insights.
🛠️ How to Use the Office Space Utilization Report
Enter Data – Add booking and utilization records into the Data Sheet.
Review Dashboard – See total bookings, utilization %, and satisfaction ratings at a glance.
Drill Down with Slicers – Filter by department, location, or space type.
Analyze Charts – Study booking behaviors, attendee trends, and ratings.
Identify Patterns – Spot underutilized or overbooked areas.
Take Action – Reallocate, repurpose, or redesign office spaces for better efficiency.
👩💼 Who Can Benefit from This Report?
Facility Managers – Optimize meeting rooms, workstations, and collaborative areas.
HR Teams – Understand departmental booking behaviors and improve employee satisfaction.
Executives – Gain visibility into space utilization for better cost management.
Coworking Providers – Track usage peaks and customer preferences.
Educational & Healthcare Institutions – Manage classrooms, training rooms, and consultation spaces.
By using this tool, organizations can reduce costs, improve space allocation, and create smarter workplaces.
👉 Click here to read the Detailed blog post
Visit our YouTube channel to learn step-by-step video tutorials
Watch the step-by-step video tutorial:
Compatibility and Requirements
- Works in Microsoft Excel desktop (Excel 2016 or later, or Microsoft 365).
- The report uses slicers to filter results. Microsoft explains them in Use slicers to filter data.
Frequently Asked Questions
What sheets are in the report?
You get a Summary Page, a Report Page, a Data Sheet for booking and usage records and a Support Sheet with reference lists.
Which KPIs does the summary show?
The KPI cards show total bookings, utilization % and average ratings.
How can I filter the data?
Slicers let you filter by department, location, space type or time period.
Where do the dropdown lists come from?
The Support Sheet holds the lists of departments, space types and ratings used in the dropdowns.
Related Office Space Templates
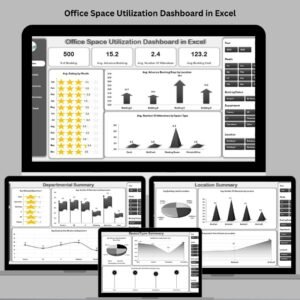
- Office Space Utilization Dashboard in Excel: a full dashboard version of this topic
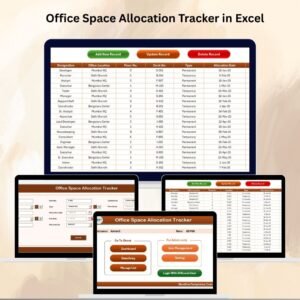
- Office Space Allocation Tracker in Excel: track which teams use which spaces
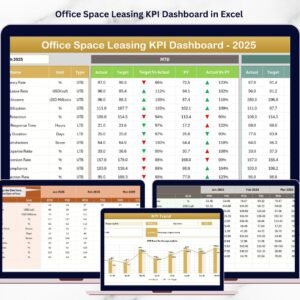
- Office Space Leasing KPI Dashboard in Excel: KPI tracking for office leases
- Office Space Utilization Dashboard in Power BI: the same topic built for Power BI
- Office Space Utilization Dashboard in Google Sheets: the same topic for Google Sheets
Browse all Excel reports or the Excel dashboards.


Reviews
There are no reviews yet.