

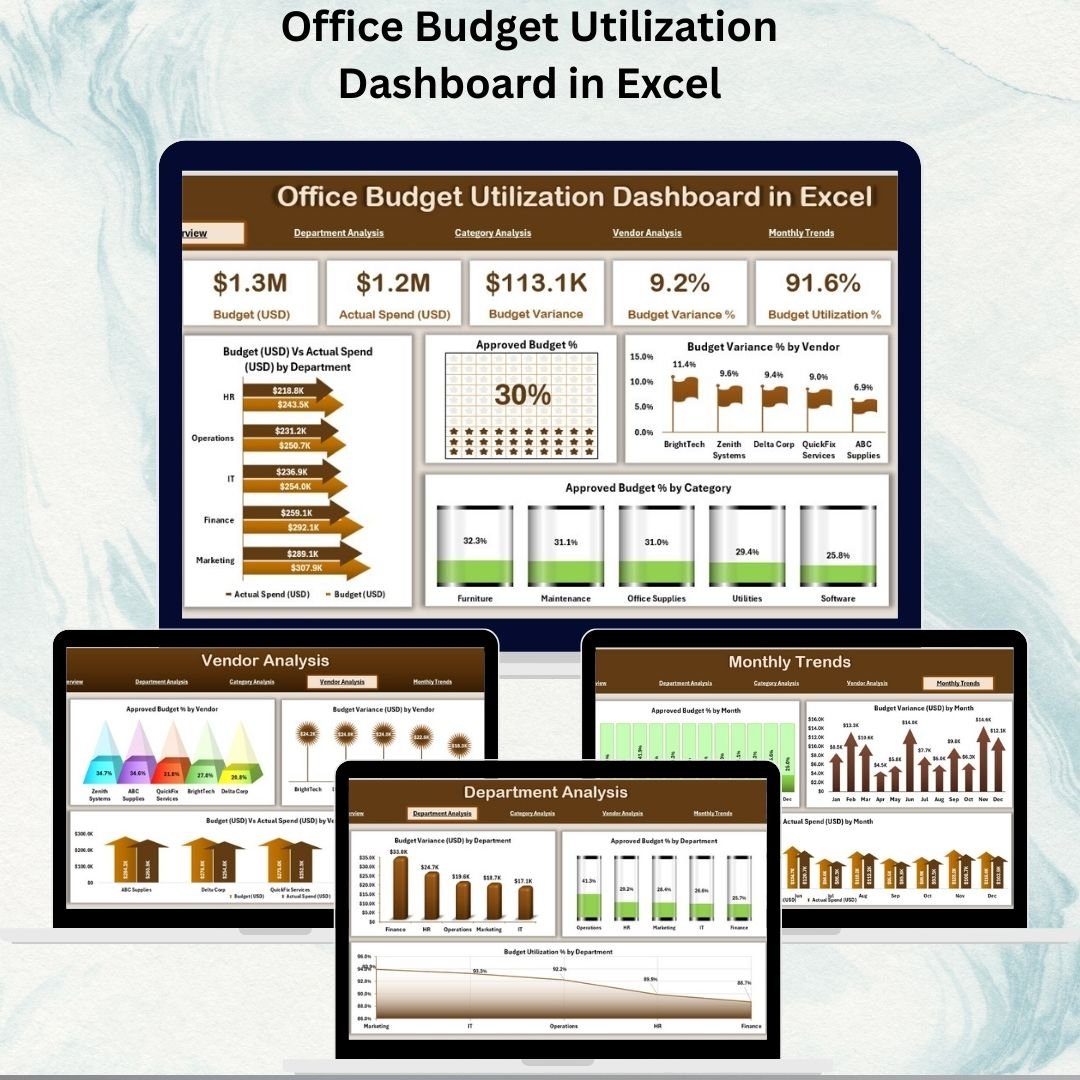
Office Budget Utilization Dashboard in Excel 💼📊
Managing an office budget effectively is essential for financial stability and growth. Without proper systems, businesses face overspending, misallocation of resources, and poor visibility into how funds are used. The Office Budget Utilization Dashboard in Excel solves these challenges by providing a structured, interactive, and ready-to-use tool that helps organizations track, monitor, and analyze budget performance in real time.
Whether you’re running a small office, a large corporate department, or a non-profit organization, this dashboard makes financial monitoring easier, smarter, and more transparent.
✨ Key Features of the Office Budget Utilization Dashboard
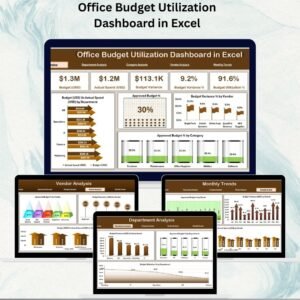
🏠 Overview Page – The Big Picture
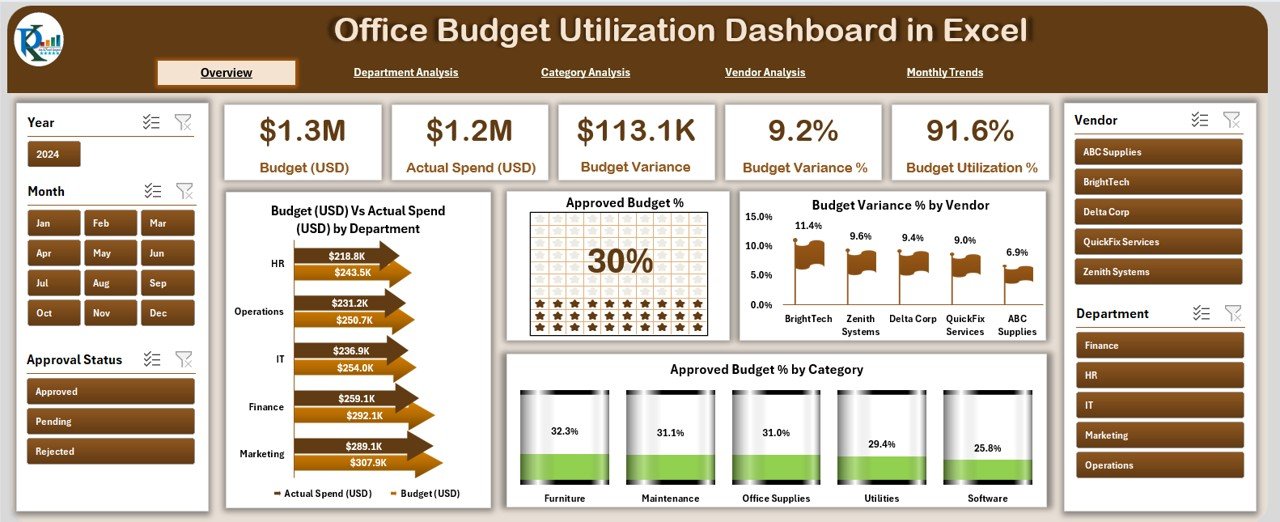
Displays 5 KPI cards for quick insights.
Charts include:
Budget (USD) vs Actual Spend (USD) by Department
Approved Budget %
Budget Variance % by Vendor
Approved Budget % by Category
Provides leadership with a quick snapshot of financial health.
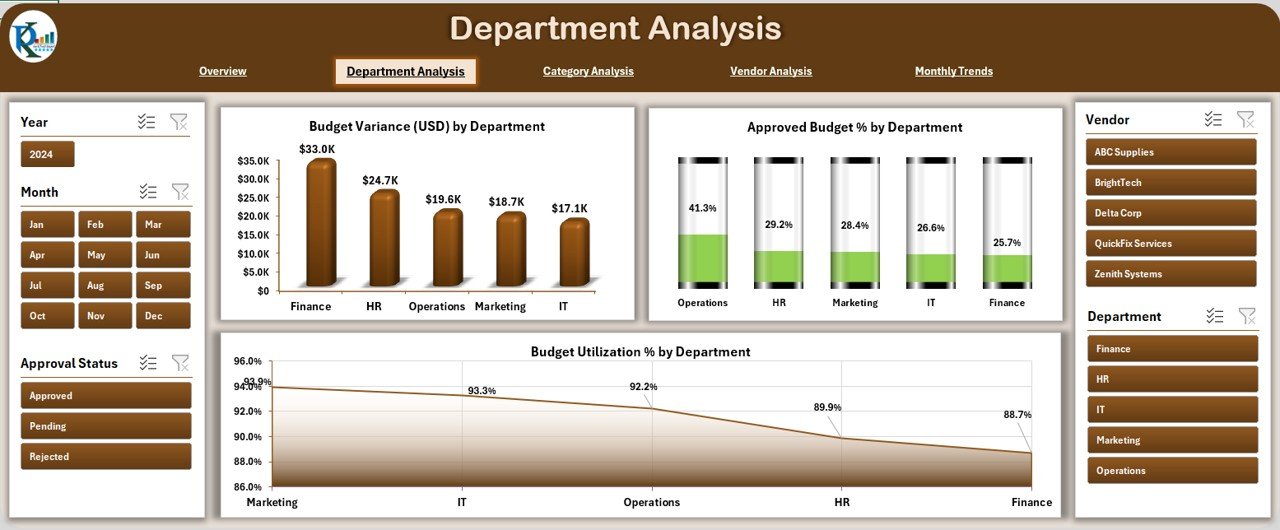
🏢 Department Analysis – Drill Down by Team
Focuses on how each department uses its budget.
Charts available:
Budget Variance (USD) by Department
Approved Budget % by Department
Budget Utilization % by Department
Helps identify which departments are overspending or underutilizing.
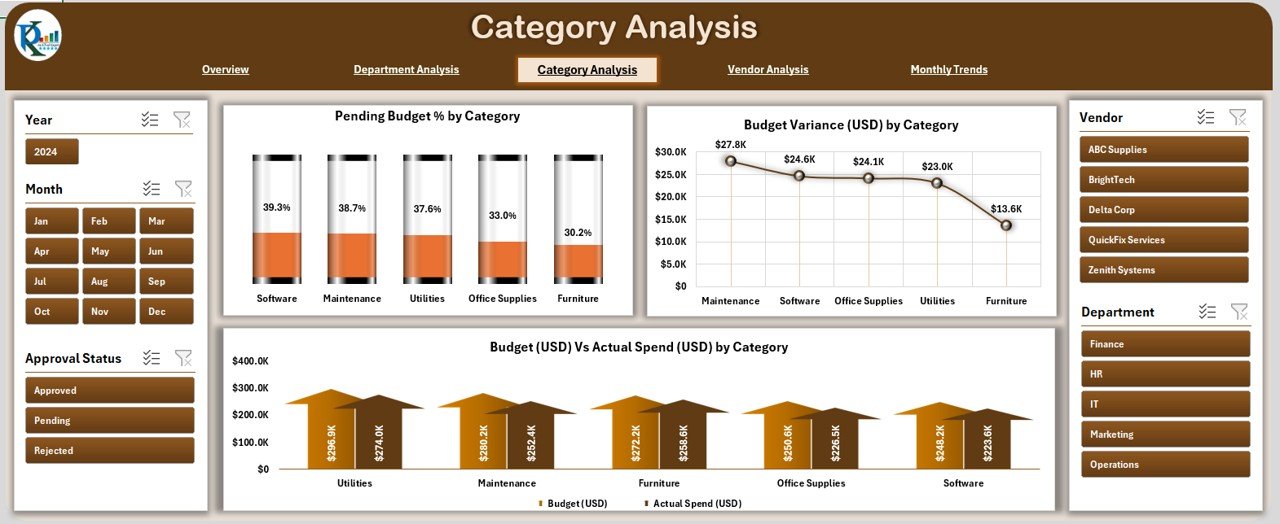
📂 Category Analysis – Understand Spending by Cost Area
Breaks down spending across categories such as HR, IT, Marketing, or Operations.
Charts include:
Pending Budget % by Category
Budget Variance (USD) by Category
Budget (USD) vs Actual Spend (USD) by Category
Perfect for spotting high-expense categories and reallocating funds.
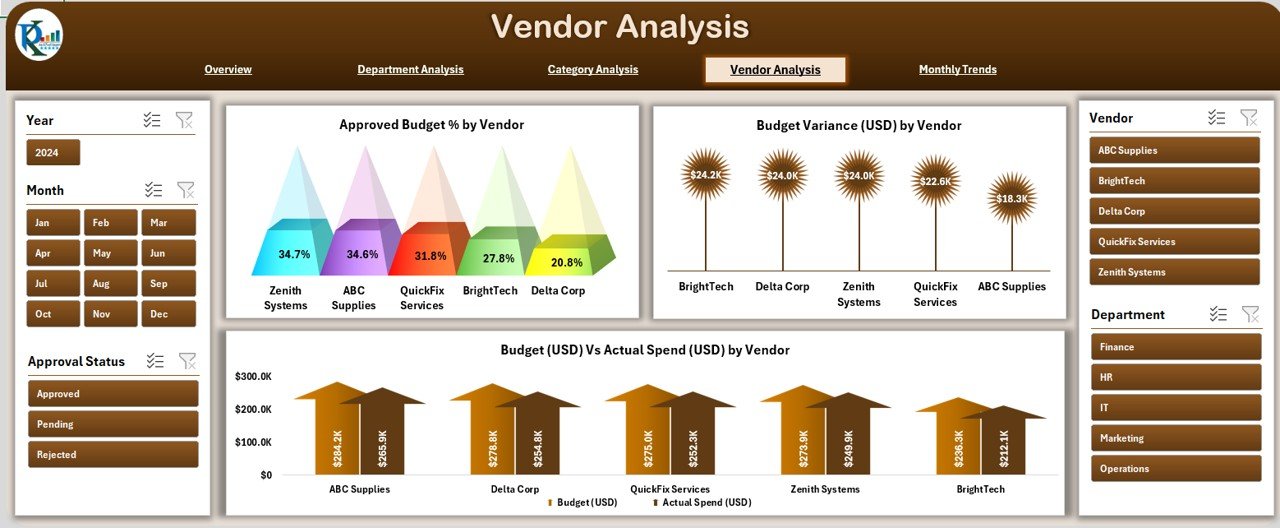
🤝 Vendor Analysis – Monitor Vendor Budgets
Tracks budget usage related to external vendors.
Charts include:
Approved Budget % by Vendor
Budget Variance (USD) by Vendor
Budget vs Actual Spend (USD) by Vendor
Helps procurement teams monitor vendor efficiency and negotiate better deals.
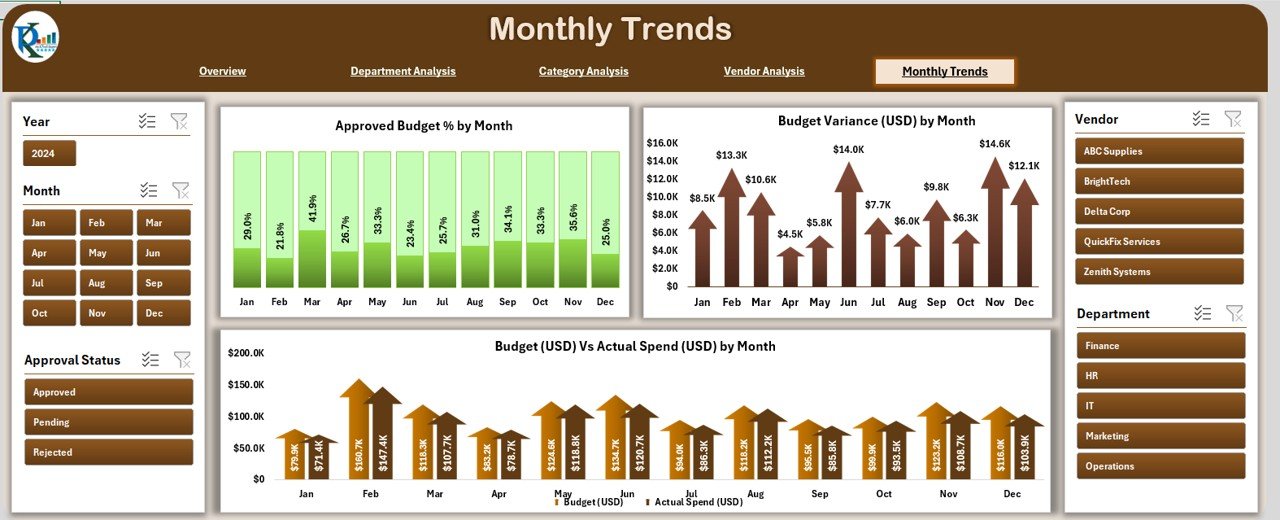
📆 Monthly Trends – Spot Seasonal Patterns
Analyzes spending over time.
Charts include:
Approved Budget % by Month
Budget Variance (USD) by Month
Budget vs Actual Spend (USD) by Month
Useful for forecasting and maintaining financial discipline.
⚙️ Support Sheet – The Data Hub
Stores raw data for budgets, vendors, categories, and departments.
Once updated, all dashboard visuals refresh automatically.
✅ Advantages of the Office Budget Utilization Dashboard
Improved Financial Visibility – Monitor approved vs actual spending instantly.
Quick Decision-Making – Visuals make it easy to spot problem areas.
Accountability – Assign and track budgets at department and vendor levels.
Cost Control – Identify overspending before it escalates.
Performance Tracking – Compare spending across months, vendors, and categories.
Flexibility – Modify dashboard to suit your organization’s unique needs.
Scalable – Works for small businesses, large corporations, and non-profits.
🔧 Opportunities for Improvement
Automation – Integrate with accounting systems for real-time updates.
Forecasting – Add predictive models for future spending.
Consistency – Standardize expense categorization.
Collaboration – Enable shared access for cross-department visibility.
Data Accuracy – Ensure raw data is reviewed regularly.
📌 Best Practices
Update support sheet weekly or monthly.
Use clear and consistent categories.
Apply conditional formatting for overspending alerts.
Add slicers and filters for flexible analysis.
Review monthly trends regularly.
Provide basic Excel training for managers.
Protect sensitive financial data with passwords.
👥 Who Can Benefit?
Small Businesses – Track and control office expenses without ERP systems.
Large Corporations – Monitor department and vendor performance.
Non-Profits – Ensure funds are spent effectively.
Educational Institutions – Manage administrative and operational budgets.
Corporate Offices – Align budgets with organizational goals.
🚀 Conclusion
The Office Budget Utilization Dashboard in Excel is a cost-effective, easy-to-use tool that empowers organizations to take control of their financial performance. With clear insights into departments, categories, vendors, and monthly spending patterns, it helps businesses make data-driven decisions, prevent overspending, and ensure smarter allocation of resources.
No matter your organization’s size, this dashboard delivers visibility, accountability, and control over your office budget—all in the familiar environment of Excel.
📖 Click here to read the Detaile
Watch the step-by-step video tutorial:
d Blog Post
🎥 Visit our YouTube Channel for step-by-step tutorials


























Reviews
There are no reviews yet.