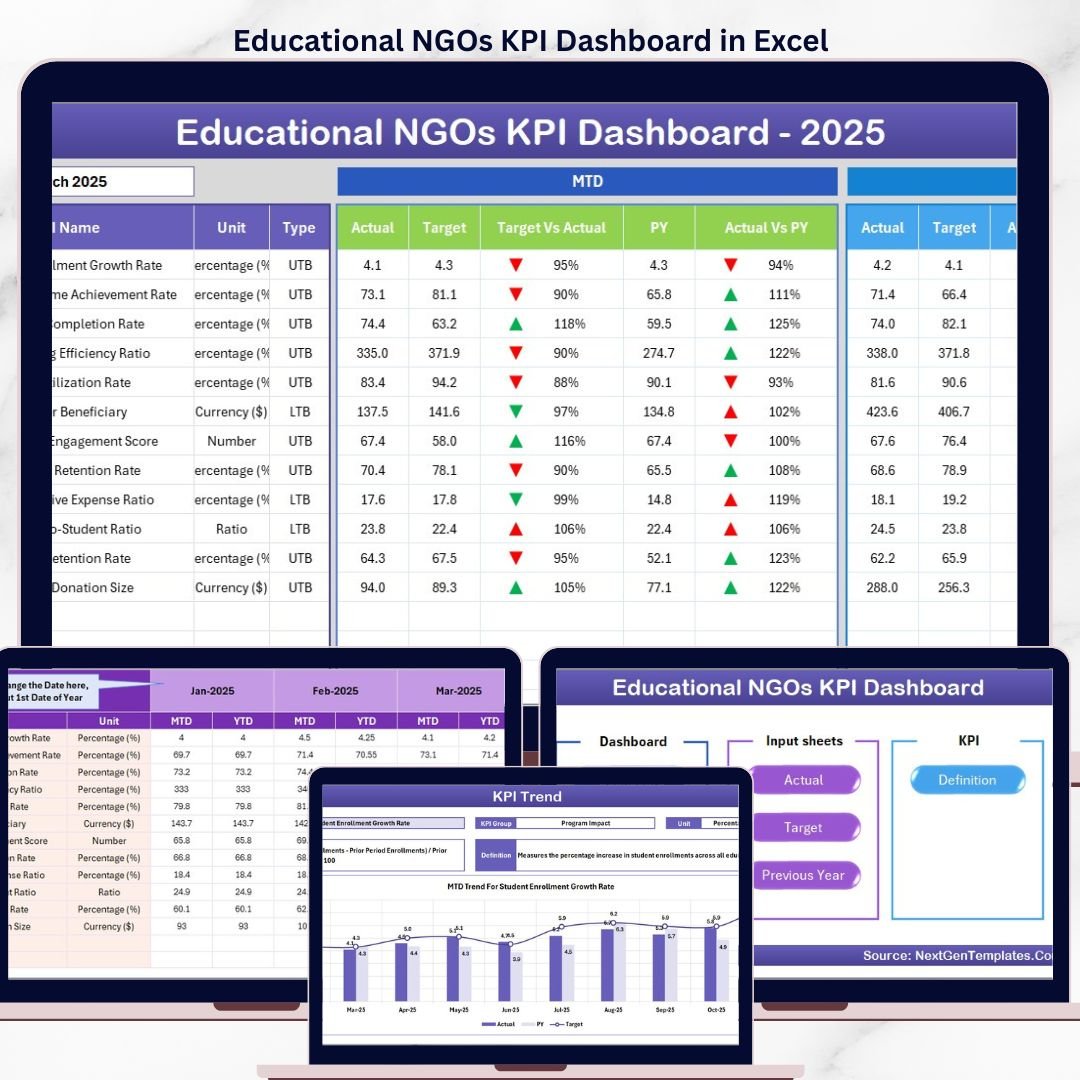


The Educational NGOs KPI Dashboard in Excel tracks 15+ key performance indicators across 7 interactive worksheets, with MTD and YTD trend charts, conditional formatting arrows, and month-over-month comparisons. Setup takes under 10 minutes — just replace the sample data and every metric updates automatically.
🌍 Join 8,400+ teams in 40+ countries using NextGenTemplates to replace paid SaaS tools with one-time-purchase Excel, Google Sheets, Power BI, and HTML templates.
✅ Instant download · One-time payment · No subscription · No per-user fees · Lifetime access
🔑 Key Features of Educational NGOs KPI Dashboard in Excel
This dashboard tracks 15+ education-focused KPIs including student enrollment rate, teacher retention, program completion rate, donor acquisition cost, and grant utilization percentage. Every KPI updates automatically when you input your monthly actual, target, and previous year numbers into three dedicated input sheets.
📌 Month-level filtering — Select any month from the drop-down on cell D3, and the entire dashboard recalculates MTD Actual, Target, and Previous Year data with variance arrows showing performance direction.
📌 YTD tracking built in — Beyond monthly snapshots, the dashboard displays Year-to-Date Actual vs. Target vs. Previous Year comparisons with conditional formatting indicators (green up arrows for positive trends, red down arrows for negative).
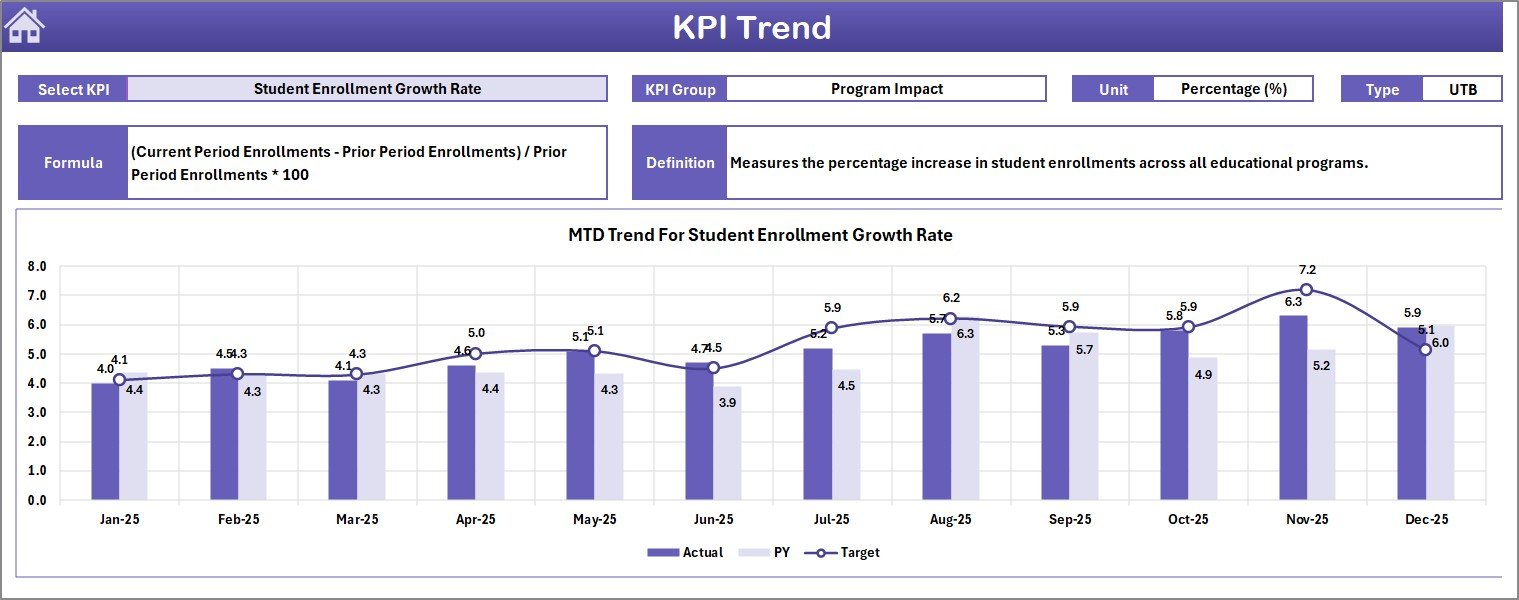
📌 KPI Trend analysis — A dedicated trend sheet lets you pick any single KPI from a drop-down and view its 12-month MTD and YTD trend charts for Actual, Target, and PY side by side, along with KPI metadata (group, unit, type, formula, and definition).
📌 KPI Definition sheet — Define each KPI’s name, group, unit, formula, full definition, and type (Lower the Better or Upper the Better) in one central sheet that feeds every other page.
📌 No macros, no VBA — Works on Windows, Mac, and Microsoft 365 without enabling any special settings. If you are managing education programs for NGOs, this template pairs well with our Teacher Training Institutes KPI Dashboard and Curriculum Development Services KPI Dashboard for a full education analytics stack.
📦 What’s Inside the Educational NGOs KPI Dashboard
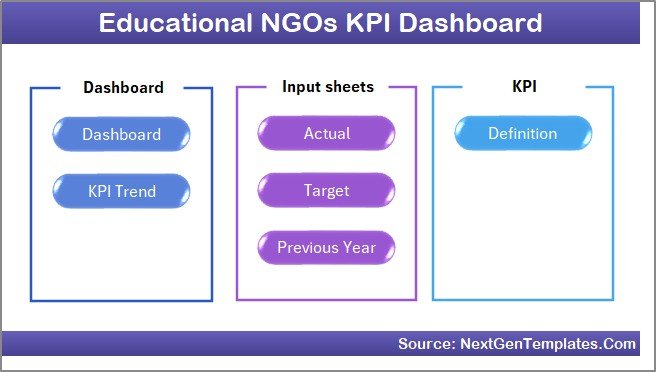
The template includes 7 professionally designed worksheets:
📂 Home Sheet — An index page with 6 navigation buttons to jump directly to any sheet in the workbook.
 Home Page
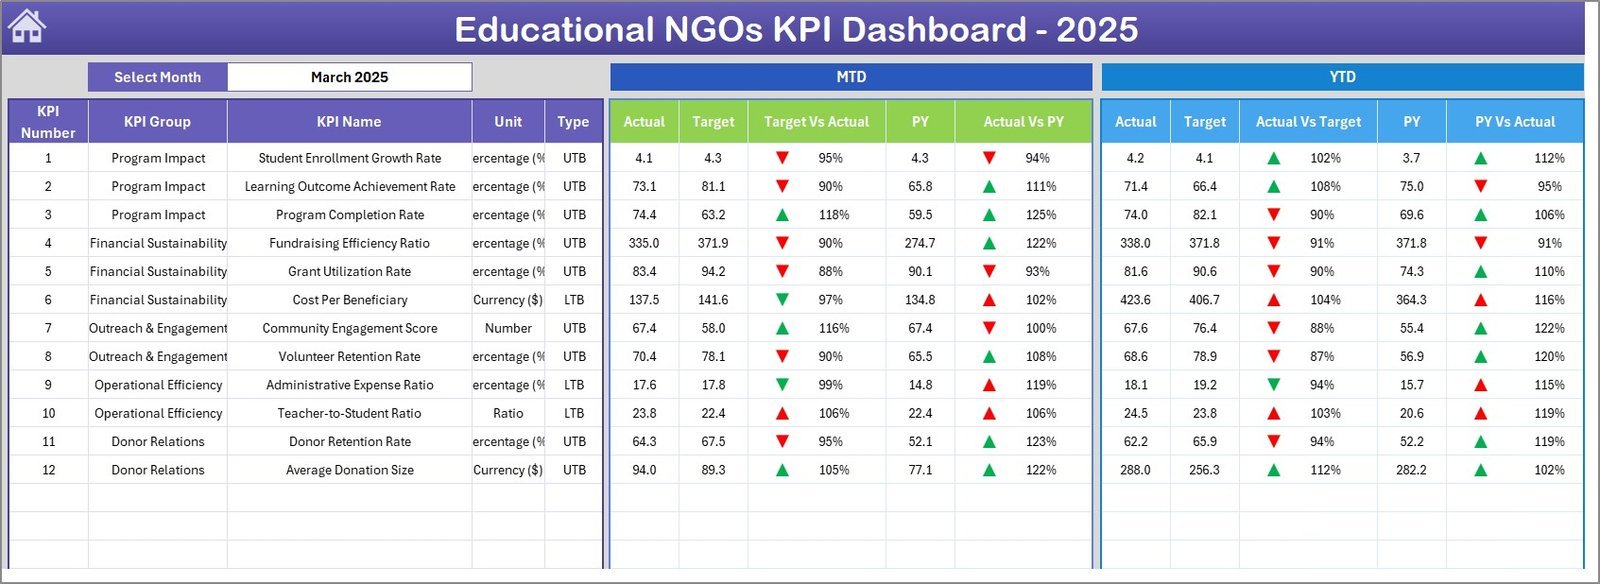
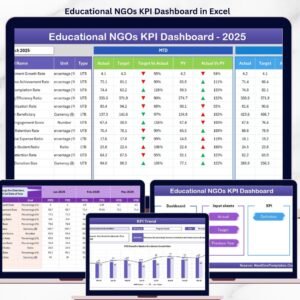
📂 Dashboard Sheet — The main analytics view. Select any month from D3 drop-down. Displays MTD Actual, Target, Previous Year data plus Target vs Actual and PY vs Actual variances with conditional formatting up/down arrows. Also shows YTD Actual, Target, Previous Year data with the same variance indicators.
 Educational NGOs KPI Dashboard
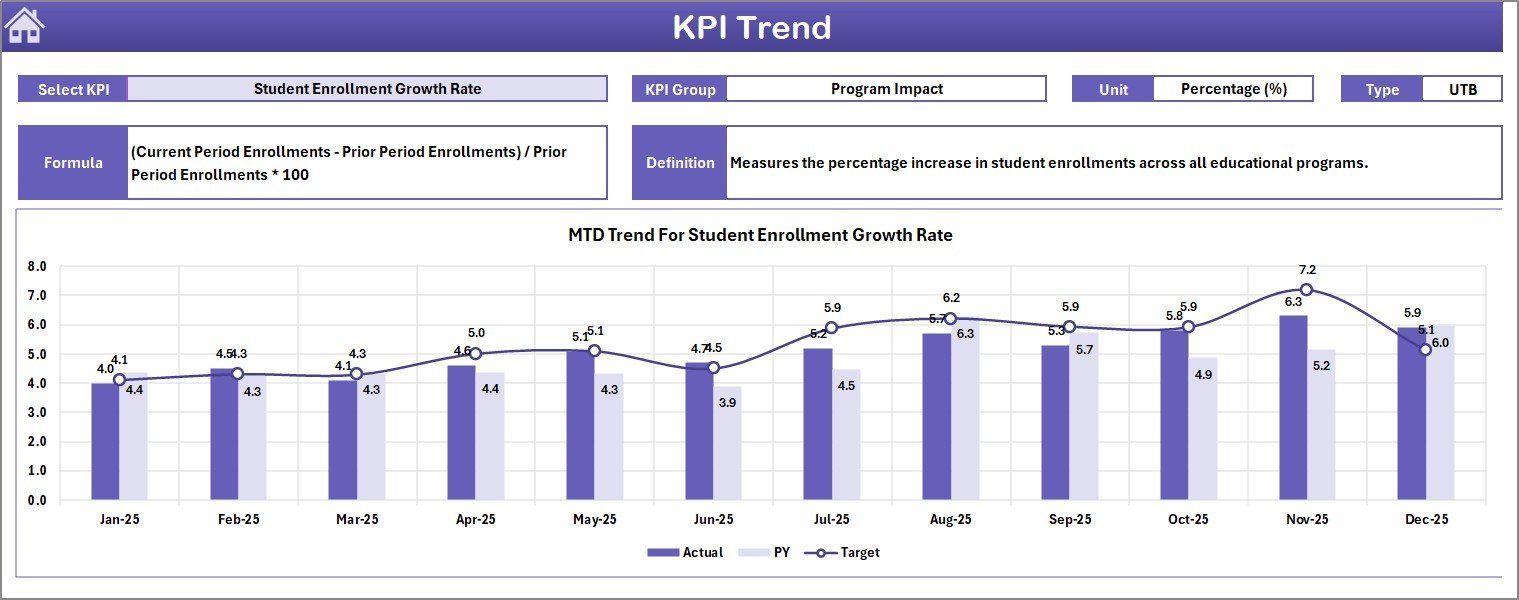
📂 KPI Trend Sheet — Select any KPI from the drop-down on C3 to see its KPI Group, Unit, Type (LTB/UTB), Formula, and Definition. MTD and YTD trend charts display Actual, Target, and PY lines over 12 months.
 KPI Trend Sheet
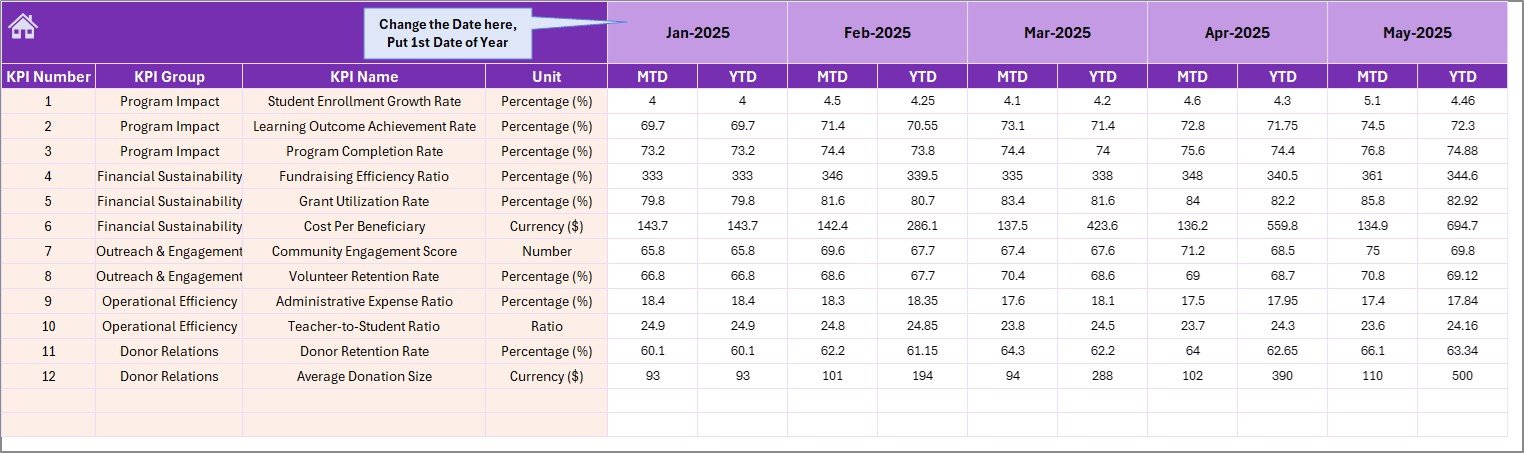
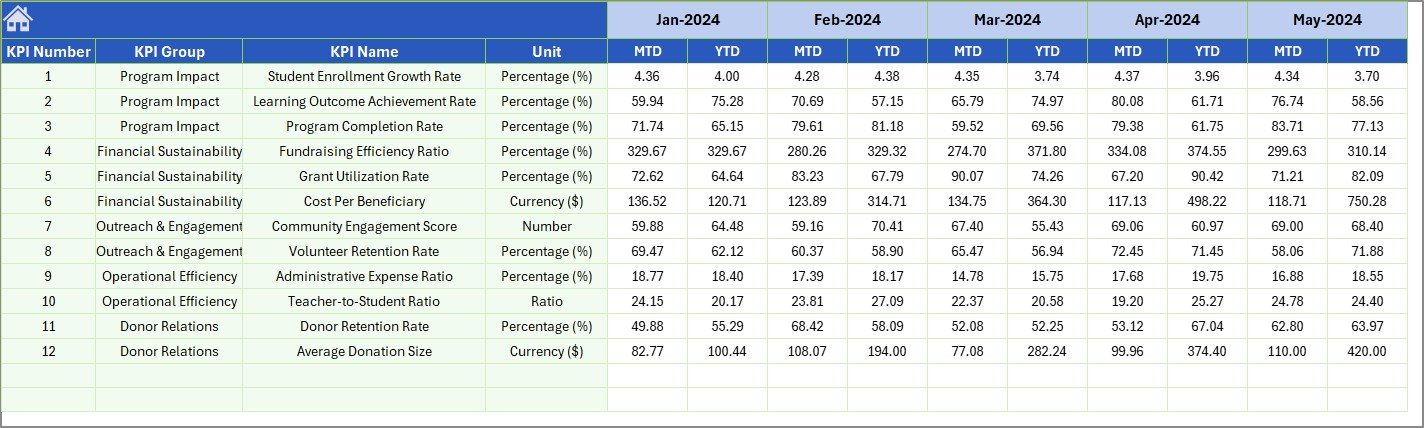
📂 Actual Numbers Input Sheet — Enter your actual MTD and YTD numbers here for each month. Change the starting month of your fiscal year on cell E1.
 Actual Numbers Input Sheet
📂 Target Numbers Input Sheet — Enter monthly MTD and YTD targets for each KPI. The dashboard calculates variances automatically.
 Target Number Input Sheet
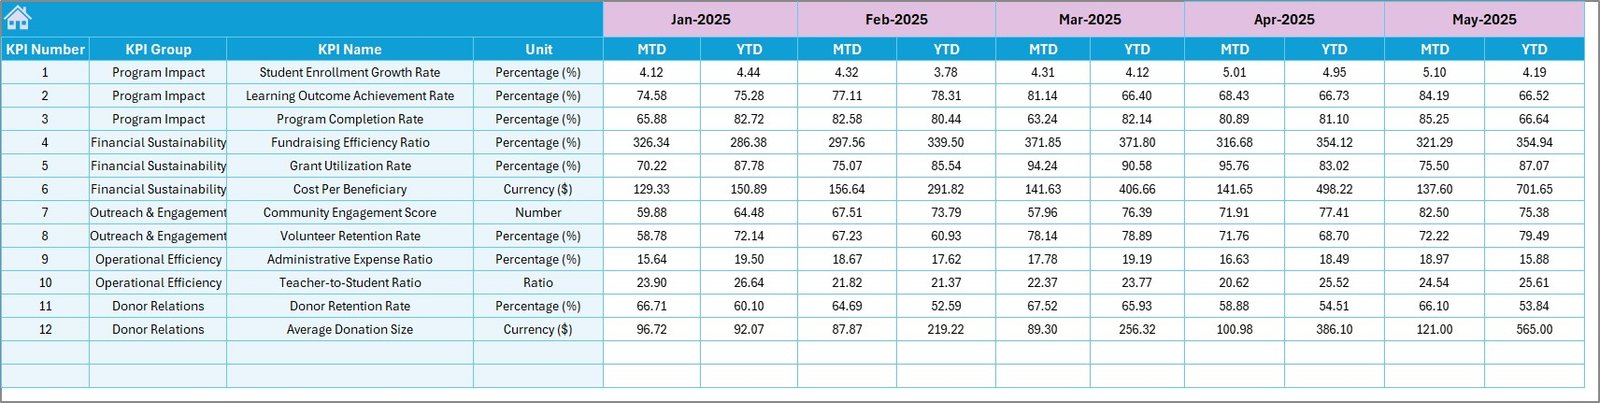
📂 Previous Year Numbers Sheet — Enter last year’s numbers in the same format as the current year for year-over-year comparisons.
 Previous Year Number Input Sheet
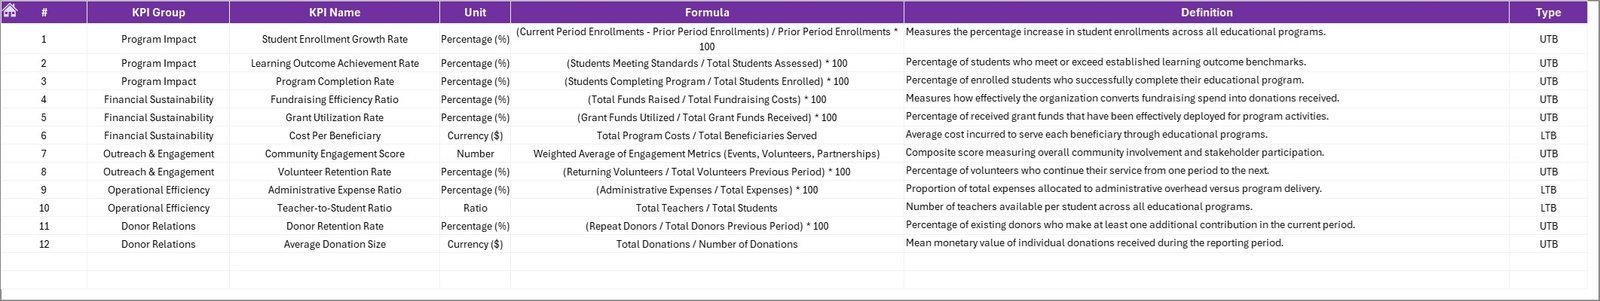
📂 KPI Definition Sheet — Define each KPI’s Name, Group, Unit, Formula, Definition, and Type (LTB or UTB). This sheet feeds the trend page and dashboard labels.
 KPI Definition Sheet
Browse more education and nonprofit templates in our Excel Dashboard Templates collection.
📊 Educational NGOs KPI Dashboard vs. Google Sheets Alternative vs. Donor Management SaaS — Where This Fits
| Feature | Educational NGOs KPI Dashboard (Excel) | Google Sheets KPI Tracker | Salesforce Nonprofit / Bloomerang |
|---|---|---|---|
| Cost | $14.99 one-time | Free (manual build) | $25–150 / user / month |
| Platform | Microsoft Excel (desktop + 365) | Google Sheets (browser) | Cloud SaaS |
| Setup Time | Under 10 minutes | 4–8 hours (build from scratch) | 2–6 weeks onboarding |
| Real-Time Collaboration | Via OneDrive / SharePoint | Yes (native) | Yes |
| Mobile Access | Excel mobile app | Sheets mobile app | Yes |
| Customizable KPIs | Yes — edit KPI Definition sheet | Yes (manual) | Limited without developer |
| MTD + YTD Trend Charts | Yes — built-in | Manual chart setup | Requires report builder |
| Year-1 Cost (5 users) | $14.99 total | $0 (but 20+ hours labor) | $1,500–$9,000 |
| LTB / UTB KPI Classification | Yes — automatic | Not built-in | Custom configuration needed |
For education NGOs that need structured KPI tracking without paying per-user SaaS fees, the Educational NGOs KPI Dashboard in Excel sits in the sweet spot.Educational NGOs KPI Dashboard in Excel
👥 Who This Template Is For — and Who It’s Not For
✅ This template is built for:
- Program managers at education-focused NGOs tracking student outcomes, teacher performance, and funding metrics
- Nonprofit directors reporting KPIs to board members and grant-making organizations
- M&E (Monitoring and Evaluation) officers who need a structured MTD/YTD tracking system
- Education consultants managing multiple school improvement projects
❌ This template is NOT for:
- Large international NGOs needing multi-currency, multi-country consolidated reporting (consider enterprise BI tools)
- Organizations requiring real-time API integrations with donor databases
- Teams that don’t use Microsoft Excel at all
⚙️ How to Use the Educational NGOs KPI Dashboard
1. Download and open the Excel file on your computer or Microsoft 365.
2. Go to the KPI Definition sheet and enter your KPI names, groups, units, formulas, definitions, and types (LTB or UTB).
3. Enter your Actual numbers in the Actual Numbers Input sheet for each month’s MTD and YTD values. Set your fiscal year start month on cell E1.
4. Enter Target numbers in the Target Number Input sheet for each KPI’s monthly MTD and YTD goals.
5. Enter Previous Year numbers in the Previous Year sheet using the same format.
6. Navigate to the Dashboard sheet and select a month from the drop-down on D3 to see your full performance snapshot.
7. Use the KPI Trend sheet to drill into any individual KPI’s 12-month performance trend.Educational NGOs KPI Dashboard in Excel
💼 Real-World Use Cases
Maria runs education programs at a rural development NGO in East Africa. She uses the Educational NGOs KPI Dashboard to track student enrollment, teacher attendance, and classroom supply utilization across 12 community schools. Every quarter, she exports the dashboard to PDF for her donor report — replacing the 3 hours she used to spend building charts manually in PowerPoint.
James manages grants at a U.S.-based education nonprofit. He enters target KPIs from each grant agreement into the Target sheet, then tracks actual performance monthly. The YTD variance arrows instantly show which programs are falling behind, letting him redirect resources before the annual review. He also uses the Nonprofit Fundraising Dashboard in Excel to track his fundraising pipeline alongside program outcomes.
Priya coordinates teacher training at an Indian education foundation. She tracks 18 KPIs including training completion rates, teacher certification pass rates, and student test score improvements. The LTB/UTB classification helps her team understand which metrics need to decrease (like dropout rates) versus increase (like graduation rates).Educational NGOs KPI Dashboard in Excel
❓ Frequently Asked Questions
What KPIs does the Educational NGOs KPI Dashboard track?
The Educational NGOs KPI Dashboard tracks 15+ education-focused KPIs including student enrollment rate, teacher retention, program completion rate, donor acquisition cost, grant utilization, and classroom attendance. All metrics auto-update when you enter your data.
Does this template work on Mac?
Yes. The Educational NGOs KPI Dashboard uses standard Excel formulas and conditional formatting — no macros or VBA. It works on Windows, Mac, and Microsoft 365 without any special setup.
How long does setup take?
Setup takes under 10 minutes. Open the file, enter your KPI definitions, input your actual and target numbers, and the dashboard populates automatically. No coding or formula editing required.
Can I add my own custom KPIs?
Yes. The KPI Definition sheet lets you add, rename, or remove KPIs freely. Enter the KPI name, group, unit, formula, definition, and type (LTB or UTB) — the dashboard and trend charts update automatically.
How does this compare to Salesforce Nonprofit Cloud?
The Educational NGOs KPI Dashboard costs $14.99 one-time versus Salesforce Nonprofit Cloud at $60+ per user per month. For small-to-mid education NGOs that need structured KPI tracking without CRM complexity, this Excel template delivers the same MTD/YTD analytics at a fraction of the cost.Educational NGOs KPI Dashboard in Excel
Can I share this with my team?
Yes. Save the file to OneDrive or SharePoint for real-time collaboration. Multiple team members can view and update the dashboard simultaneously through Microsoft 365’s co-authoring feature.Educational NGOs KPI Dashboard in Excel
What is LTB and UTB in the KPI Definition sheet?
LTB means Lower the Better (e.g., dropout rate, cost per student). UTB means Upper the Better (e.g., enrollment rate, graduation rate). This classification determines how conditional formatting arrows display — green for good performance direction, red for bad.Educational NGOs KPI Dashboard in Excel
👤 About the Author
Built by PK — Microsoft Certified Professional with 15+ years of Excel, Google Sheets, and Power BI experience. Founder of NextGenTemplates, reaching 300K+ subscribers across YouTube channels (@PK-AnExcelExpert, @NextGenTemplates, @NeoTechNavigators). Every template is hand-built and tested before release.
🔗 Explore Related Templates
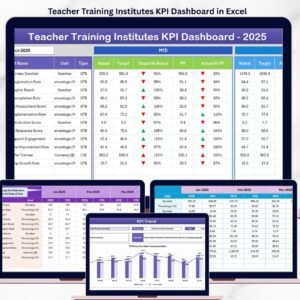
📌 Teacher Training Institutes KPI Dashboard in Excel — Track instructor certification, training hours, and assessment pass rates.
📌 Curriculum Development Services KPI Dashboard — Monitor curriculum rollout, content quality scores, and stakeholder feedback.
📌 Nonprofit Fundraising Dashboard in Excel — Visualize donor pipeline, campaign ROI, and fundraising targets.
📌 Adult Literacy Programs KPI Dashboard — Track literacy improvement rates, enrollment, and program reach.
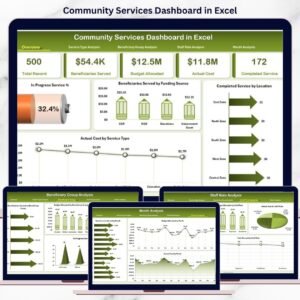
📌 Community Services Dashboard in Excel — Monitor community outreach metrics and service delivery KPIs.
📖 Click here to read the Detailed Blog Post
🎥 Visit our YouTube channel for step-by-step video tutorials
👉 YouTube.com/@NextGenTemplates


Reviews
There are no reviews yet.