


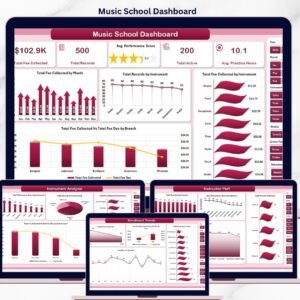
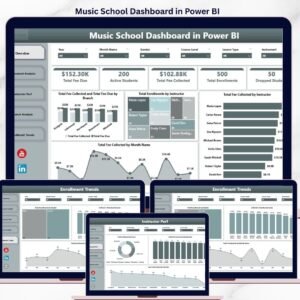
The Music School Dashboard in Power BI tracks 5 KPI cards and 16 interactive visuals across 5 report pages, giving music academy owners and branch managers a single-screen view of fee collection, enrollment, instructor performance, and branch-level outcomes. Setup takes under 10 minutes — point the .pbix file at your data source, click Refresh, and every card, chart, and slicer recalculates automatically. No DAX rebuilds, no monthly subscriptions to renew.
🌍 Join 8,400+ teams across 40+ countries using NextGenTemplates to run their music academies, conservatories, and private studios without paying $19–$59 per month for SaaS tools like MyMusicStaff, Fons, or Music Teacher’s Helper. This Power BI Dashboard is a one-time purchase — instant download, no recurring fees, no per-student pricing, and it runs locally on Power BI Desktop, the free Microsoft application.
✅ Instant download · One-time payment · No subscription · No per-user fees · Lifetime access
🔑 Key Features of Music School Dashboard in Power BI
📌 5 Pre-Built Report Pages – Overview, Instrument Analysis, Instructor Performance, Branch Analysis, and Enrollment Trends. Each page is filterable by Instrument, Instructor, Branch, Course Level, and Year through slicers placed at the top — so a school director can answer any reporting question without rebuilding visuals.
📌 5 KPI Cards on the Overview – Total Fee Due, Active Students, Total Fee Collected, Total Enrollments, and Dropped Students sit at the top of the Overview page and refresh the moment any slicer is applied. The Music School Dashboard in Power BI surfaces the four numbers an academy owner checks every morning — without scrolling through a workbook.
📌 Fee Collection vs. Fee Due Tracking – Compare Total Fee Collected against Total Fee Due across Branches and Course Levels. The dashboard exposes which branches are running collection gaps and which course levels carry the most outstanding dues — so finance leads can act before quarter-end.
📌 Power BI Native Architecture – Every visual is a native Power BI object (cards, bar charts, column charts, line charts, donuts) sourced from a single Excel data model. After updating the source data, click Refresh in Power BI Desktop and the entire report rebuilds in 2–3 seconds, no measure edits required.
📌 Performance Score & Practice Hours Analytics – Track Avg Performance Score by Instructor and by Branch, plus Avg Practice Hours by Instructor. Spot which instructors lift student outcomes and which branches need curriculum support — the leading indicators of student progression.
📌 Slicer-Based Filtering – Multi-select slicers across all 5 pages let directors and branch managers slice the same dataset by instrument, instructor, course level, lesson type, branch, or year — without writing a single DAX expression.
📌 Enrollment Trend Visibility – Total Enrollments by Gender, Total Enrollments by Month Name, Collection Rate by Instructor, and Total Enrollments by Enrollment Status give academy owners the longitudinal view needed for hiring, marketing, and capacity planning decisions. Pairs naturally with the Tutoring Business Dashboard in Power BI for academies running both music and tutoring tracks.
📦 What’s Inside the Music School Dashboard in Power BI
The Music School Dashboard in Power BI contains five analytical pages, each filterable through slicers for Instrument, Instructor, Branch, Course Level, and Year. Below is the breakdown of each page.
1. Overview Page
The Overview page gives music school owners and branch managers a single-screen snapshot of the entire academy. Five KPI cards anchor the top row, and four charts drill into fee trends, instructor distribution, and branch fee-collection health — all filterable by the slicer panel at the top.
KPI cards on this page: Total Fee Due 🔹 Active Students 🔹 Total Fee Collected 🔹 Total Enrollments 🔹 Dropped Students
Charts included:
- Total Fee Collected and Total Fee Due by Branch — Compares paid fees against outstanding dues branch-by-branch to flag locations with collection gaps.
- Total Enrollments by Instructor — Ranks instructors by student volume so you can see who is carrying the load.
- Total Fee Collected by Instructor — Reveals which instructors generate the most revenue, useful for bonus and retention conversations.
- Total Fee Collected by Month Name — Tracks monthly fee inflow so you can spot seasonality, billing-cycle gaps, and the impact of enrollment drives.
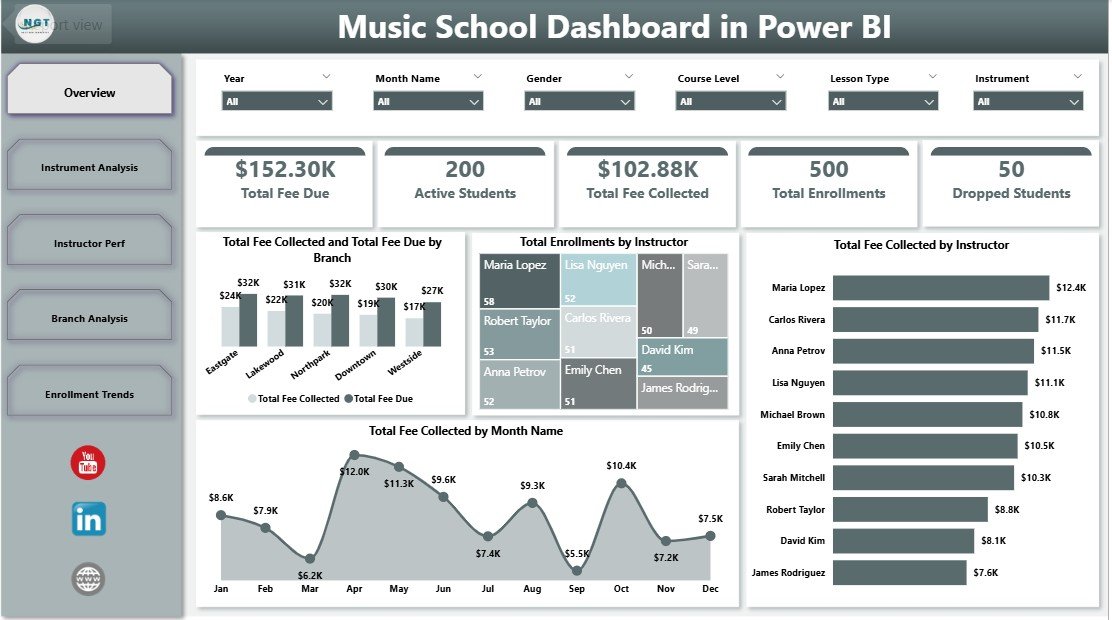
Music School Dashboard in Power BI
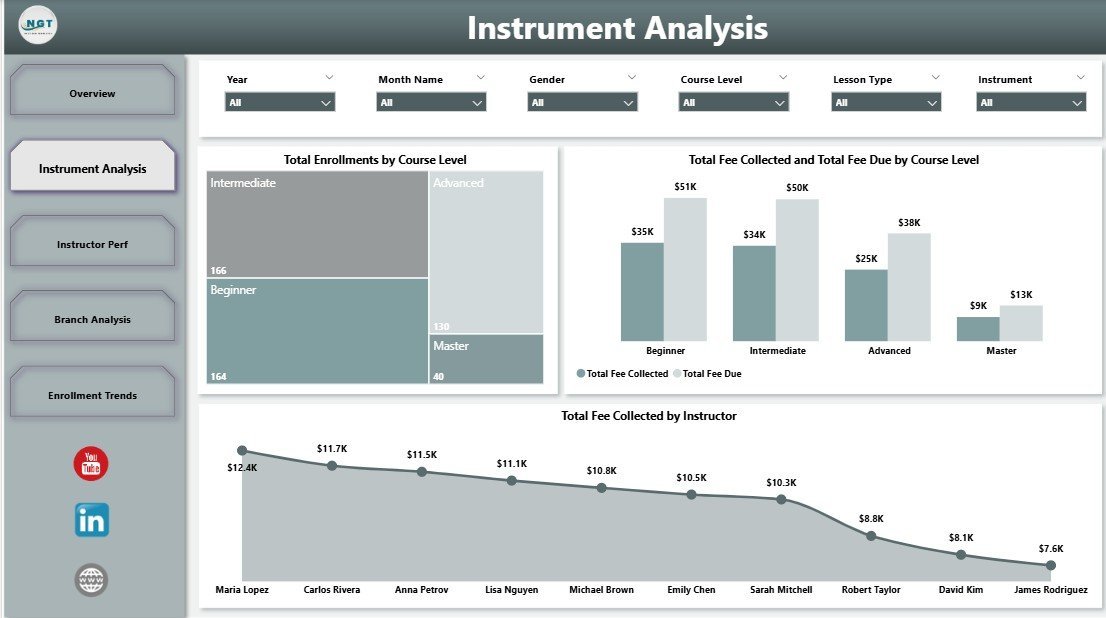
2. Instrument Analysis
This page helps academy owners understand which instruments and course levels drive enrollments, who the top-revenue instructors are, and where fee-due gaps emerge by course level. Useful when pricing courses and allocating instructor bandwidth across guitar, piano, violin, drums, and other programs.
Charts included:
- Total Enrollments by Course Level — Splits enrollment across Beginner, Intermediate, and Advanced to map the student funnel.
- Total Fee Collected and Total Fee Due by Course Level — Highlights course levels where dues are slipping (typically Beginner with high churn).
- Total Fee Collected by Instructor — Identifies instructors generating the most revenue, guiding bonus and retention conversations.
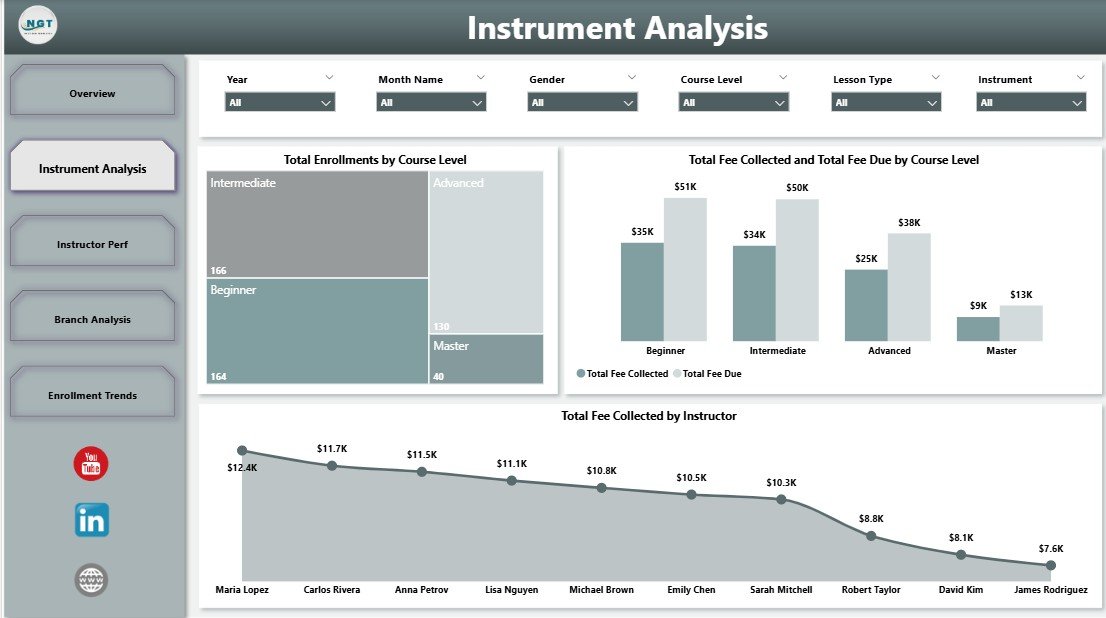
Instrument Analysis
3. Instructor Performance
A manager-focused page for reviewing individual instructor contributions. Use it for monthly 1:1s, quarterly bonus decisions, and retention conversations with high-rated instructors. Avg Practice Hours by Instructor is the leading indicator of progression — instructors whose students log more practice hours typically deliver higher performance scores within 90 days.
Charts included:
- Total Enrollments by Branch — Branch-level enrollment view to support capacity planning.
- Avg Performance Score by Instructor — Surfaces which instructors lift student outcomes the most.
- Avg Practice Hours by Instructor — Tracks how much practice each instructor’s students log, a leading indicator of progression.
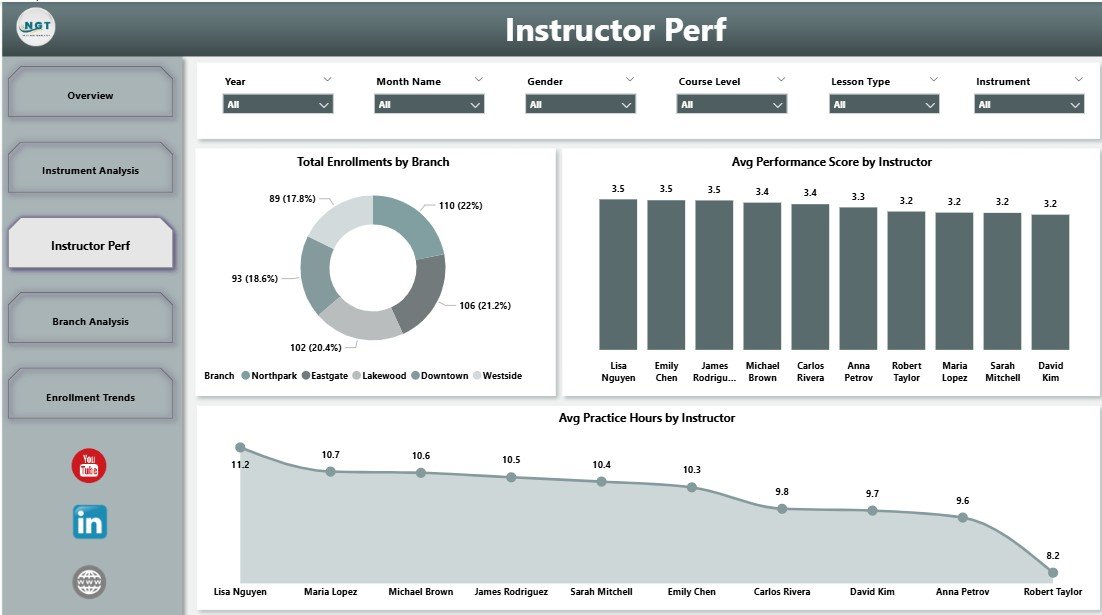
Instructor Performance
4. Branch Analysis
Built for multi-location music academies, this page exposes branch-level performance, lesson-type revenue mix, and enrollment-status health so directors can compare branches on equal footing.
Charts included:
- Avg Performance Score by Branch — Compares student outcomes across branches to flag locations needing curriculum support.
- Total Fee Collected by Lesson Type — Splits revenue across Private, Group, and Online lessons.
- Total Enrollments by Enrollment Status — Active, Inactive, Trial, and Dropped buckets to track funnel health.
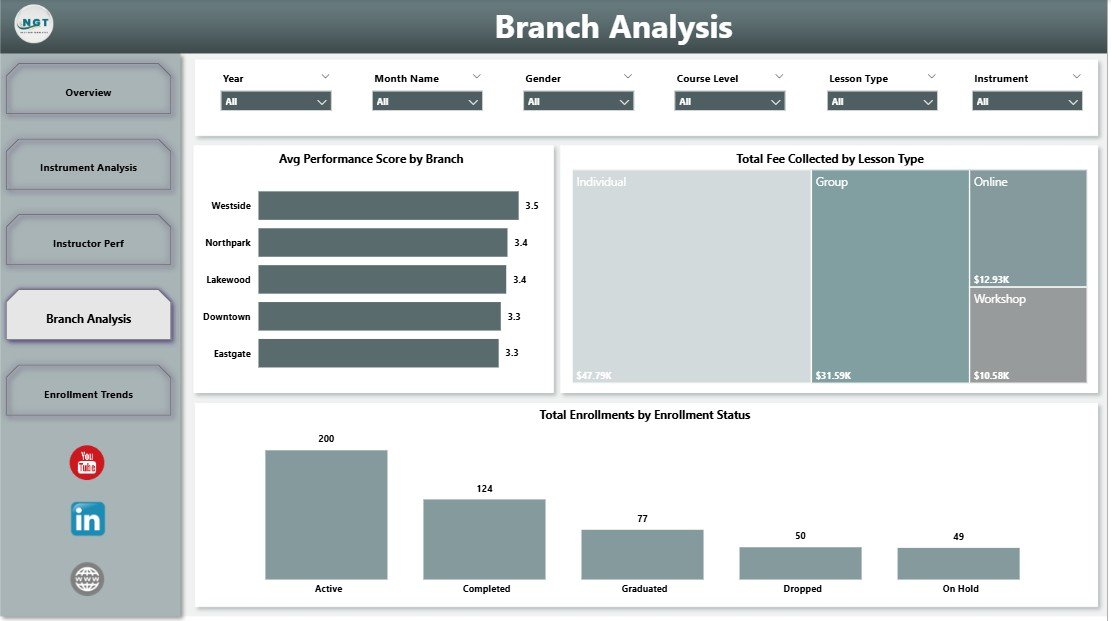
Branch Analysis
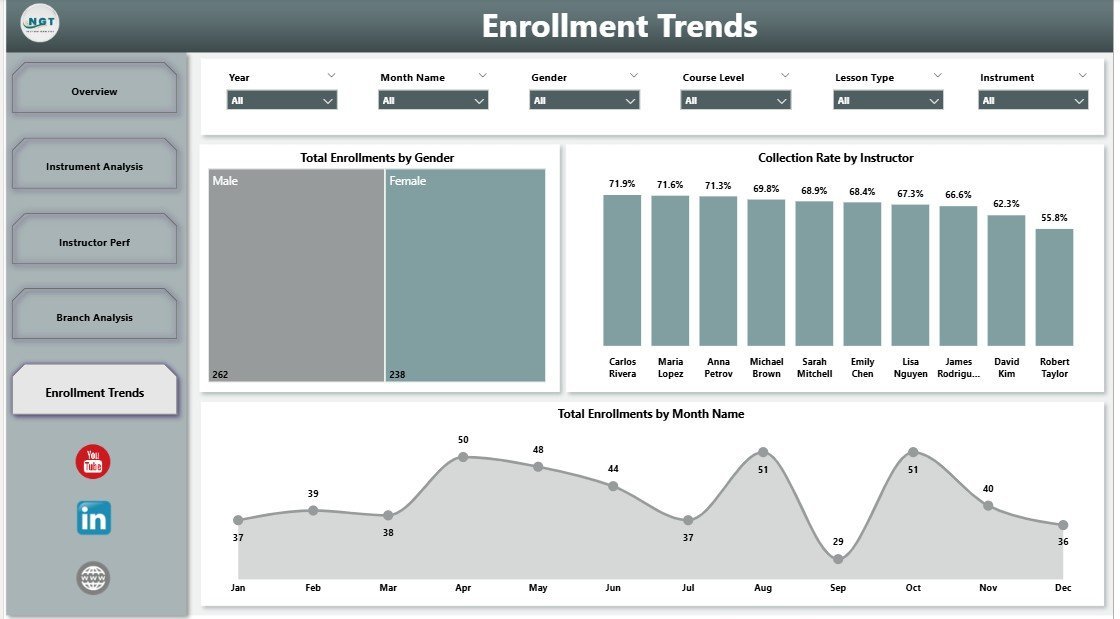
5. Enrollment Trends
Focuses on the enrollment side — gender mix, collection-rate per instructor, and monthly enrollment trend. Designed for owners and marketing leads planning hiring, capacity, and outreach campaigns.
Charts included:
- Total Enrollments by Gender — Splits enrollment by gender so you can refine marketing targeting.
- Collection Rate by Instructor — Shows the percentage of fees collected vs. due per instructor — useful for accountability and follow-up.
- Total Enrollments by Month Name — Trends enrollment month-over-month to forecast capacity and plan campaigns.
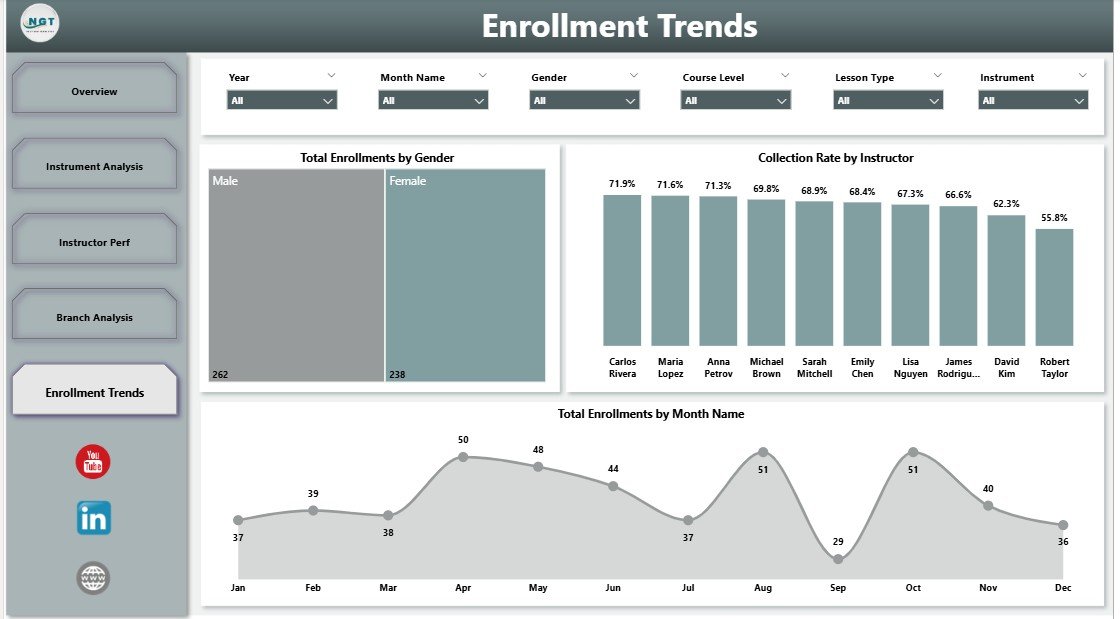
Enrollment Trends
📊 Music School Dashboard Power BI vs. Tableau / Qlik vs. Paid Music-School SaaS
| Feature | Music School Dashboard in Power BI | Tableau / Qlik Alternative | MyMusicStaff / Fons / Music Teacher’s Helper |
|---|---|---|---|
| Cost | $17.99 one-time | $70–$75 / user / month | $19–$59 / month + per-teacher fees |
| Platform | Power BI Desktop (free) | Tableau Desktop or Qlik Sense | Vendor-hosted cloud only |
| Setup time | Under 10 minutes | 2–4 hours for similar build | 3–7 days onboarding |
| Real-time team collaboration | ✅ Via Power BI Service | ✅ With paid Tableau Server | Yes, vendor-locked |
| Mobile access | ✅ Power BI mobile app (free) | ✅ With paid plan | Yes, vendor app |
| Customizable visuals | ✅ Edit any visual, measure, or page | ✅ But requires re-licensing | Limited to vendor options |
| Data ownership | ✅ 100% yours, local .pbix file | ✅ Yes | Vendor-owned cloud database |
| Year-1 cost (5 instructors) | $17.99 | $4,200–$4,500 | $1,140–$3,540 |
| Fee collected vs. fee due tracking | ✅ Built-in by branch and course level | Must build manually | Yes, but vendor-locked |
For music academies and private studios that want full Power BI analytics without paying $19–$59 every month or $70+ per Tableau seat, the Music School Dashboard in Power BI sits in the sweet spot.
👥 Who This Template Is For — and Who It’s Not For
✅ This template is built for:
- Music school owners managing 5–50 instructors and 50–500 active students across 1–5 branches who want a Power BI report instead of Excel
- Independent music instructors comfortable with Power BI Desktop who want a polished dashboard to share with parents or studio partners
- Music academy directors tracking multi-instrument, multi-branch revenue and instructor performance through Power BI Service
- Conservatories and performing arts schools running monthly business reviews with Power BI on the projector
- Excel-using music academies graduating to Power BI for richer interactivity and drill-through
❌ This template is NOT for:
- Music schools needing integrated lesson scheduling with calendar sync, automated parent reminders, and student-portal logins
- Teams without access to Power BI Desktop on Windows (Power BI Desktop is not available for Mac — use the Music School Dashboard in Excel instead)
- Businesses needing automatic Stripe / payment-gateway billing — this is a reporting template, not a billing engine
⚙️ How to Use the Music School Dashboard in Power BI
- Download Power BI Desktop free from Microsoft Learn if you don’t already have it. Power BI Desktop runs on Windows 10/11.
- Open the Music-School-Dashboard-in-Power-BI.pbix file in Power BI Desktop.
- Update the data source to point at your own student-records Excel file using Transform Data → Data Source Settings, keeping the column structure intact.
- Click Refresh in the Home ribbon — every card, chart, and slicer rebuilds automatically across all 5 report pages.
- Use the slicers at the top of each page to filter by instrument, instructor, branch, course level, or year, and Publish to Power BI Service when you want to share the report with co-founders or branch managers.
💼 Real-World Use Cases
Anika runs a 14-instructor music academy in Pune teaching guitar, piano, violin, and drums. She uses the Music School Dashboard in Power BI to review monthly fee collection by branch, identify her highest-rated instructors for retention bonuses, and present quarterly numbers to her co-founder over Power BI Service — replacing a $39/month MyMusicStaff subscription with a one-time $17.99 .pbix file.
James directs operations at a 4-branch performing arts academy. He filters the Music School Dashboard by branch, compares average practice hours and performance scores across locations, and surfaces fee-due gaps to his finance lead — all inside one Power BI report published to the team’s workspace, no per-instructor SaaS charge.
Priya is a freelance Power BI consultant working with three small music schools in the UK. She uses this template as her starting point for every new client engagement, customizing the data model and visuals in 30 minutes instead of building from scratch — the Music School Dashboard in Power BI cut her delivery time per client from 2 days to 4 hours.
❓ Frequently Asked Questions
What does the Music School Dashboard in Power BI track?
The Music School Dashboard in Power BI tracks 5 KPI cards (Total Fee Due, Active Students, Total Fee Collected, Total Enrollments, Dropped Students) and 16 visuals across 5 report pages — Overview, Instrument Analysis, Instructor Performance, Branch Analysis, and Enrollment Trends. Every visual recalculates automatically when you click Refresh in Power BI Desktop.
How does this compare to MyMusicStaff or Fons?
MyMusicStaff and Fons charge $19–$59 per month plus per-teacher fees and lock your data in their cloud. The Music School Dashboard in Power BI is a one-time $17.99 purchase, runs locally in Power BI Desktop, and gives you 100% data ownership. You trade automated scheduling and parent portals for ownership, flexibility, and large cost savings over 3+ years.
How long does setup take?
Setup of the Music School Dashboard in Power BI takes under 10 minutes. Open the .pbix file in Power BI Desktop, point the data source at your own student-records Excel file, click Refresh, and every card and chart on the 5 report pages updates. No DAX measure edits or visual rebuilds needed for typical music academies.
Do I need a Power BI Pro license?
No, not for personal use. Power BI Desktop is free and runs the Music School Dashboard in Power BI fully offline on Windows 10 or 11. You only need a Power BI Pro license ($10/user/month) if you want to publish the report to Power BI Service and share it across your music school team.
Can I add my own instruments, instructors, or branches?
Yes. The Music School Dashboard in Power BI uses an Excel data source, so any new instrument, instructor, branch, or course level you add to the source file is picked up automatically after clicking Refresh. The data model auto-detects new categorical values without any visual or measure rebuild.
Is the Music School Dashboard a one-time purchase?
Yes — the Music School Dashboard in Power BI is a one-time $17.99 purchase with instant download. There is no subscription, no per-student fee, and no renewal charge. Use the template on unlimited devices within your business and keep using it as long as Microsoft supports Power BI Desktop.
Does this dashboard work on Mac?
Power BI Desktop is Windows-only, so the Music School Dashboard in Power BI runs on Windows machines. Mac users can either run Power BI Desktop in a Windows VM, view published reports through the browser-based Power BI Service, or use the Excel version of the Music School Dashboard, which runs natively on Excel for Mac.
👤 About the Author
Built by PK — Microsoft Certified Professional with 15+ years of Excel, Google Sheets, and Power BI experience. Founder of NextGenTemplates, reaching 300K+ subscribers across YouTube channels (@PK-AnExcelExpert, @NextGenTemplates, @NeoTechNavigators). Every template is hand-built and tested before release.
🔗 Explore Related Templates
- Also available as: Music School Dashboard in Excel — same KPIs, pivot-driven, runs on Excel for Windows or Mac.
- Tutoring Business Dashboard in Power BI — adjacent education vertical with the same Power BI architecture.
- Tutoring Business Dashboard in Excel — Excel sibling for academies running both music and tutoring tracks.
- Browse the full Power BI Dashboard Templates category for more business reports built in Power BI.
📖 Click here to read the Detailed Blog Post
🎥 Visit our YouTube channel for step-by-step video tutorials
👉 YouTube.com/@NextGenTemplates


Reviews
There are no reviews yet.