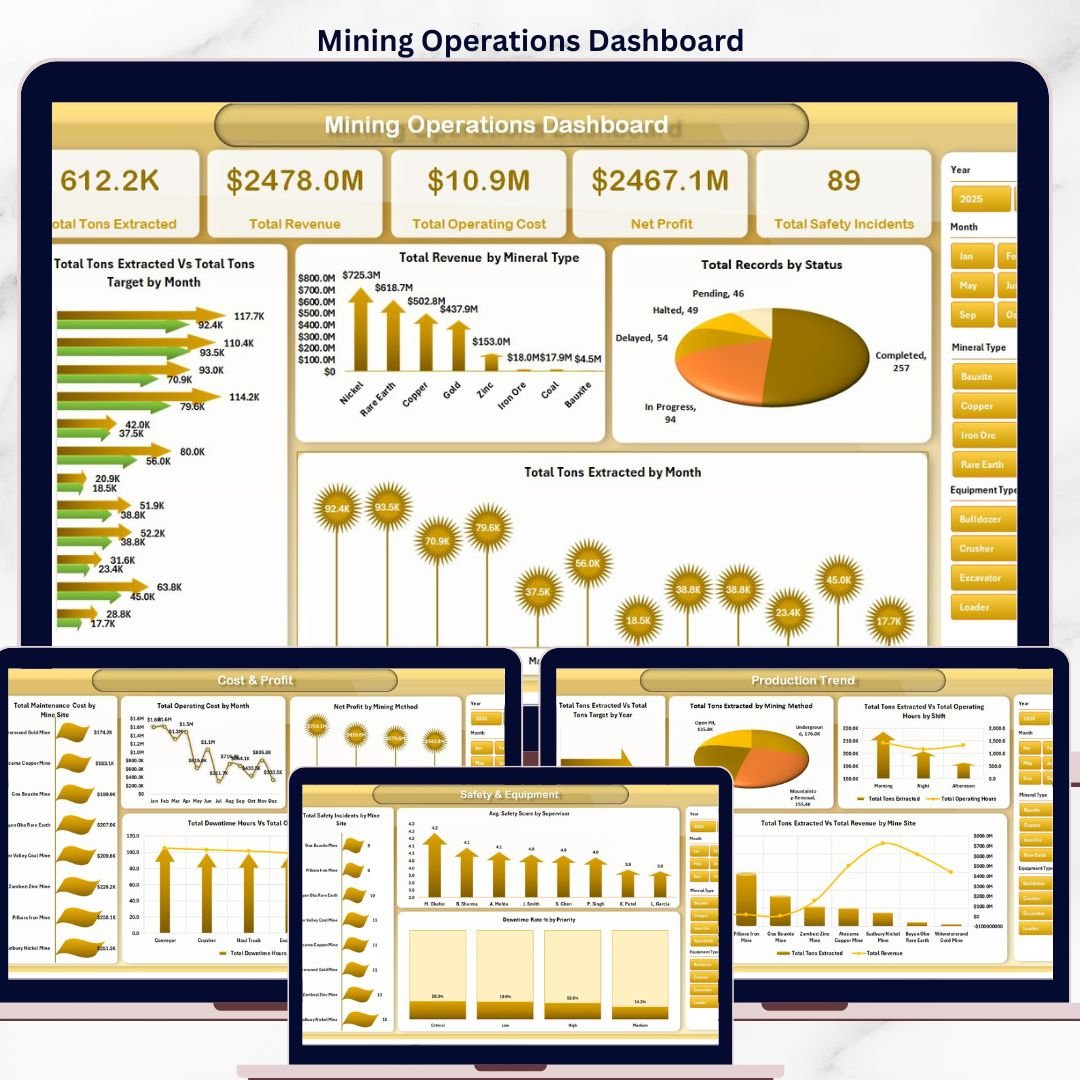


The Mining Operations Dashboard in Excel tracks 5 critical KPIs across 5 interactive analysis pages, with 15+ pre-built pivot charts and dynamic slicers for filtering by mine site, mineral type, mining method, and shift. Setup takes under 10 minutes — replace the sample data with your own production records and every chart, KPI card, and metric updates automatically across the entire workbook.
🌍 Join 8,400+ teams in 40+ countries using NextGenTemplates to replace paid SaaS tools with one-time-purchase Excel, Google Sheets, Power BI, and HTML templates.
✅ Instant download · One-time payment · No subscription · No per-user fees · Lifetime access
 Mining Operations Dashboard
🔑 Key Features of Mining Operations Dashboard in Excel
📊 5 Dedicated Analysis Pages — Overview, Production Trend, Site Analysis, Cost & Profit, and Safety & Equipment — each focused on a different layer of mine performance.
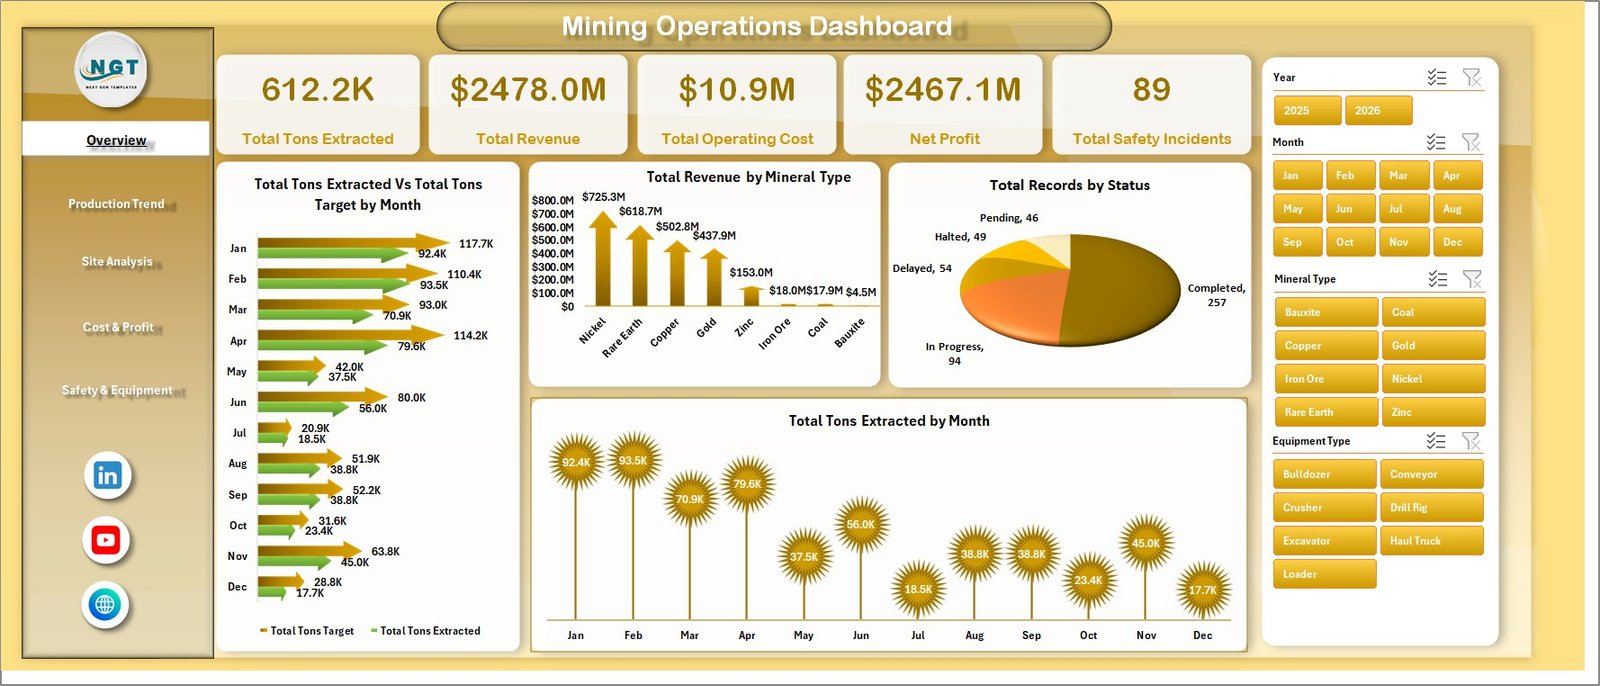
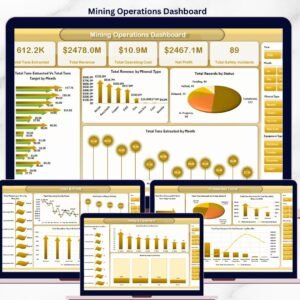
⛏️ 5 KPI Cards on the Overview Page tracking Total Tons Extracted, Total Revenue, Total Operating Cost, Net Profit, and Total Safety Incidents at a single glance for executive reviews.
🎯 Dynamic Slicers for filtering by mine site, mineral type, mining method, region, supervisor, and shift — every chart on every page reacts instantly when a slicer is clicked.
📈 Pivot-Powered Charts for Tons Extracted vs Target by Month, Revenue by Mineral Type, Profit Margin % by Mineral Type, Target Achievement % by Mine Site, and 11 more analysis views.
💰 Cost vs Profit Analytics covering Maintenance Cost by Mine Site, Operating Cost by Month, Net Profit by Mining Method, and Fuel vs Labor Cost comparisons by mineral type.
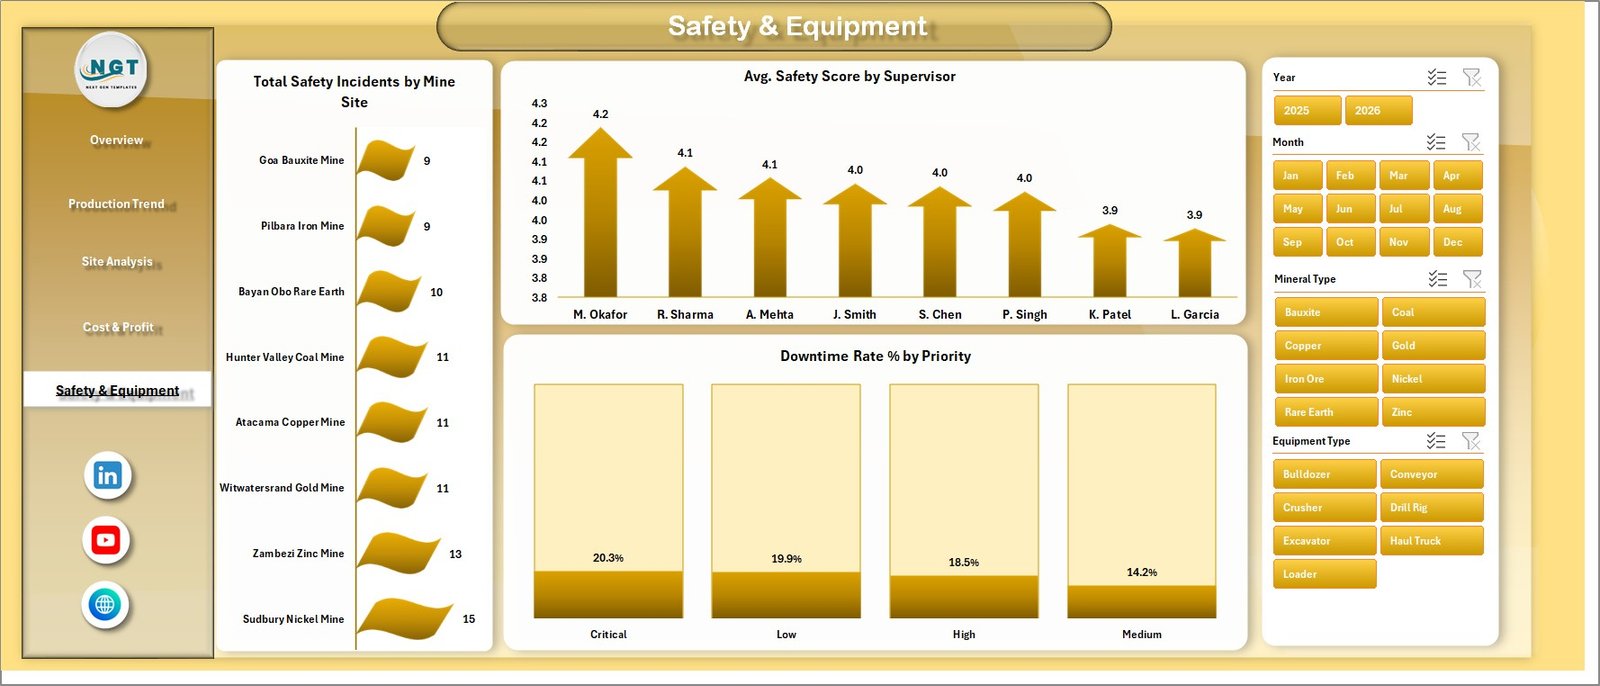
🦺 Safety & Equipment Monitoring with Total Safety Incidents by Mine Site, Avg. Safety Score by Supervisor, Downtime Rate % by Priority, and Operating Hours vs Downtime tracking.
🧩 100% Excel-Based Solution — no macros, no add-ins, no external connections required. Works in Excel 2016, 2019, 2021, 365, and Excel for the web.
🔄 Refresh-All Workflow — update the data sheet, click Data → Refresh All, and every pivot table, chart, and KPI updates automatically.
📦 What’s Inside the Mining Operations Dashboard
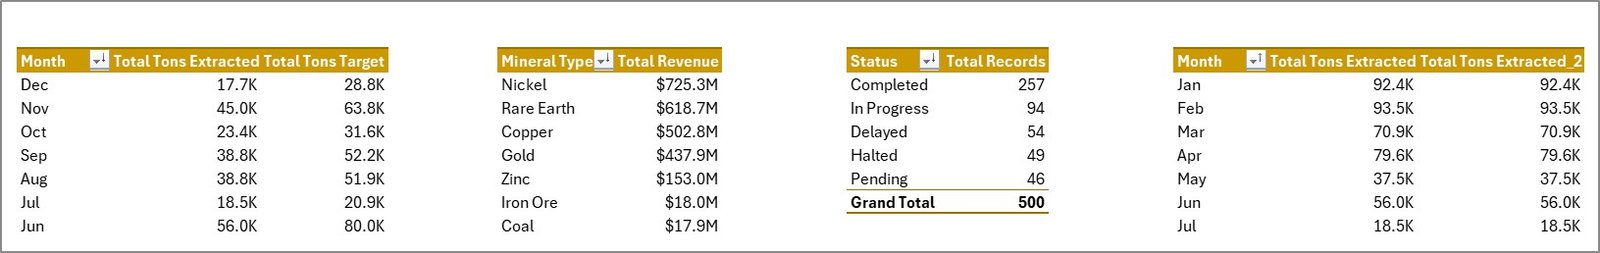
📊 Overview Page — Executive summary showing Total Tons Extracted, Total Revenue, Total Operating Cost, Net Profit, and Total Safety Incidents as KPI cards. Charts include Total Tons Extracted vs Total Tons Target by Month, Total Revenue by Mineral Type, Total Records by Status, and Total Tons Extracted by Month.
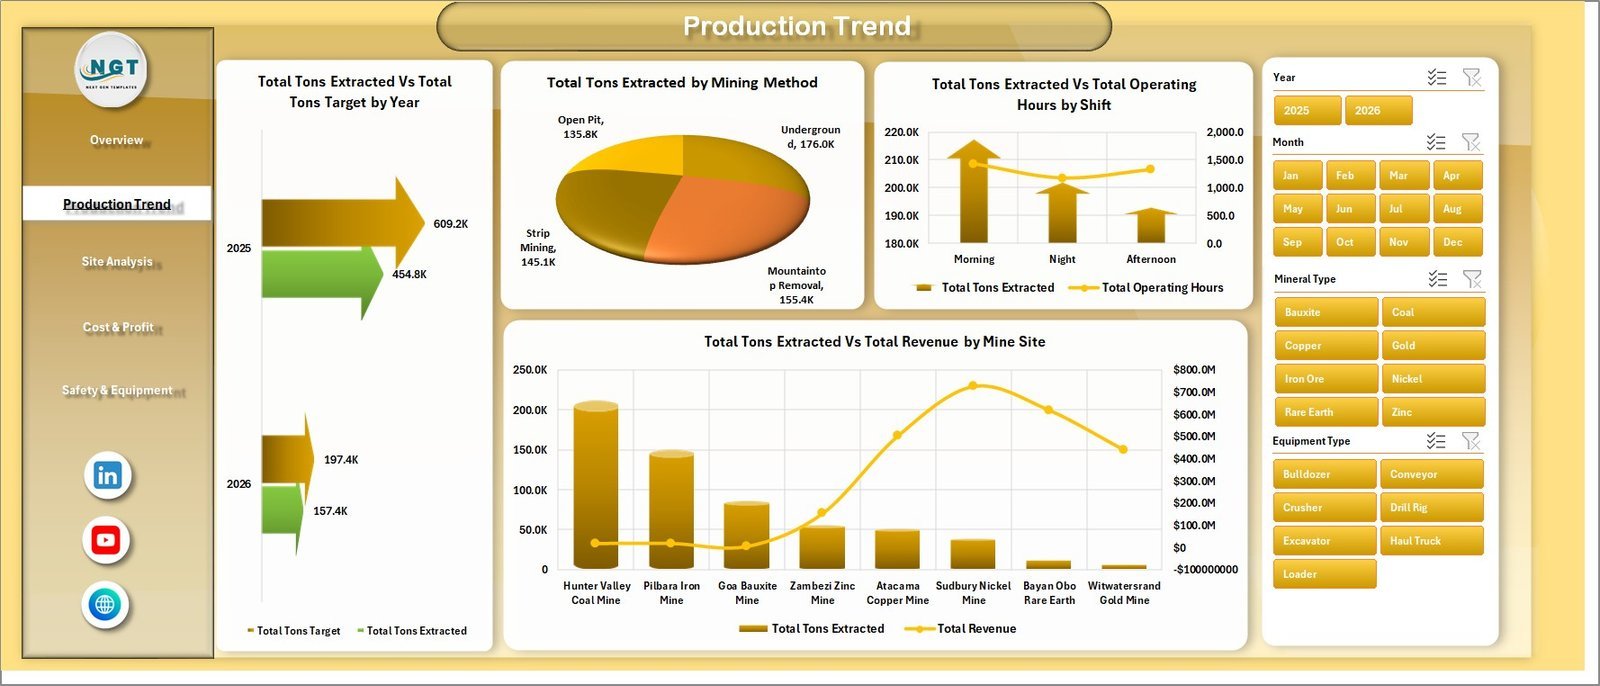
 Production Trend
📈 Production Trend Page — Year-on-year production analysis with Total Tons Extracted vs Total Tons Target by Year, Total Tons Extracted by Mining Method (open-pit, underground, surface), Total Tons Extracted vs Total Operating Hours by Shift, and Total Tons Extracted vs Total Revenue by Mine Site.
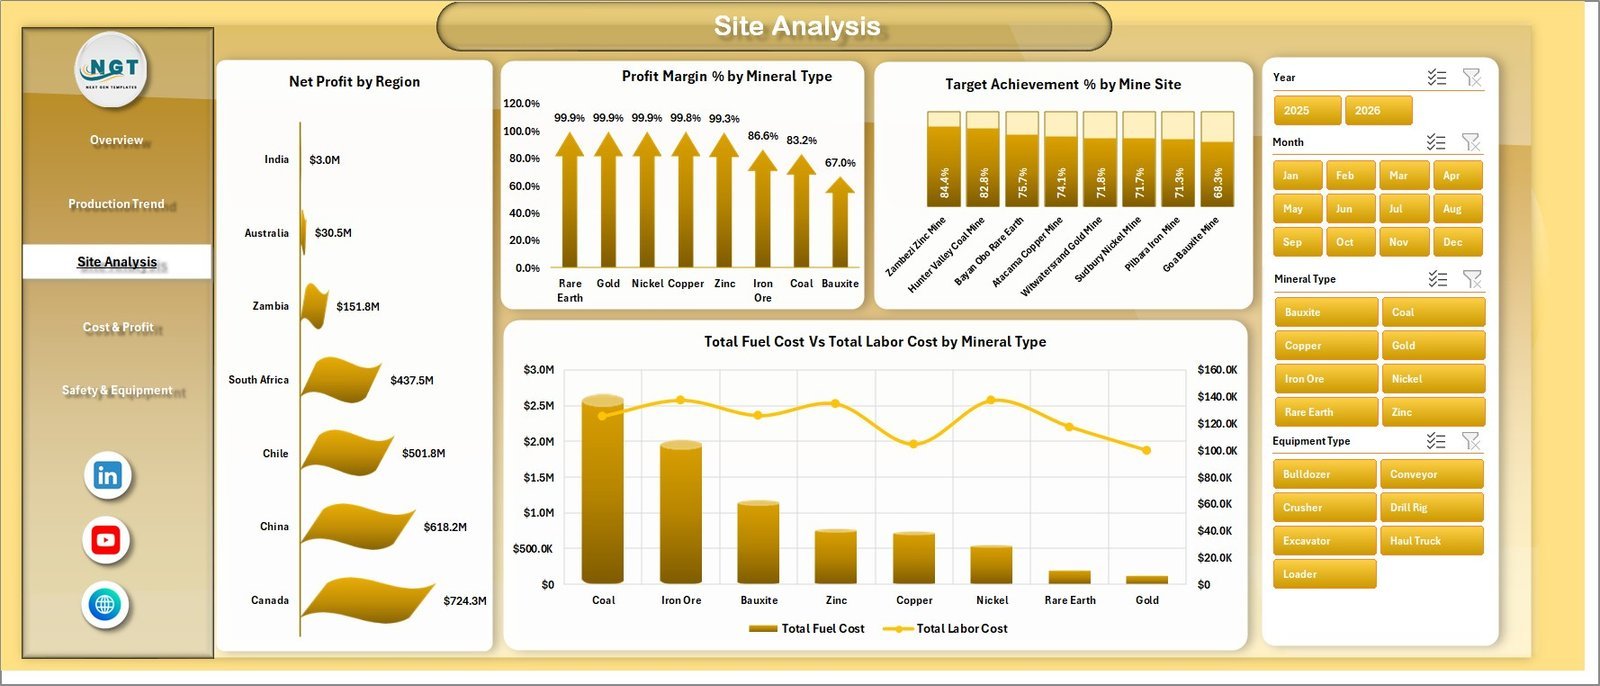
 Site Analysis
🌍 Site Analysis Page — Profitability and target tracking by region: Net Profit by Region, Profit Margin % by Mineral Type, Target Achievement % by Mine Site, and Total Fuel Cost vs Total Labor Cost by Mineral Type.
 Cost & Profit
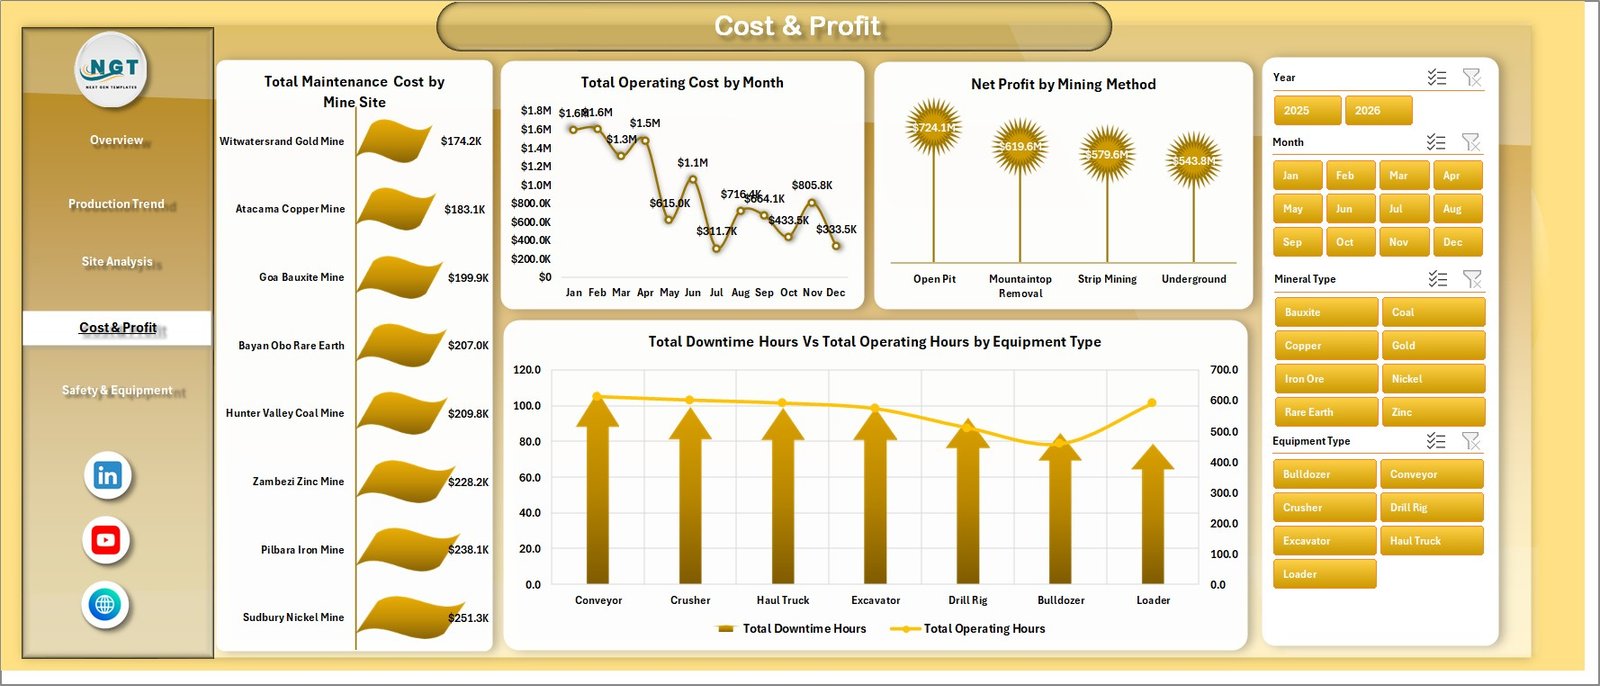
💰 Cost & Profit Page — Drill into spend and profitability with Total Maintenance Cost by Mine Site, Total Operating Cost by Month, Net Profit by Mining Method, and Total Downtime Hours vs Total Operating Hours by Equipment Type.
 Safety & Equipment
🦺 Safety & Equipment Page — Total Safety Incidents by Mine Site, Avg. Safety Score by Supervisor, and Downtime Rate % by Priority for proactive risk management.
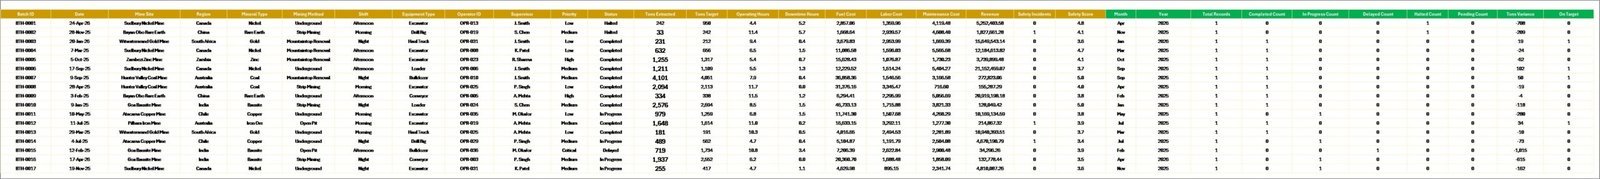
 Data Sheet tab
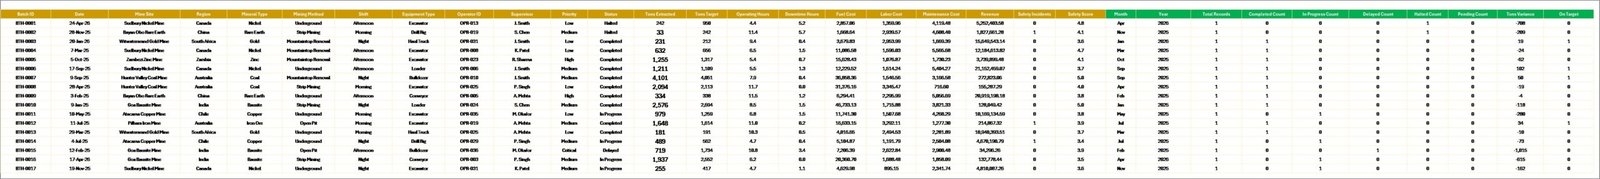
🗃️ Data Sheet — Single source of truth where you replace the sample mining records with your own data in the same column format.
 Support sheet tab
⚙️ Support Sheet — Hidden engine room containing all pivot tables that drive the dashboard. Click Data → Refresh All to push fresh numbers across every page.
📊 Mining Operations Dashboard in Excel vs. Google Sheets vs. Paid Mining Software — Where This Fits
| Feature | Mining Operations Dashboard in Excel | Google Sheets Equivalent | MineSight / Deswik / Surpac |
|---|---|---|---|
| Cost | $17.99 one-time | Free–$15/user/month | $15,000–$80,000 license + maintenance |
| Platform | Microsoft Excel (offline-first) | Google Sheets (cloud only) | Desktop client + database server |
| Setup time | Under 10 minutes | 15–30 minutes | 4–12 weeks of consultant onboarding |
| Real-time team collaboration | Via OneDrive / SharePoint | ✅ Native multi-user | ✅ Database-backed |
| Mobile access | Excel mobile app | ✅ Browser + app | Limited |
| Customizable fields | ✅ Full control over columns & KPIs | ✅ Full | Restricted to vendor schema |
| Tons / cost / safety in one view | ✅ Built-in | Build it yourself | ✅ But fragmented across modules |
| Year-1 cost at 5 users | $17.99 (one purchase) | $900 | $20,000+ |
| IT approval required | ❌ None | Workspace admin | Enterprise procurement cycle |
For mining and quarry teams that want production, cost, and safety insights without paying enterprise software fees, the Mining Operations Dashboard in Excel sits in the sweet spot.
👥 Who This Template Is For — and Who It’s Not For
✅ This template is built for:
- Mine site managers and operations supervisors at small- to mid-size mining companies (1–10 sites)
- Quarry, aggregate, and surface mining operators tracking tons extracted vs targets monthly
- Mining accountants and CFOs reviewing fuel, labor, and maintenance cost trends
- Safety officers monitoring incidents, near-misses, and downtime by site or supervisor
- Mining consultants who need a portable reporting deck for client engagements
❌ This template is NOT for:
- Large multinational miners that require integrated ERP, fleet telematics, and SCADA feeds
- Teams that need real-time IoT sensor data from haul trucks or drills
- Compliance-heavy environments requiring SOC 2, audit trails, and immutable change logs
⚙️ How to Use the Mining Operations Dashboard in Excel
- Download the .zip file and unzip it on your local drive.
- Open the workbook in Microsoft Excel 2016 or later.
- Go to the Data Sheet tab and replace the sample records with your own mining data in the same column format.
- Click Data → Refresh All in the Excel ribbon — every pivot, chart, and KPI card updates instantly.
- Use the slicers on each page to filter by mine site, mineral type, shift, or supervisor.
- Save the file to OneDrive or SharePoint to share read-only views with leadership.
💼 Real-World Use Cases
Carlos manages two open-pit copper mines in Chile. He uses the Mining Operations Dashboard in Excel to compare monthly tons extracted against quarterly targets, identify which shift has the highest downtime, and present cost-per-ton trends to ownership during board reviews — without paying $20,000 a year for enterprise mining software.
Priya runs operations at a limestone quarry in Rajasthan. She replaces the sample data with daily production logs from her three pits each Friday, then uses slicers to compare fuel cost vs labor cost by mineral type and spot anomalies before they become budget overruns.
Daniel is a safety officer at a coal mine in Queensland. He tracks safety incidents by mine site, average safety score by supervisor, and downtime rate by priority — turning a 4-hour weekly reporting task into a 20-minute dashboard refresh he emails to the HSE committee.
❓ Frequently Asked Questions
What KPIs does the Mining Operations Dashboard in Excel track?
The Mining Operations Dashboard in Excel tracks 5 headline KPIs (Total Tons Extracted, Total Revenue, Total Operating Cost, Net Profit, Total Safety Incidents) plus 15+ chart-level metrics covering production, mineral mix, mining method, cost structure, target achievement, and safety performance.
Do I need macros, VBA, or Power Query for this dashboard?
No. The Mining Operations Dashboard in Excel is built entirely on native pivot tables, pivot charts, and slicers. No macros, no VBA, no Power Query, and no add-ins are required, which makes it usable in locked-down corporate Excel environments.
How long does setup take?
Under 10 minutes. Open the file, replace the sample rows in the Data Sheet with your own production records (same column structure), and click Data → Refresh All. Every chart, KPI card, and slicer updates automatically across all 5 dashboard pages.
How does this compare to MineSight or Deswik?
MineSight and Deswik are full mine-planning suites costing $15,000+ per license. The Mining Operations Dashboard in Excel is a $17.99 one-time-purchase reporting layer for tons, cost, profit, and safety — it complements those tools rather than replacing geotechnical modeling.
Can I add more mine sites or mineral types?
Yes. The Mining Operations Dashboard in Excel adapts to any number of mine sites, mineral types, mining methods, or supervisors. Just add new rows to the Data Sheet and refresh — the slicers and pivots automatically pick up new categories without any rebuild.
Will this work in Excel for Mac and Excel for the web?
Yes. The Mining Operations Dashboard in Excel is fully compatible with Excel 2016+ on Windows and Mac, and with Excel for the web (Microsoft 365). Slicer visuals and pivot refresh behave identically across all three platforms.
👤 About the Author
Built by PK — Microsoft Certified Professional with 15+ years of Excel, Google Sheets, and Power BI experience. Founder of NextGenTemplates, reaching 300K+ subscribers across YouTube channels (@PK-AnExcelExpert, @NextGenTemplates, @NeoTechNavigators). Every template is hand-built and tested before release.
🔗 Explore Related Templates
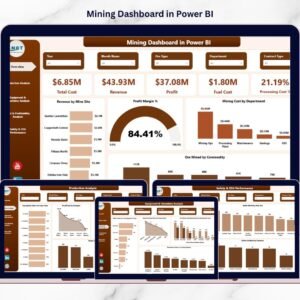
Looking for cross-platform variants of this template? The same dataset is also available as the Mining Dashboard in Power BI for teams already using Microsoft Fabric, and as the Mining Dashboard in Google Sheets for teams that prefer cloud collaboration.
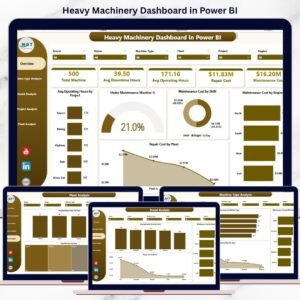
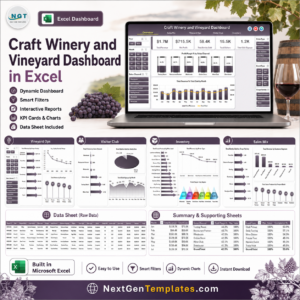
Pair it with the Mining Safety KPI Dashboard in Google Sheets for deeper HSE tracking, or the Heavy Machinery Dashboard in Excel for equipment-level cost and downtime analytics. Browse all Excel Dashboard Templates for more.
📖 Click here to read the Detailed Blog Post
🎥 Visit our YouTube channel for step-by-step video tutorials
👉 YouTube.com/@NextGenTemplates
Watch the step-by-step video tutorial:


Reviews
There are no reviews yet.