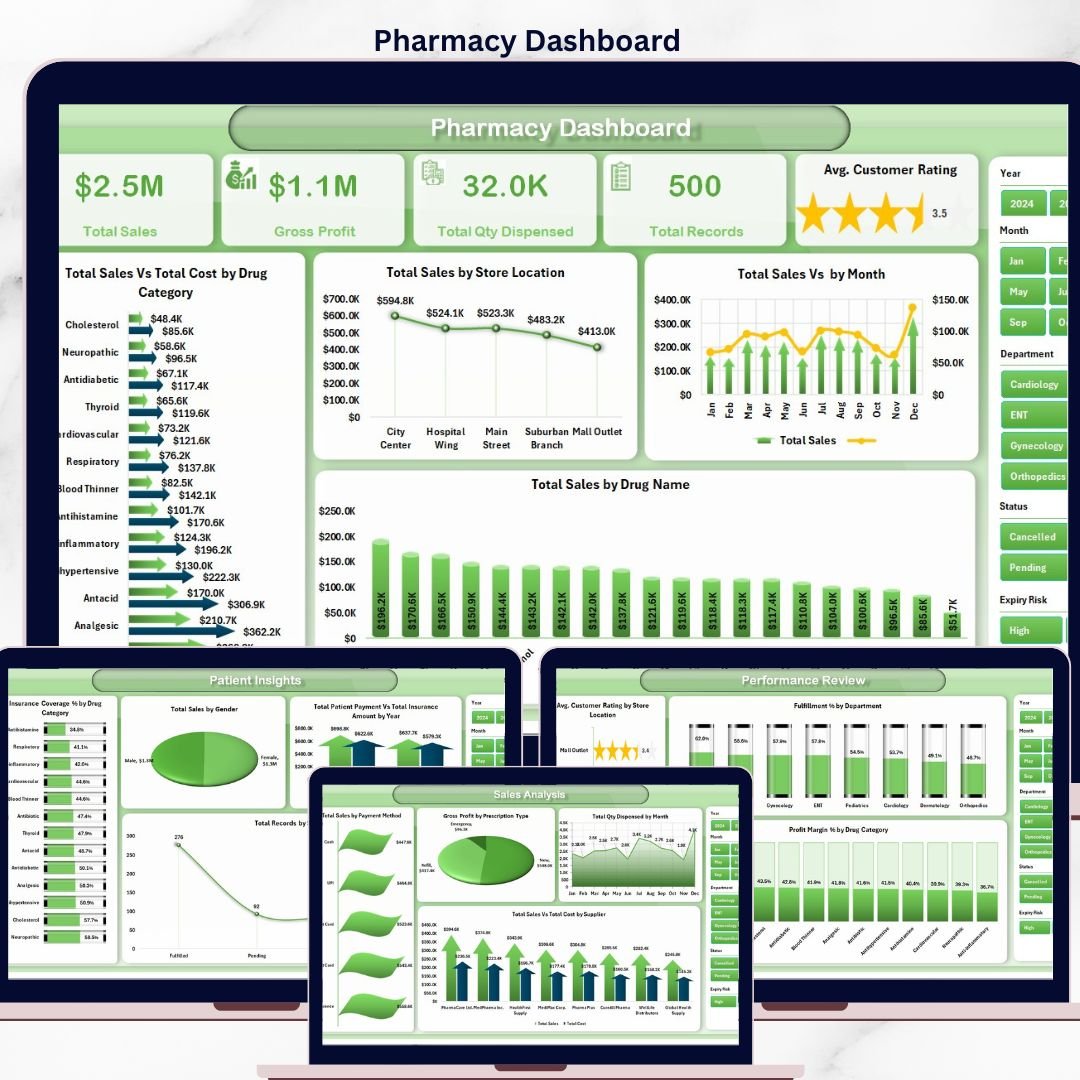

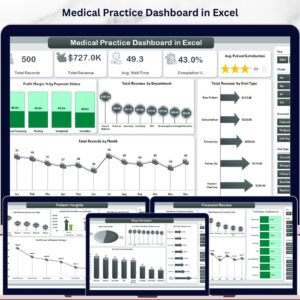
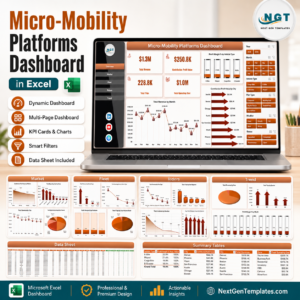
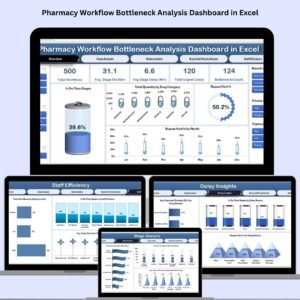
The Pharmacy Dashboard in Excel tracks 5 high-level KPIs — Total Sales, Gross Profit, Total Quantity Dispensed, Total Records, and Average Customer Rating — across 5 interactive analysis pages, 15+ pre-built pivot-driven charts, and multiple slicer filters for drug category, store location, payment method, and department. Setup takes under 10 minutes: paste your pharmacy data into the Data sheet, click Data → Refresh All, and every page updates automatically.
🌍 Join 8,400+ teams in 40+ countries using NextGenTemplates to replace $50–$200 per month pharmacy management SaaS tools with one-time-purchase Excel, Google Sheets, Power BI, and HTML templates.
✅ Instant download · One-time payment · No subscription · No per-user fees · Lifetime access
Pharmacy Dashboard
🔑 Key Features of Pharmacy Dashboard in Excel
🔹 5 interactive analysis pages plus Data and Support sheets — Overview, Sales Analysis, Inventory and Supply, Patient Insights, and Performance Review, backed by a raw Data sheet and a hidden Support sheet containing every pivot table that drives the dashboard.
🔹 Multi-dimensional slicer filtering on every page — Filter instantly by Drug Category, Store Location, Payment Method, Department, Prescription Type, and Month without writing a single formula.
🔹 Pivot-table driven architecture — All 15+ charts refresh automatically after clicking Data → Refresh All. No manual chart rebuilding, no broken cell references when you add new rows.
🔹 Built for every pharmacy format — Works for a single neighborhood pharmacy, a regional retail chain, a hospital in-patient dispensary, or a specialty compounding pharmacy with multi-store and multi-department tracking.
🔹 5 Overview KPI cards visible at a glance — Total Sales, Gross Profit, Total Quantity Dispensed, Total Records, and Average Customer Rating refresh with every filter click so stakeholders see the headline numbers immediately.
🔹 Cost vs. revenue visibility by category and supplier — The dashboard compares Total Sales against Total Cost at both the drug-category and supplier level, so you can spot thin-margin categories before they erode profitability.
🔹 Expiry-risk and inventory signals — The Inventory and Supply page surfaces Total Records by Expiry Risk and quantity-dispensed patterns by store, helping reduce write-offs from expired stock.
🔹 Patient and insurance analytics built in — The Patient Insights page tracks Insurance Coverage percentage by drug category, Patient Payment vs. Insurance Amount year-over-year, and sales by gender and prescription status.
🔹 100% Excel-native — no add-ins required — Works in Microsoft Excel 2016, 2019, 2021, and Microsoft 365. Opens in Excel for Mac and Excel Online (read-only on Online).
🔹 Free lifetime updates — Any structural improvement to the template is shared with all past buyers at no additional cost.
📦 What’s Inside the Pharmacy Dashboard in Excel
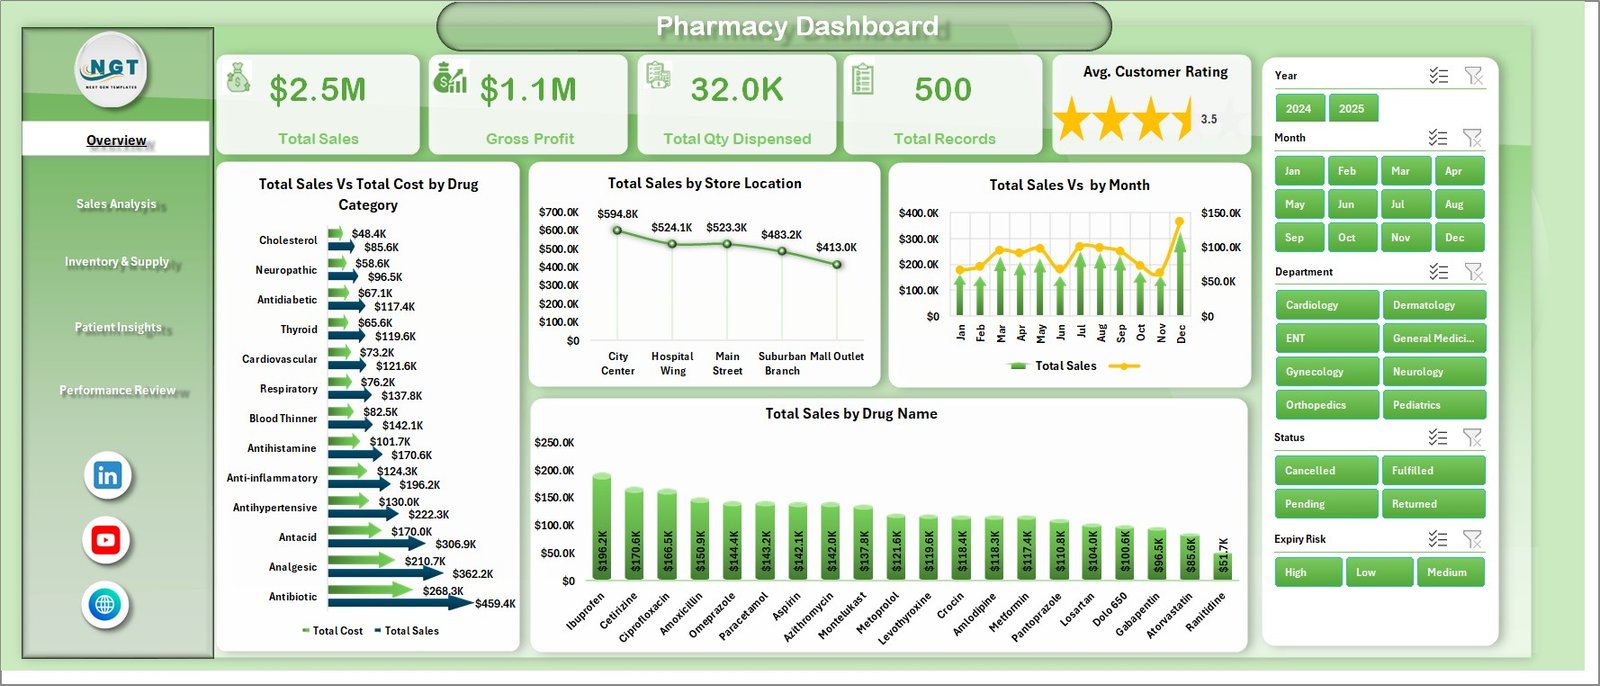
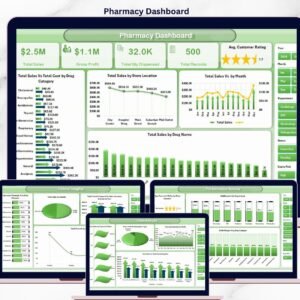
1. Overview Page
The landing page opens with 5 KPI cards — Total Sales, Gross Profit, Total Quantity Dispensed, Total Records, and Average Customer Rating — followed by slicers that filter every chart on the page.
- Total Sales Vs Total Cost by Drug Category: Plots revenue and cost side-by-side for each drug category so you can spot thin-margin categories at a glance.
- Total Sales by Store Location: Compares revenue across every pharmacy store, highlighting the best and worst-performing locations so district managers know where to focus coaching.
- Total Sales by Month: Tracks monthly sales trend across the year, surfacing seasonal demand patterns like flu-season surges or summer dips.
- Total Sales by Drug Name: Ranks the top-selling drugs by revenue so you know exactly which SKUs are driving the top line and which ones to promote.
Pharmacy Dashboard
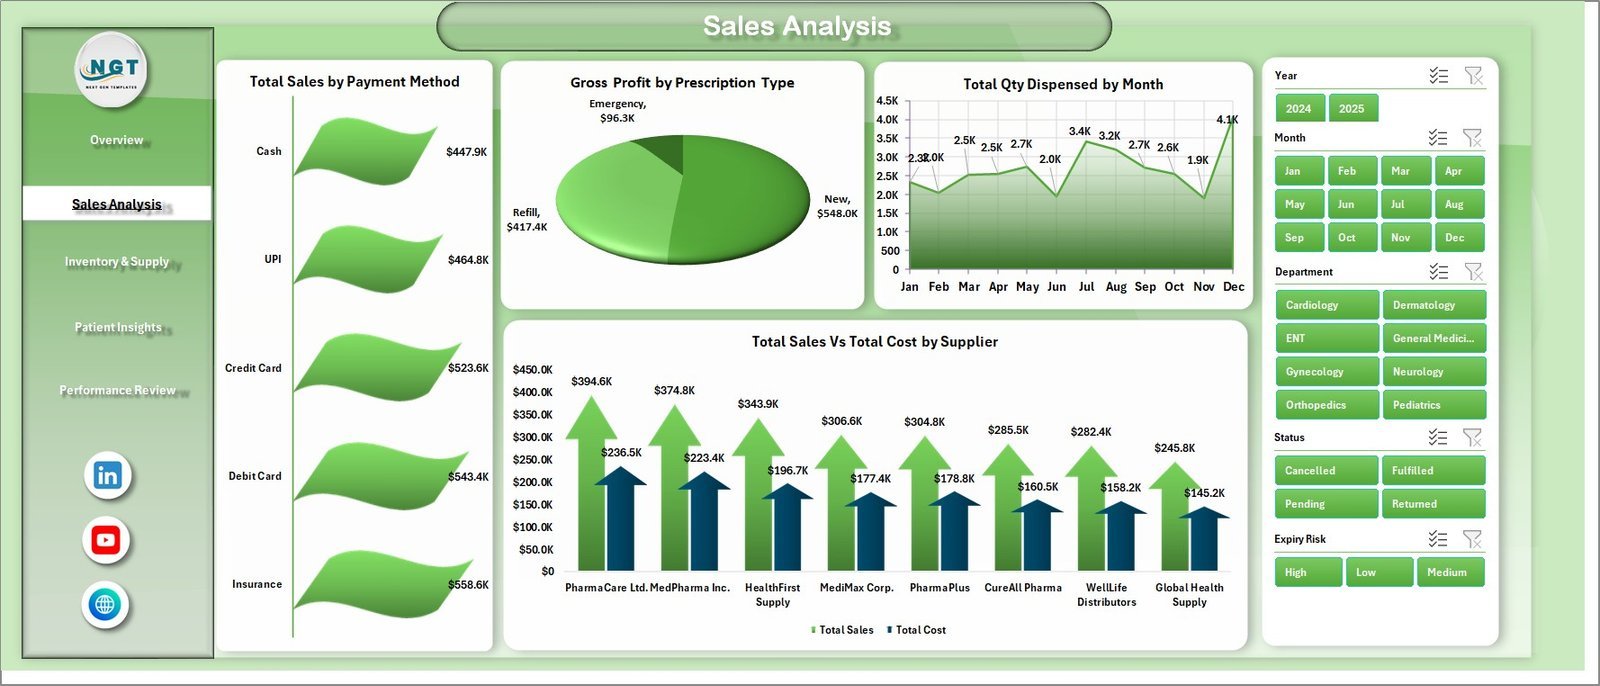
2. Sales Analysis Page
This page drills one level deeper into revenue patterns, looking at how sales break down by payment method, prescription type, and supplier.
- Total Sales by Payment Method: Reveals the split between Cash, Card, Insurance, and Online payments — critical for planning cash-flow and reconciling deposits.
- Gross Profit by Prescription Type: Shows which prescription categories (Rx, OTC, Refill, Compound) produce the most gross profit, not just top-line revenue.
- Total Qty Dispensed by Month: Tracks dispensing volume month by month to spot workload spikes that need staffing adjustments.
- Total Sales Vs Total Cost by Supplier: Compares what you pay each supplier against what you earn from the drugs they supply — direct input to annual contract negotiations.

Sales Analysis Page
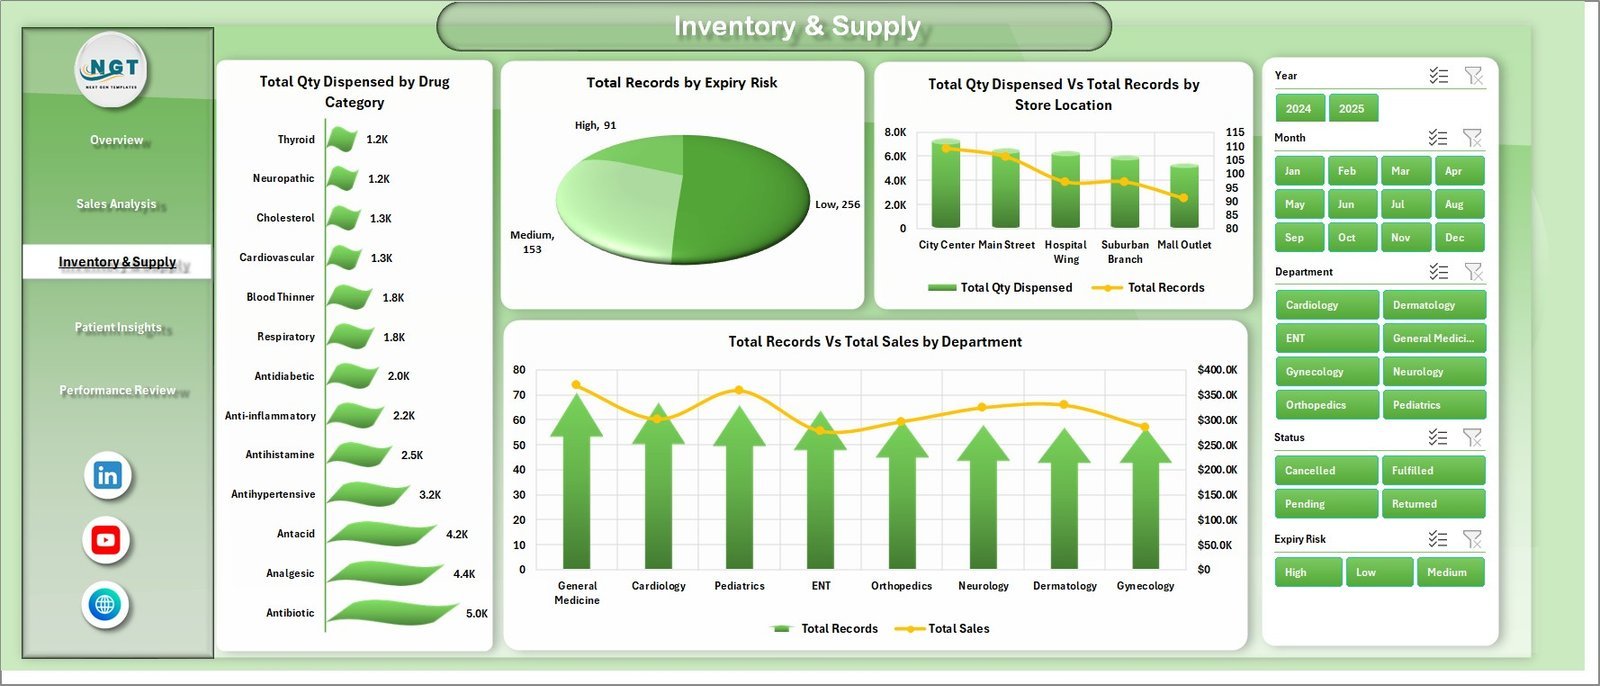
3. Inventory and Supply Page
The Inventory and Supply page focuses on operational health: what moved, what is sitting too long, and where expiry risk is highest.
- Total Qty Dispensed by Drug Category: Identifies the highest-velocity categories (e.g., antibiotics vs. cardiac vs. respiratory) so reorder points are right-sized.
- Total Records by Expiry Risk: Buckets inventory into Low, Medium, and High expiry risk — the single best view to prevent write-offs.
- Total Qty Dispensed Vs Total Records by Store Location: Compares dispensing activity against record counts per store, useful for spotting locations with stockouts or slow-moving inventory.
- Total Records Vs Total Sales by Department: Shows department-level throughput versus revenue — e.g., whether your Compounding department is pulling its weight.

Inventory and Supply Page
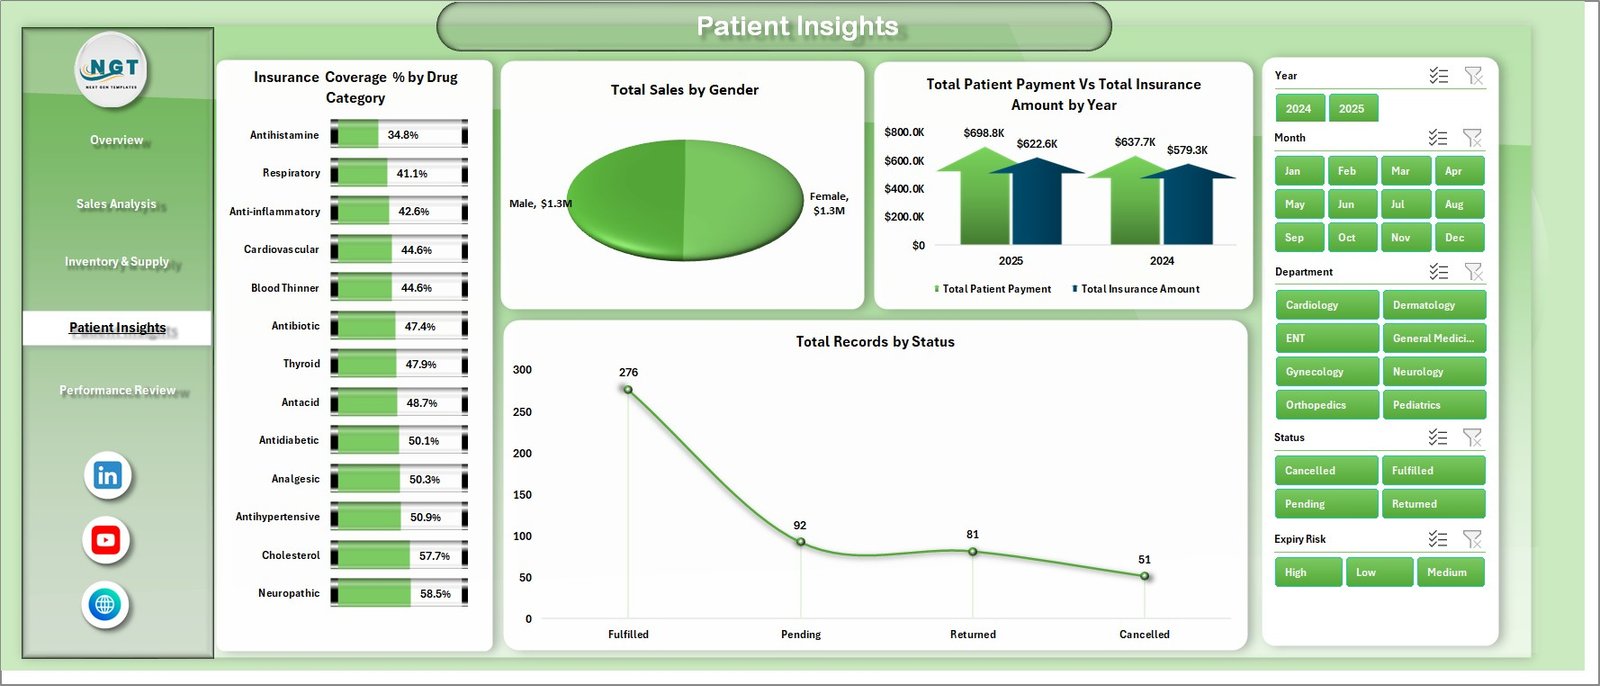
4. Patient Insights Page
The Patient Insights page turns transactional data into demographic and insurance intelligence, useful for both clinical review and marketing.
- Insurance Coverage % by Drug Category: Shows what share of each drug category is paid by insurance versus out-of-pocket — drives pricing and formulary conversations.
- Total Sales by Gender: Splits revenue by patient gender to inform targeted health campaigns.
- Total Patient Payment Vs Total Insurance Amount by Year: Tracks how the payer mix is shifting year-over-year between self-pay and insurance reimbursement.
- Total Records by Status: Surfaces records by status (Completed, Pending, Cancelled, Refunded) so the team can chase open or exception items.
Patient Insights Page
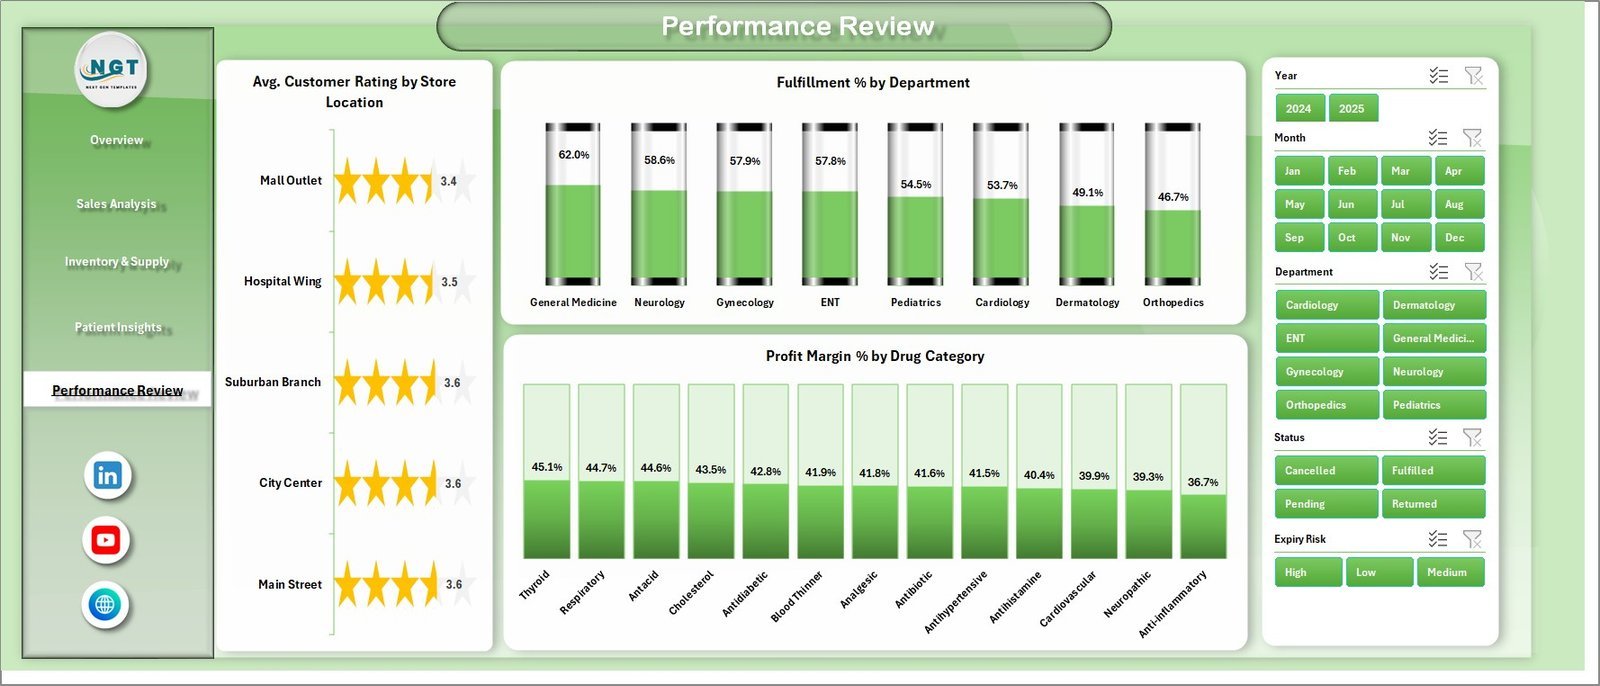
5. Performance Review Page
The Performance Review page benchmarks store and department performance on customer experience, fulfillment, and profitability.
- Avg. Customer Rating by Store Location: Ranks every store by average customer rating — directly tied to retention and word-of-mouth.
- Fulfillment % by Department: Tracks the percentage of prescriptions filled on time per department, the single best operational KPI for a busy pharmacy.
- Profit Margin % by Drug Category: Calculates gross-profit margin by drug category — essential for purchasing decisions and category management.

Performance Review Page
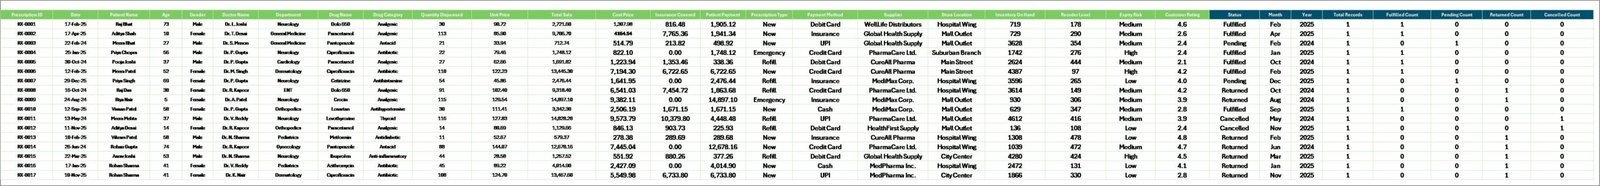
6. Data Sheet Tab
The Data Sheet is where you paste your pharmacy transaction records in the exact format shown in the sample. Every pivot table reads from this one sheet, so there is no dual-maintenance.
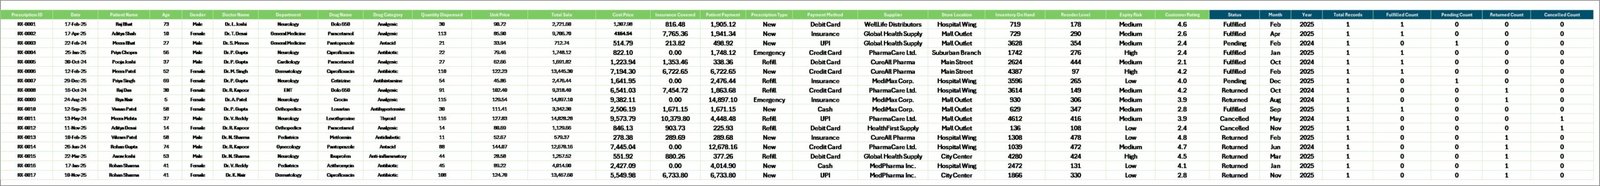
Data Sheet tab
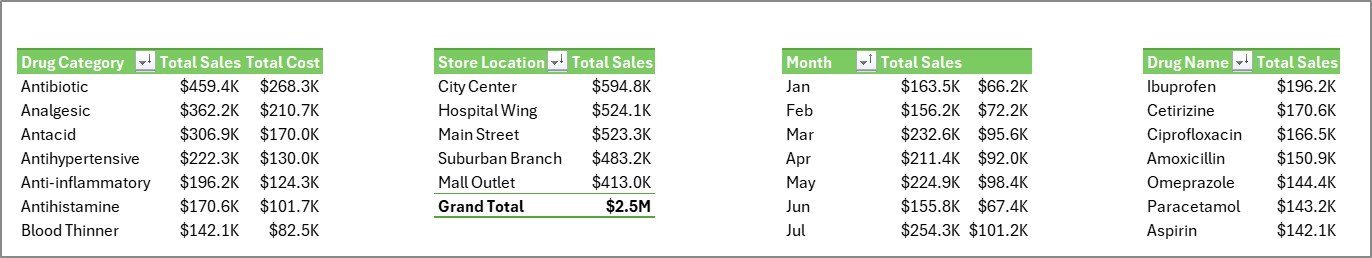
7. Support Sheet Tab
The Support Sheet houses all pivot tables that power the dashboard. After updating the Data sheet, go to the Data tab on the Excel ribbon and click Refresh All — every pivot and every chart rebuilds automatically. This sheet can be kept hidden from end users.

Support sheet tab
📊 Pharmacy Dashboard in Excel vs. Google Sheets Equivalent vs. Paid Pharmacy SaaS — Where This Fits
| Feature | Pharmacy Dashboard in Excel | Google Sheets Equivalent | Paid Pharmacy SaaS (PioneerRx / RxSafe / BestRx) |
|---|---|---|---|
| Cost | $17.99 one-time ✅ | $9.99–$19.99 one-time | $99–$499 / user / month |
| Platform | Microsoft Excel (offline-ready) ✅ | Google Sheets (cloud-only) | Proprietary web app |
| Setup time | Under 10 minutes ✅ | Under 10 minutes | 2–8 weeks onboarding |
| Analysis pages | 5 interactive pages + Data + Support ✅ | 5 pages | 15+ pre-built reports |
| Pivot-driven filtering | Native Excel slicers ✅ | Query formulas / filter views | Built-in |
| Custom KPIs | Fully editable formulas ✅ | Fully editable | Limited without paid tier |
| Mobile access | Excel mobile app ✅ | Google Sheets mobile ✅ | Dedicated app |
| Year-1 cost (5 users) | $17.99 total ✅ | $19.99 total | $5,940–$29,940 |
| Data ownership | Local .xlsx file you control ✅ | Google Drive | Vendor cloud |
For pharmacies that want a sales-and-inventory analytics layer without paying thousands per year in SaaS fees, the Pharmacy Dashboard in Excel sits in the sweet spot.
👥 Who This Template Is For — and Who It’s Not For
✅ This template is built for:
- Independent pharmacy owners running 1–20 stores who want monthly sales and inventory visibility without buying pharmacy-management SaaS.
- Regional pharmacy chain managers who need a single-file performance review template across stores, departments, and drug categories.
- Hospital in-patient pharmacy leads tracking dispensing volume, expiry risk, and insurance coverage.
- Healthcare consultants and accountants who prepare monthly management reports for pharmacy clients.
- Pharmacy-school students and instructors learning to analyze real-world pharmacy KPIs in Excel.
❌ This template is NOT for:
- Pharmacies that need real-time point-of-sale integration, prescription verification, or dispensing hardware — for that, use a full pharmacy-management system.
- Enterprise hospital groups that require HIPAA-audited SaaS with role-based access and SSO.
- Teams that refuse to work in Excel and prefer pure cloud-first tooling — consider our Google Sheets Dashboards instead.
⚙️ How to Use the Pharmacy Dashboard in Excel
- Download the .zip file and extract the Excel workbook to your local drive.
- Open the workbook in Microsoft Excel 2016 or later (Excel 365 recommended).
- Go to the Data Sheet tab and paste your pharmacy transaction records into the same columns as the sample data.
- Click the Data tab in the Excel ribbon and press Refresh All — every pivot table and chart will refresh automatically.
- Use the slicers on each page to filter by drug category, store location, payment method, department, or month.
- Review the Overview page KPI cards to see top-line performance, then drill into the Sales Analysis, Inventory, Patient Insights, and Performance Review pages for detail.
- Save a dated copy each month to build a rolling history of pharmacy performance.
💼 Real-World Use Cases
Meera owns a 4-store independent pharmacy chain in Pune. She replaced a $150 per month pharmacy reporting SaaS with the Pharmacy Dashboard in Excel to track monthly sales, gross profit, and expiry risk across her 4 locations. She now spends 20 minutes a month pasting data instead of 6 hours building reports — and catches slow-moving SKUs before they expire.
Daniel is the pharmacy director at a 180-bed community hospital in Ohio. He uses the dashboard’s Patient Insights page to monitor Insurance Coverage percent by drug category across inpatient and outpatient dispensing. The Expiry Risk view cut his hospital’s controlled-substance write-offs by 31% in one quarter.
Rashmi is a healthcare consultant serving 12 pharmacy clients across India. Instead of building a new dashboard for each client, she sends every client a copy of this template and turns around month-end management reports in under 45 minutes per client.
❓ Frequently Asked Questions
What KPIs does the Pharmacy Dashboard in Excel track?
The Pharmacy Dashboard in Excel tracks 5 headline KPIs — Total Sales, Gross Profit, Total Quantity Dispensed, Total Records, and Average Customer Rating — plus 15+ pivot-driven charts across sales, inventory, patient insights, and performance. All metrics refresh automatically after you click Data → Refresh All.
How long does setup take?
Setup of the Pharmacy Dashboard in Excel takes under 10 minutes. Download the .zip, open the .xlsx, paste your transactions into the Data sheet in the same column order as the sample, then press Data → Refresh All. Every chart and KPI updates immediately — no formula editing required.
Can I use this template for multiple pharmacy store locations?
Yes. The Pharmacy Dashboard in Excel is designed for multi-store pharmacies. Every page has a Store Location slicer, and the Overview and Performance Review pages plot sales and customer rating by store, so you can benchmark locations side by side.
Which versions of Excel does this dashboard support?
The Pharmacy Dashboard in Excel works in Microsoft Excel 2016, 2019, 2021, and Microsoft 365 on Windows and Mac. It also opens in Excel Online in read-only mode. Pivot tables and slicers require the desktop app for full interactivity.
How does this compare to paid pharmacy SaaS like PioneerRx or BestRx?
Paid pharmacy SaaS typically costs $99–$499 per user per month and includes POS, e-prescribing, and dispensing hardware. The Pharmacy Dashboard in Excel is $17.99 one-time and focuses on sales, inventory, and performance analytics — so most pharmacies run it alongside their operational system instead of replacing it.
Can I add my own custom KPIs and charts?
Absolutely. The Pharmacy Dashboard in Excel is fully editable. You can extend the Data sheet with new columns, add custom pivot fields on the Support sheet, and create additional charts on any page. Nothing is locked.
Do I get future updates to the Pharmacy Dashboard in Excel?
Yes. Every structural improvement or fix is shared at no additional charge. Re-download the .zip from your NextGenTemplates account at any time to get the latest version.
👤 About the Author
Built by PK — Microsoft Certified Professional with 15+ years of Excel, Google Sheets, and Power BI experience. Founder of NextGenTemplates, reaching 300K+ subscribers across YouTube channels (@PK-AnExcelExpert, @NextGenTemplates, @NeoTechNavigators). Every template is hand-built and tested before release.
🔗 Explore Related Templates
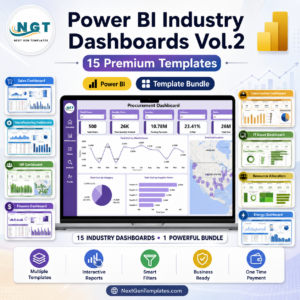
📌 Pharmacy KPI Dashboard in Power BI — The Power BI version of this template with DAX measures and cross-filtering.
📌 Pharmacy KPI Dashboard in Google Sheets — The cloud-native Google Sheets equivalent with collaborative editing.
📌 Pharmacy Workflow Bottleneck Analysis Dashboard in Power BI — Operational companion focused on prescription turnaround time and bottlenecks.
📌 Clinics Dashboard in Excel — Same Excel format, tailored for outpatient clinics.
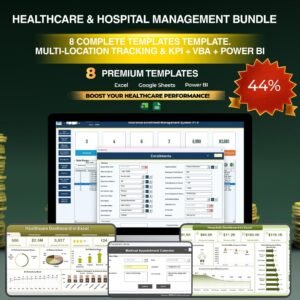
💎 Healthcare & Hospital Management Bundle — Save 44% — Get 8 healthcare templates (Excel + Power BI + VBA) including hospital management systems and healthcare dashboards for $99.99 instead of $179.92.
Also explore our full library of Excel Dashboard Templates.
📖 Click here to read the Detailed Blog Post
🎥 Visit our YouTube channel for step-by-step video tutorials
👉 YouTube.com/@NextGenTemplates


Reviews
There are no reviews yet.