

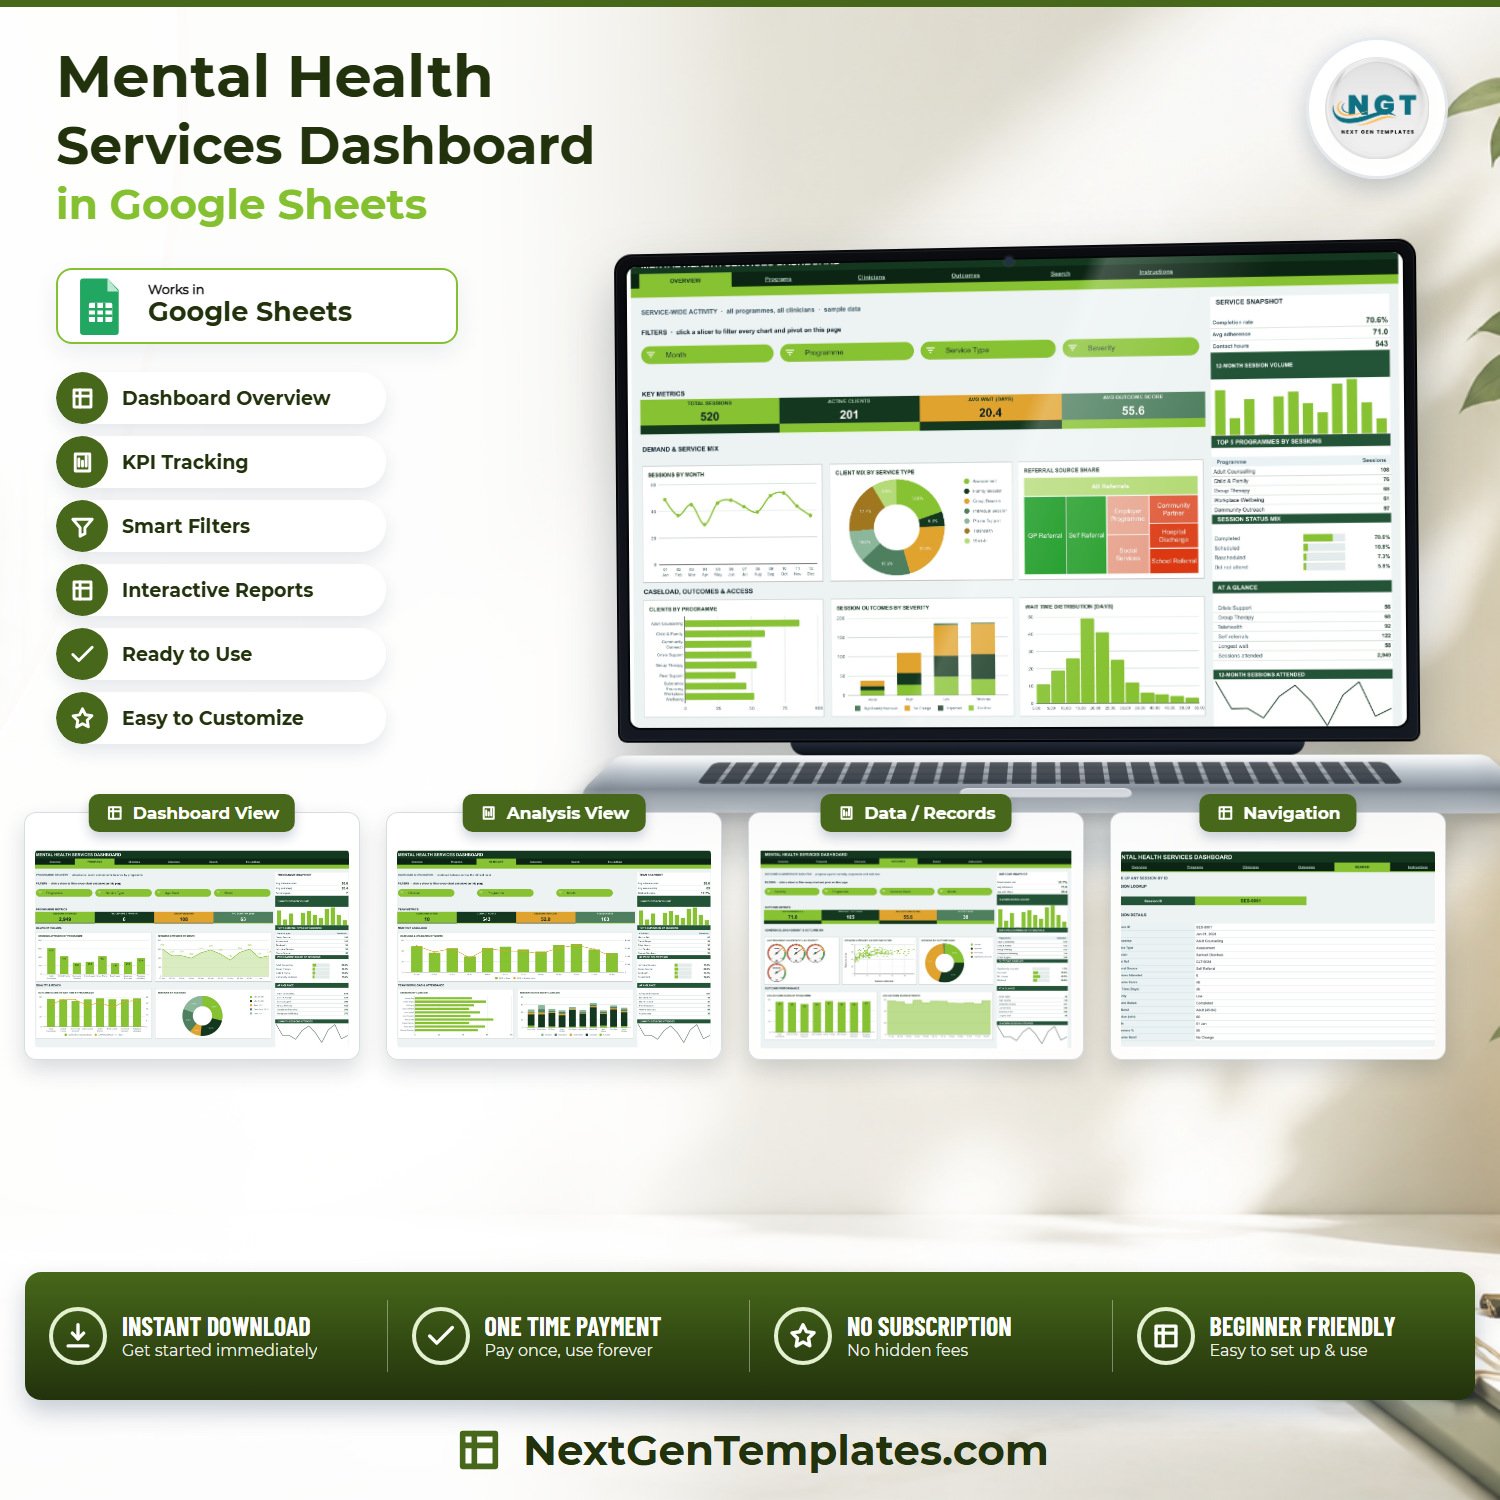
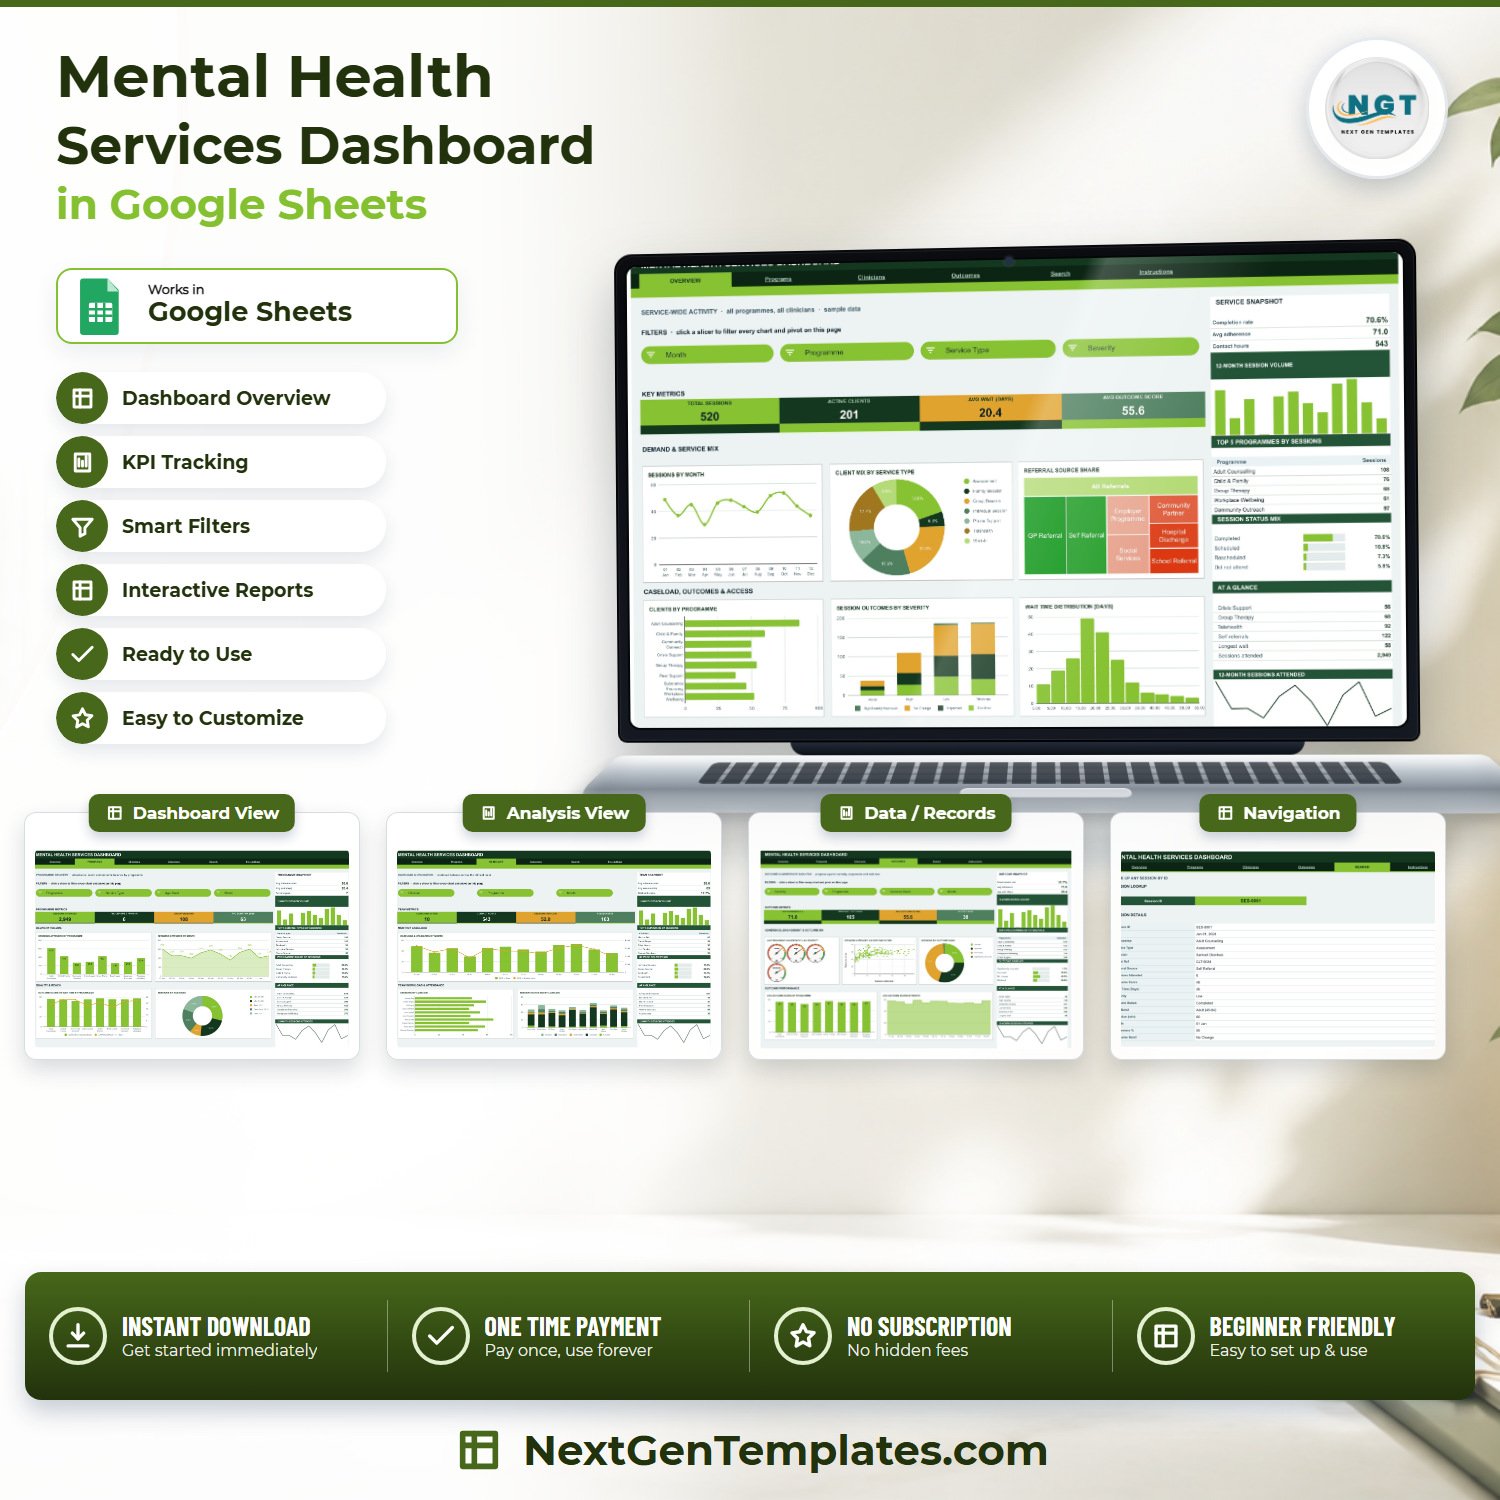

The Mental Health Services Dashboard in Google Sheets is a service-operations reporting template: 7 tabs, 16 KPI cards, 18 chart panels and 15 slicers, all driven by native Google Sheets pivot tables over a 20-column session log. It ships loaded with 520 invented sample session rows across 8 programmes, 7 service types, 7 referral sources and 10 clinicians, so every chart is populated the moment you open it. Formulas and pivots already cover 1,000 rows, so you can paste your own records straight in. One-time payment, no subscription, instant download, and the PDF in your order carries the Google Sheets copy link. This is a business reporting template, not a clinical tool – it does not assess, screen, triage, diagnose or advise, and nothing in it is clinical guidance.Mental Health Services Dashboard in Google Sheets
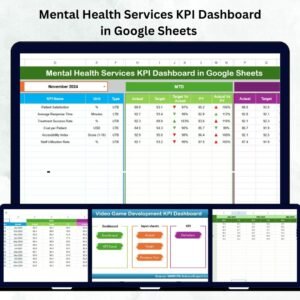
Two honest notes before you buy. First, this is the analytical Google Sheets dashboard – four cross-filtered analysis pages plus a record lookup. It is a different template from the Mental Health Services KPI Dashboard in Google Sheets, which is a month-picker scorecard with traffic lights. Second, it is a plain, static spreadsheet. It has no live connection to any EHR, practice-management or booking system, and it carries no HIPAA, GDPR or accreditation certification of any kind.Mental Health Services Dashboard in Google Sheets
Key Features of the Mental Health Services Dashboard in Google Sheets
- Four cross-filtered analysis pages – Overview, Programs, Clinicians and Outcomes, each with its own slicer strip that drives every pivot and chart on that page.
- 15 slicers in total – Month, Programme, Service Type, Severity, Age Band, Clinician and Outcome Band, applied per page so one page’s filters never disturb another’s.
- 16 KPI cards built on SUMIFS and COUNTIFS – Total Sessions 520, Active Clients 201, Avg Wait 20.4 days, Avg Outcome Score 55.6, Sessions Attended 2,949, Programmes Running 8, Clinicians Active 10, Contact Hours 543, and eight more. These are deliberately unfiltered totals so you always keep a service-wide anchor while the charts move.
- 18 chart panels – a monthly session line, a service-type donut, a referral-source treemap, a programme bar, a stacked outcome-by-severity column, a wait-time histogram, an outcome-score-versus-wait-time combo, a sessions-versus-outcome scatter, a four-gauge adherence panel, and more.
- A sidebar on every analysis page – a 3-row snapshot, a 12-month session-volume column chart, a Top 5 table, a share-of-total bar list, a 6-row At A Glance block and a 12-month sparkline.
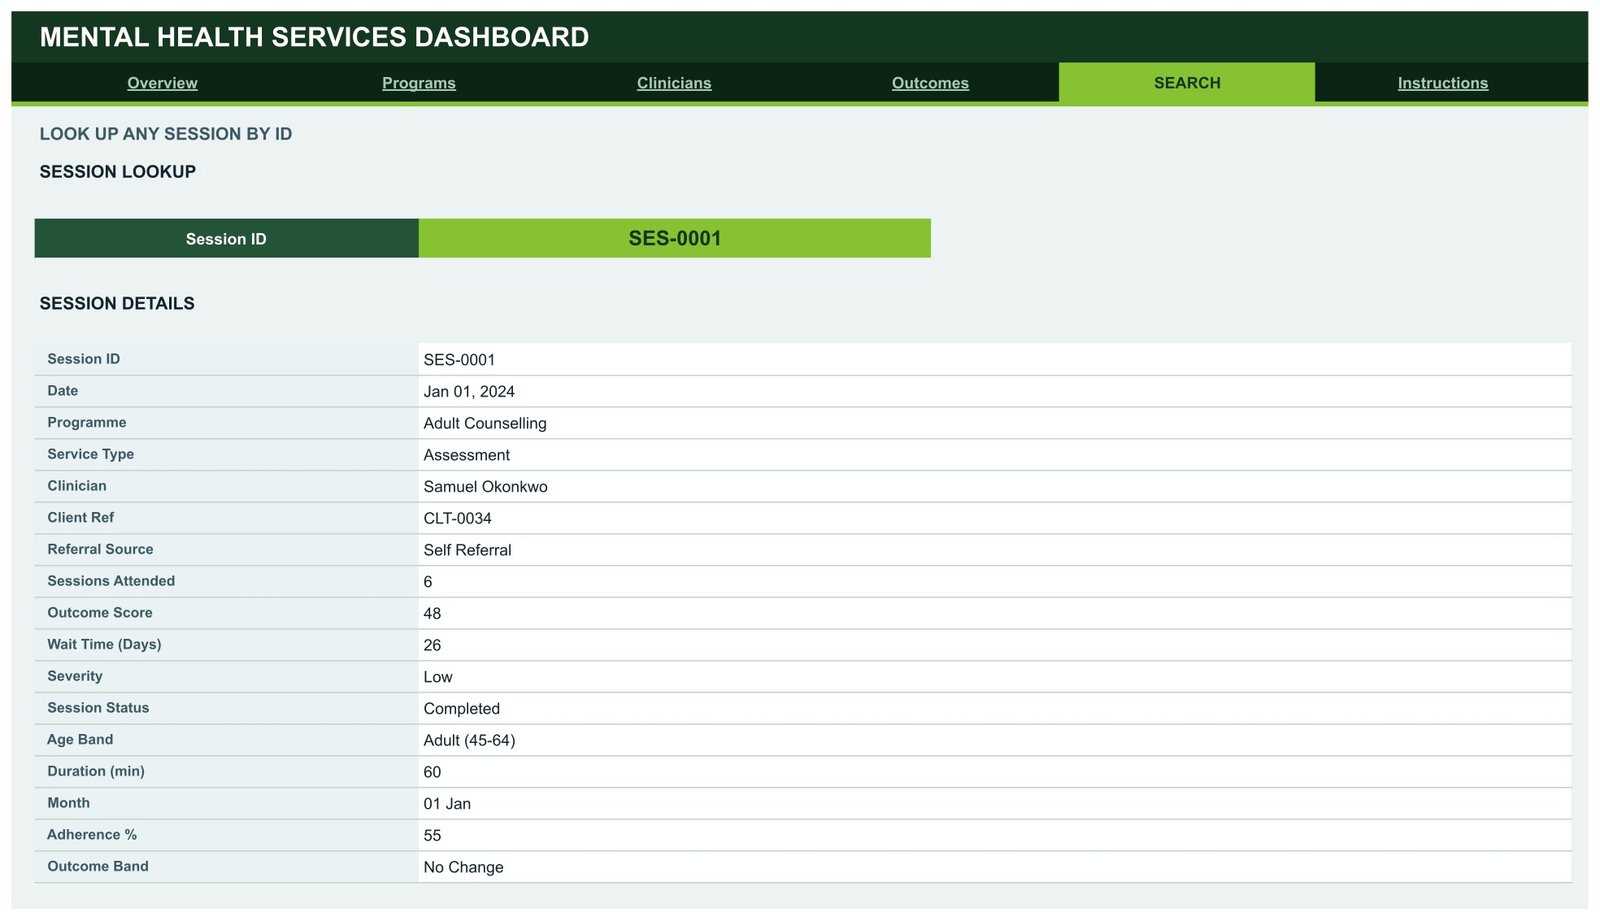
- A Search page that pulls any session’s full 17-field record from a single Session ID.
- Native pivot architecture, no helper formulas behind the charts, so the file stays responsive as the log grows.
- Auto-expanding to 1,000 rows out of the box; the bundled Apps Script exposes a
DATA_ROWSconstant if you need more. - One editable theme – forest green #14371F with a lime accent #86C232 and amber #E0A32E, all set from one palette block in the script.
What’s Inside the Mental Health Services Dashboard in Google Sheets
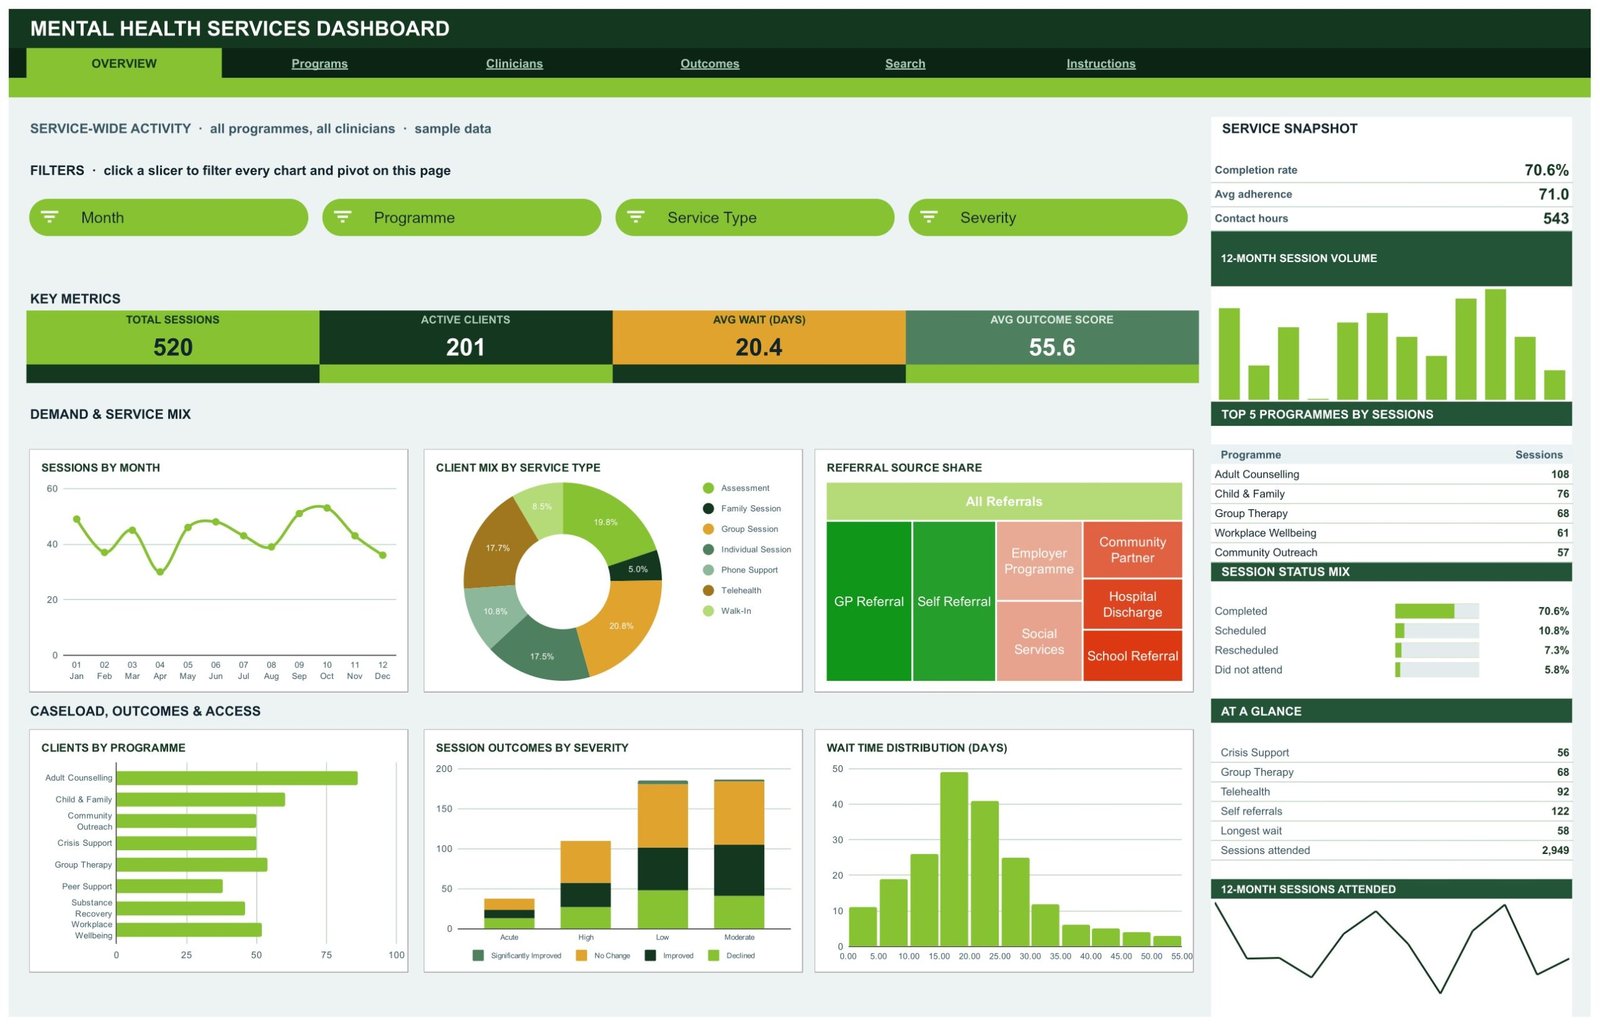
1. Overview – service-wide activity. Four KPI cards (Total Sessions, Active Clients, Avg Wait in days, Avg Outcome Score), then Sessions by Month, Client Mix by Service Type, Referral Source Share, Clients by Programme, Session Outcomes by Severity and Wait Time Distribution. The sidebar carries completion rate, average adherence, contact hours, a Top 5 Programmes table and a session-status mix.
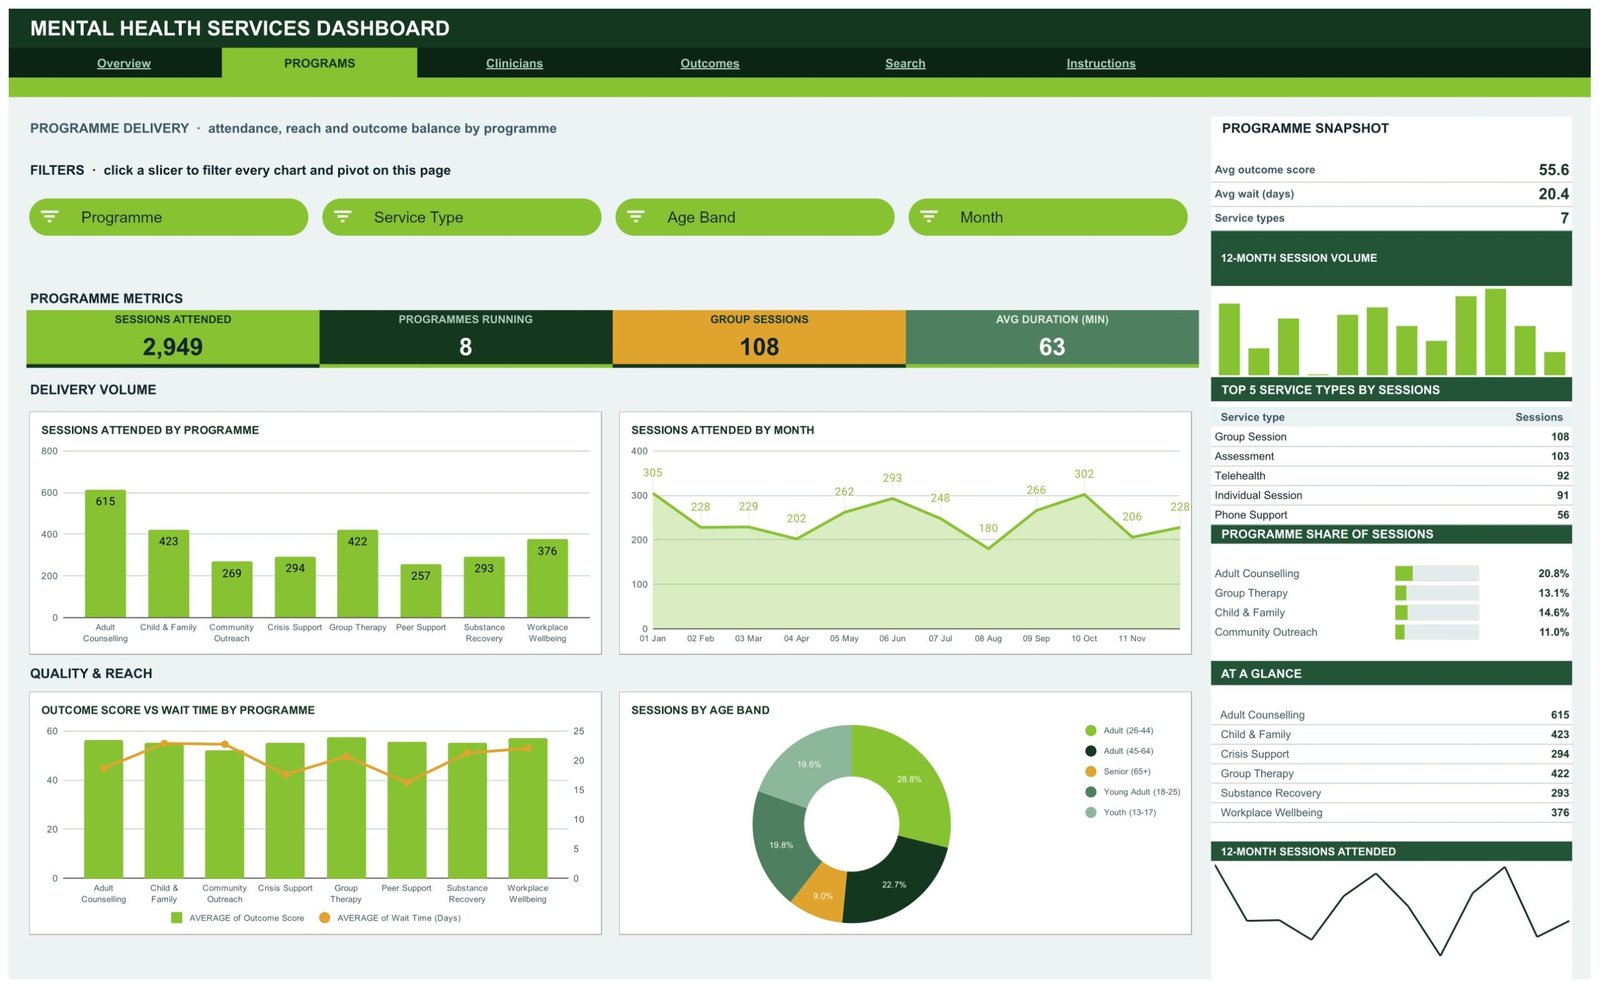
2. Programs – programme delivery. Sessions Attended, Programmes Running, Group Sessions and Avg Duration in minutes, then Sessions Attended by Programme, Sessions Attended by Month, Outcome Score vs Wait Time by Programme and Sessions by Age Band.
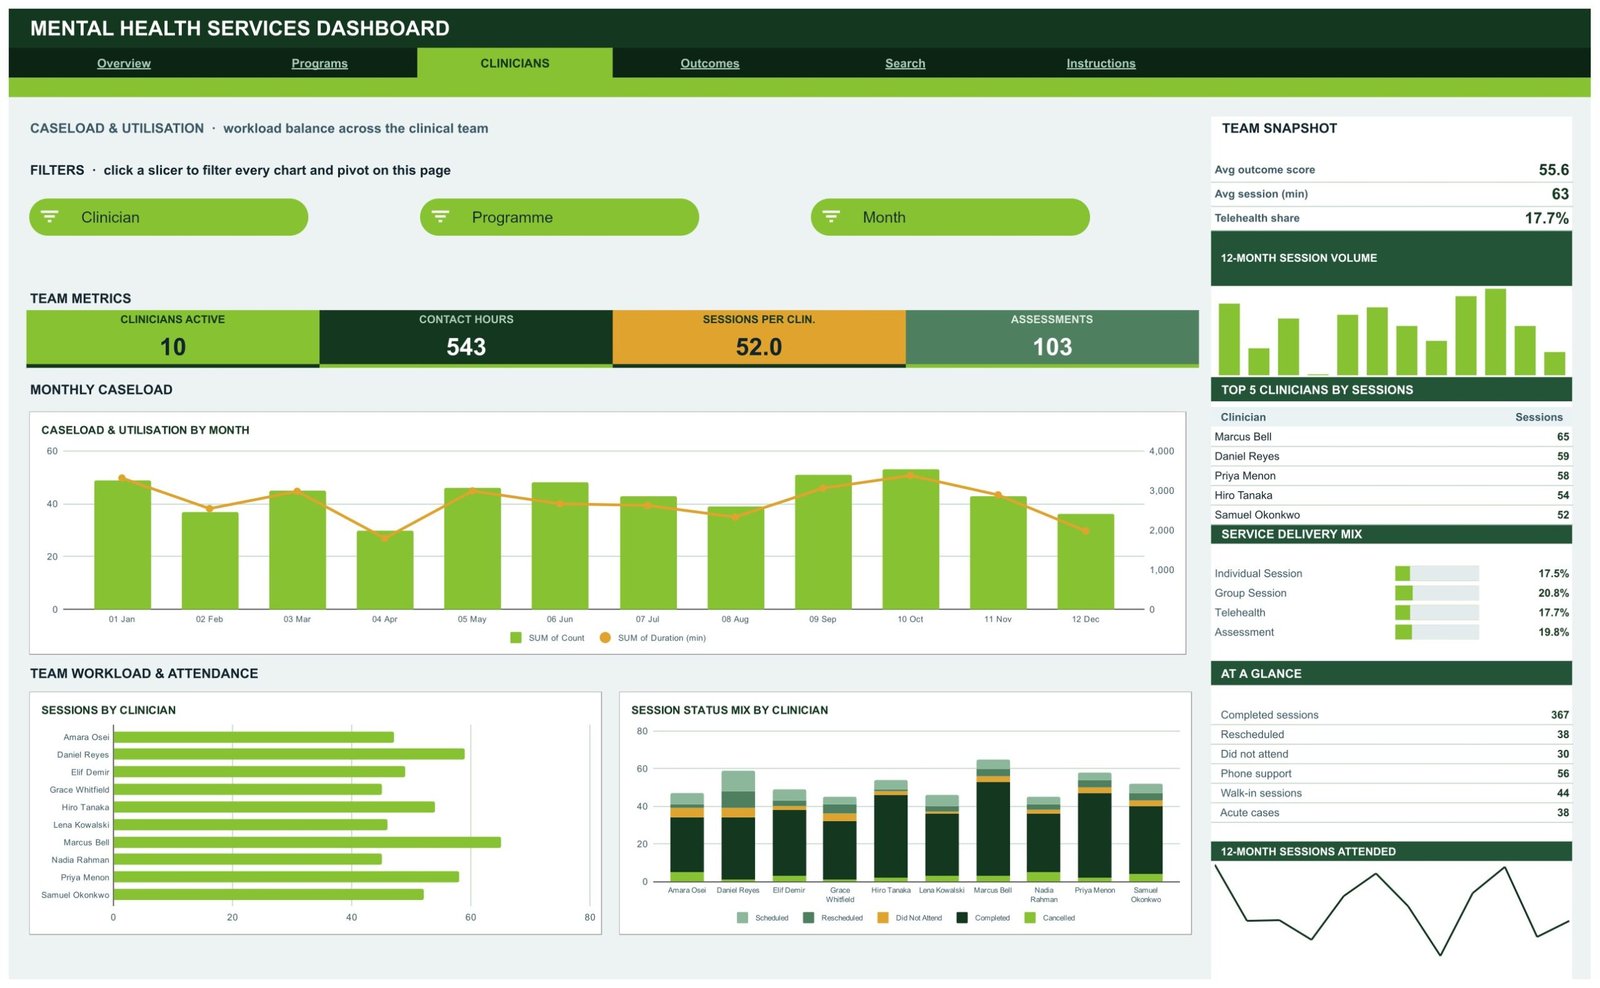
3. Clinicians – caseload and utilisation. Clinicians Active, Contact Hours, Sessions per Clinician and Assessments, then Caseload & Utilisation by Month, Sessions by Clinician and Session Status Mix by Clinician. This is a workload-distribution view of your staff roster, not a performance appraisal or competence rating.
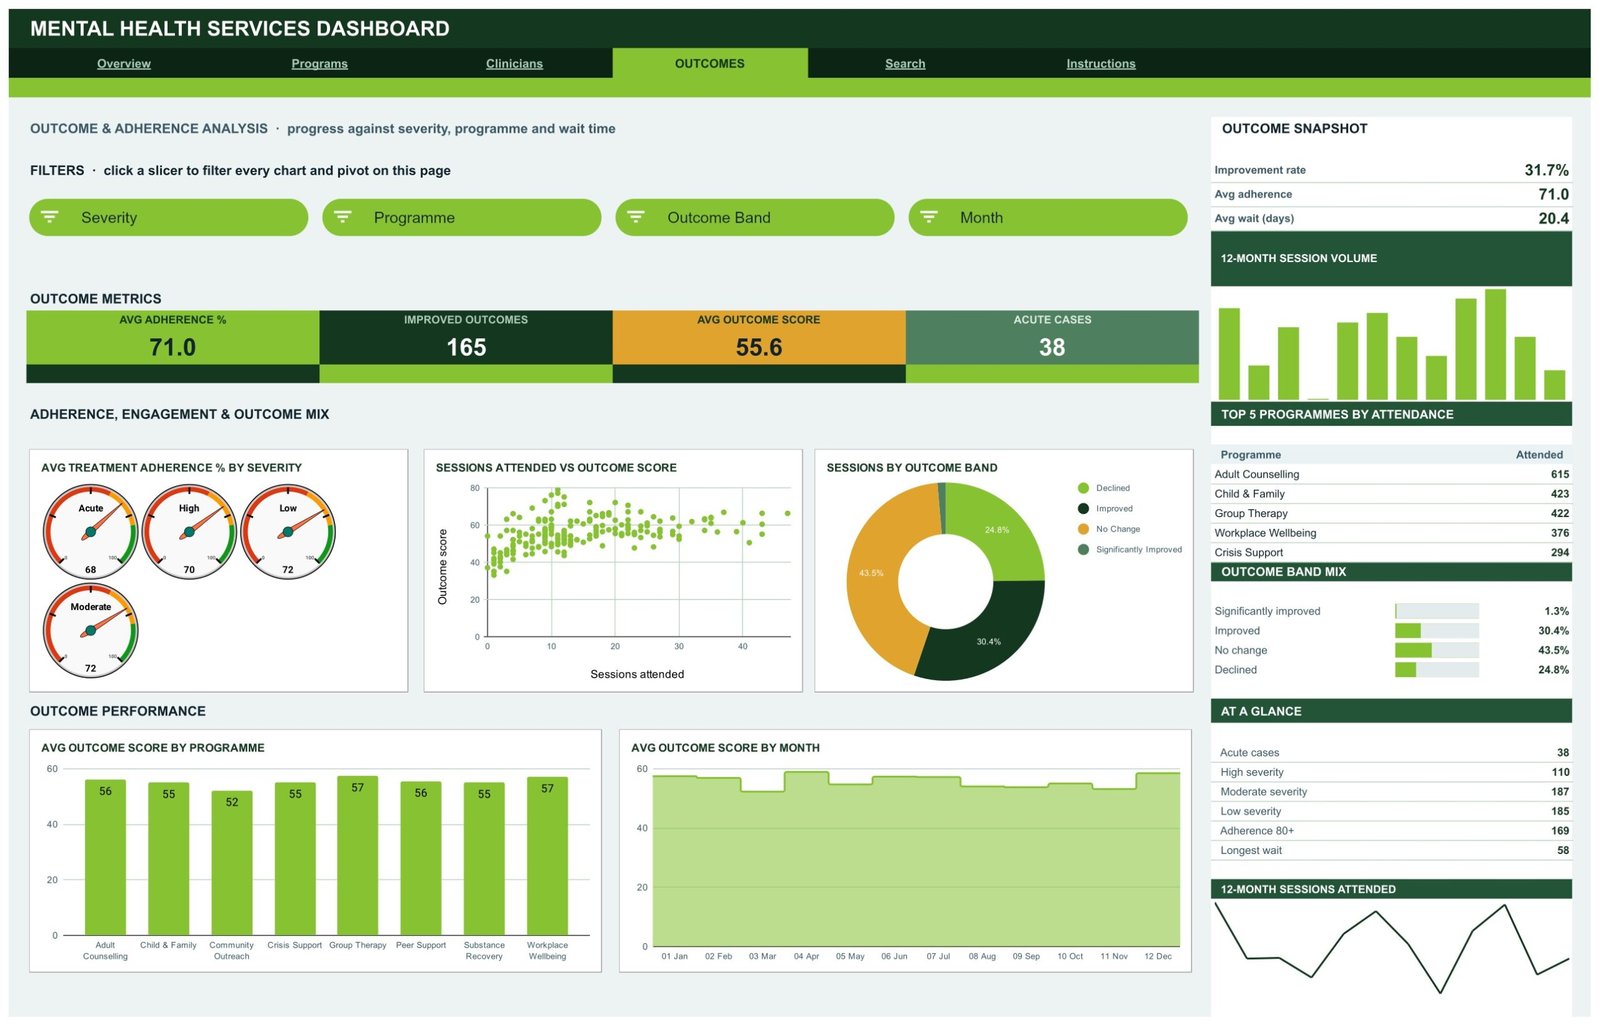
4. Outcomes – the recorded Outcome Score, Adherence % and Outcome Band columns, aggregated. Avg Adherence %, Improved Outcomes count, Avg Outcome Score and Acute Cases, then four adherence gauges by severity, a Sessions Attended vs Outcome Score scatter, a Sessions by Outcome Band donut, Avg Outcome Score by Programme and by Month. Read this plainly: the sheet averages and counts whatever you type into those columns. It does not measure, score, validate or interpret anything, and it makes no claim about treatment efficacy or client wellbeing.
5. Search – type a Session ID and the page returns that row’s 17 fields.
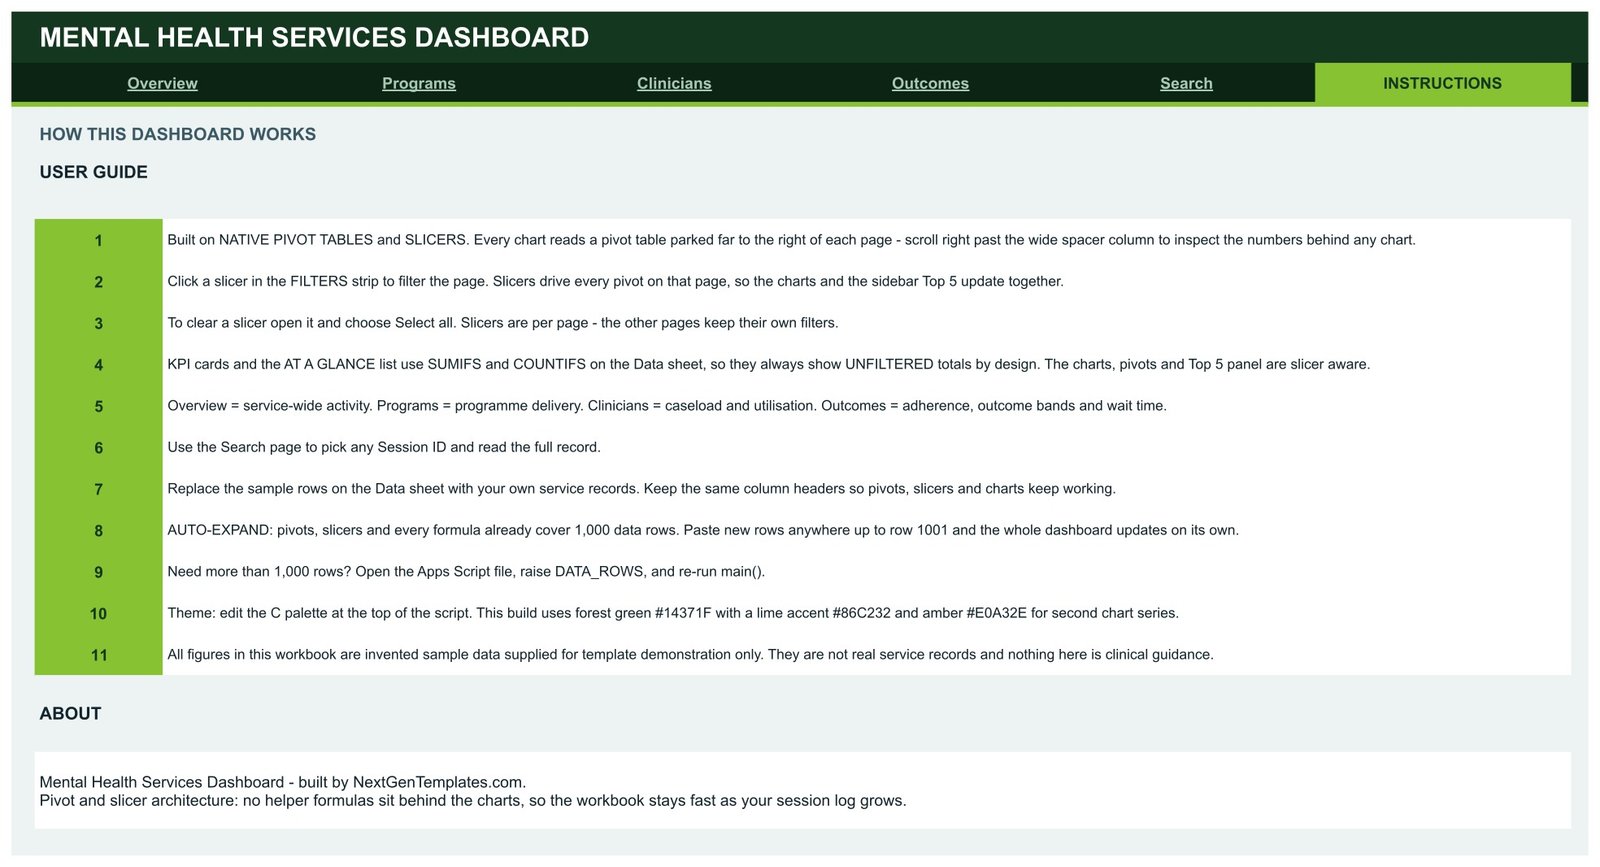
6. Instructions – an 11-point user guide covering slicers, the unfiltered KPI cards, replacing the sample rows and raising the row limit.
7. Data – the 520-row log itself. The 20 columns are Session ID, Date, Programme, Service Type, Clinician, Client Ref, Referral Source, Sessions Attended, Outcome Score, Wait Time (Days), Severity, Session Status, Age Band, Duration (min), Month, Year, Quarter, Count, Adherence % and Outcome Band.
What the sample data holds – and does not. Rows are individual sessions. The sample identifies clients only by a coded reference such as CLT-0034 (201 unique references across the 520 rows) and by a banded age group; there is no name, contact, address, diagnosis, medication or clinical-notes column anywhere in the template. Clinicians are named, because the Clinicians page reports on your own staff roster. If you add identifying columns of your own, that is your decision and your governance responsibility – this is an ordinary Google Sheet, and how you store, share and retain what you put in it is entirely up to you and your organisation’s policies.
Mental Health Services Dashboard in Google Sheets vs. an Excel Dashboard vs. a Paid BI Suite – Where This Fits
| This template (Google Sheets) | Excel dashboard | Paid BI suite (Power BI Pro / Tableau Creator) | |
|---|---|---|---|
| Cost | $9.99 one time | $24.99 one time | $10-$75 per user per month |
| Platform | Google Sheets, browser only | Desktop Excel | Desktop authoring + cloud service |
| Setup time | Copy the sheet, paste your rows – under an hour | Open the workbook, paste your rows | Days: model, publish, license, train |
| Real-time team collaboration | Yes, native Sheets co-editing | Limited | Yes |
| Mobile access | Yes, Sheets app | Limited | Yes |
| Customisable fields | Yes – edit columns and re-run the script | Yes | Yes |
| Share with a link | Yes | No | Only to licensed users |
| Year-1 cost at 5 users | $9.99 | $24.99 | $600-$4,500 |
| Live connection to an EHR or booking system | No – you paste or import rows | No | Yes, with connectors and engineering time |
| Row capacity as shipped | 1,000 (raise via the script) | Tens of thousands | Millions |
The comparison above is deliberately drawn against reporting tools. This template is not an alternative to an EHR, a practice-management system, a booking platform or a clinical record, and it should never be used in place of one.
Who This Template Is For – and Who It’s Not For
A good fit for: a service manager or operations lead at a counselling service, community mental health team, employee-assistance provider, charity or student wellbeing service who already keeps a session log in a spreadsheet and needs a monthly board or commissioner pack out of it. It suits teams of roughly 5 to 30 clinicians running up to a few thousand sessions a year, who want waiting times, attendance, referral mix and caseload balance visible without buying a BI licence.
Not a good fit if you need a clinical, triage, crisis-response or safeguarding tool – this is none of those, and must never be presented as one. Also skip it if you need a live feed from your EHR, if you must hold identifiable client records under a formal compliance regime that a general-purpose spreadsheet cannot satisfy, if you run well beyond a few thousand sessions a year, or if you want per-client case notes rather than aggregate service reporting. In those cases a proper system, or the Power BI version for larger volumes, is the better answer.
How to Use the Mental Health Services Dashboard in Google Sheets
- Open the PDF in your download and click the copy link. Google Drive creates your own editable copy.
- Open the Data tab and read the 20 headers. Map your export to them and keep the header text exactly as it is – the pivots, slicers and formulas are bound to those names.
- Replace the 520 sample rows with your own. Anything up to row 1001 is already covered; past that, open the Apps Script file, raise
DATA_ROWSand re-runmain(). - Go to Overview and click a slicer. Every chart and pivot on that page follows. The KPI cards and the At A Glance list stay unfiltered on purpose.
- Work through Programs, Clinicians and Outcomes. Each page has its own filters, so you can leave one page filtered to a programme while another stays service-wide.
- Use Search to pull a single session record when someone queries a figure.
- Recolour from the palette block at the top of the script if you need house colours.
Real-World Use Cases
Priya, service manager at a community counselling charity. Her commissioner wants quarterly waiting times and did-not-attend rates. She pastes the quarter’s sessions into the Data tab, filters Overview to the quarter, and screenshots the wait-time histogram and the session-status mix straight into the report – a job that used to mean an afternoon of manual pivots.
Daniel, operations lead at an employee-assistance provider. He uses the Clinicians page to see caseload balance across ten counsellors before the next intake round, spots that one clinician is carrying noticeably more sessions than the rest, and rebalances the rota. He is reading workload, not judging quality.
Amara, coordinator at a university wellbeing service. She filters the Programs page by Age Band to show the student union how demand splits between the 18-25 and 26-44 groups, and uses Referral Source Share to argue for more self-referral capacity.
Frequently Asked Questions
Is this a clinical tool?
No. It is a business reporting template for service operations – volumes, waiting times, attendance, caseload distribution and the categorical fields you record. It performs no assessment, screening, triage, risk scoring, diagnosis or treatment recommendation, and nothing in it is clinical guidance.
Does it track patient wellbeing or symptom severity?
No. It has Severity, Outcome Score, Adherence % and Outcome Band columns, but those are values you type in from your own records. The dashboard only counts and averages them. It does not calculate, validate or interpret them, and it makes no claim about treatment efficacy.
Does it store patient names?
Not in the template. The sample data identifies clients only by a coded Client Ref and a banded age group – there is no name, contact, address, diagnosis or notes column. Clinician names are present because the Clinicians page reports on your staff roster. Whether you add identifying data of your own, and how you govern it, is your organisation’s decision.
Is it HIPAA or GDPR compliant?
We make no compliance claim of any kind. It is an ordinary Google Sheet. Compliance depends on your Google Workspace configuration, your data-protection assessments and your own policies – please involve whoever owns that in your organisation before putting real data in it.
Does it connect to my EHR or booking system?
No. It is static. You paste or import rows into the Data tab; there is no live link to any external system.
How many records does it hold?
Pivots, slicers and formulas cover 1,000 rows as shipped. To go further, raise DATA_ROWS in the bundled Apps Script and re-run it.
Can I change the programmes, service types and colours?
Yes. Type your own values in the Data tab and the slicers and pivots pick them up. Colours come from one palette block at the top of the script.
How is this different from the KPI Dashboard version?
This one is the analytical dashboard – four cross-filtered pages of charts plus a record lookup. The KPI Dashboard is a month-picker scorecard with traffic lights and dedicated trend and analysis pages. They are different templates, and many teams keep both.
About the Author
Built by PK – Microsoft Certified Professional with 15+ years of Excel, Google Sheets, and Power BI experience. Founder of NextGenTemplates, reaching 300K+ subscribers across YouTube channels. Every template is hand-built and tested before release.
Explore Related Templates
- Mental Health Services KPI Dashboard in Google Sheets – the month-picker scorecard companion.
- Mental Health Services Dashboard in Power BI – the same subject at larger data volumes.
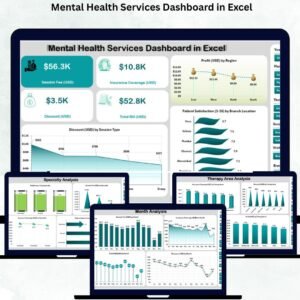
- Mental Health Services Dashboard in Excel – for teams that live in desktop Excel.
- Rehabilitation Center KPI Dashboard in Google Sheets
- Substance Abuse Center KPI Dashboard in Google Sheets
- Browse the full Google Sheets Dashboard category or every Google Sheets template.
Get the Mental Health Services Dashboard in Google Sheets for $9.99 (regular $16.99). Instant download, one-time payment, no subscription. Your download contains the PDF with the copy link – one click and the dashboard is in your own Google Drive. A full walkthrough is published on NeoTechNavigators.
Watch the step-by-step video Demo:
Last updated: 1 September 2026.
Compatibility and Requirements
- Works in Google Sheets. You need a free Google account and a web browser.
- The dashboard uses native pivot tables and slicers over the Data tab, and a bundled Apps Script holds the DATA_ROWS setting. Google covers the basics in Get started with Google Sheets.































Reviews
There are no reviews yet.