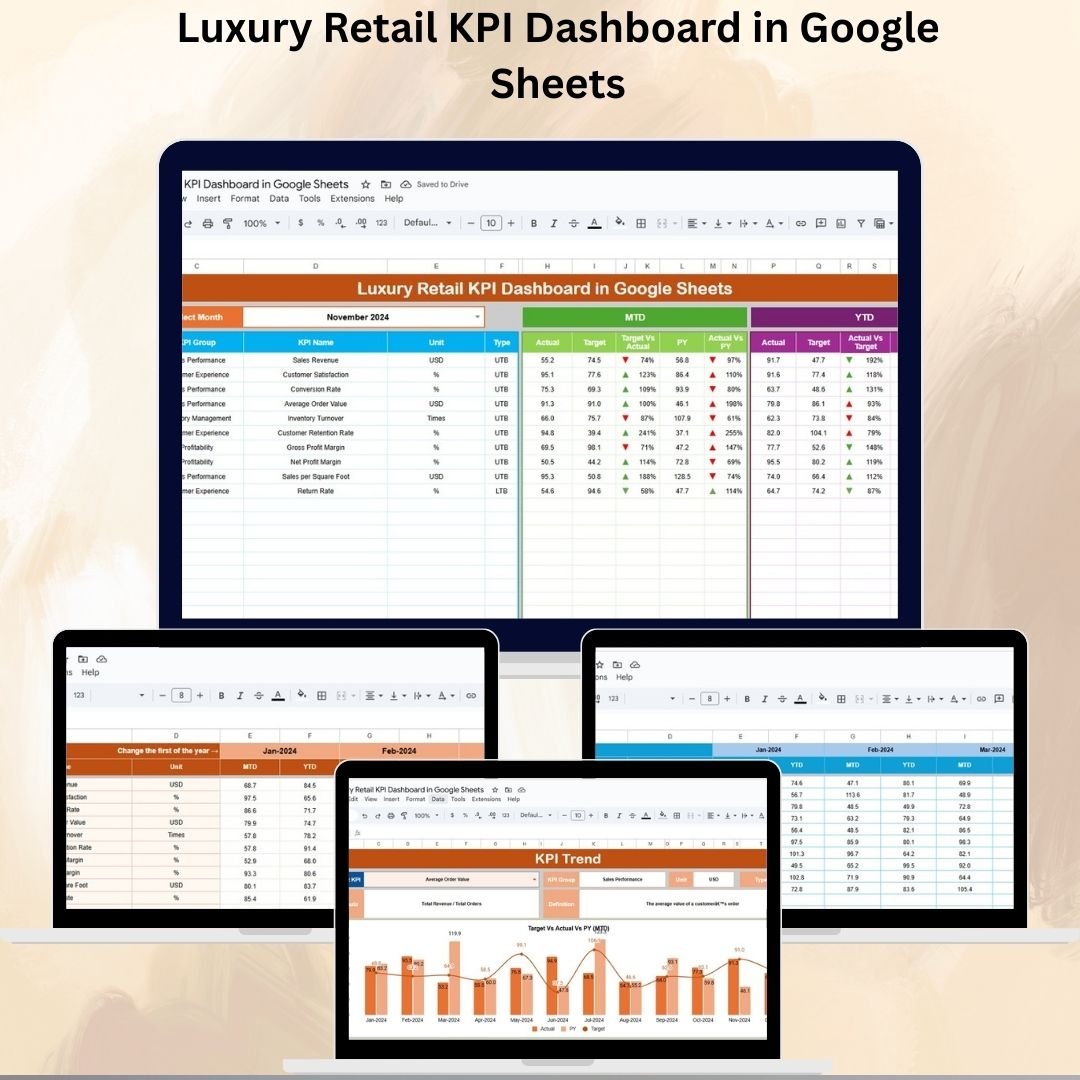
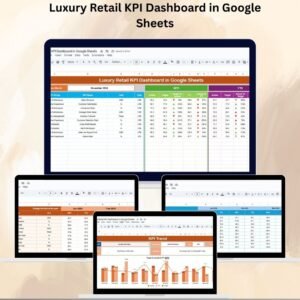
Managing a luxury retail business requires precision, speed, and insight. In today’s highly competitive environment, store owners, managers, and analysts need to track sales, customer behavior, and operational efficiency in real time to stay ahead. The Luxury Retail KPI Dashboard in Google Sheets is a ready-to-use, interactive, and fully customizable template designed to simplify KPI tracking and turn raw data into actionable insights.
This tool empowers you to monitor performance across critical metrics like sales revenue, customer traffic, conversion rates, order returns, and profitability—all from a clean and dynamic Google Sheets interface. With automated updates, interactive charts, and year-over-year comparisons, this dashboard ensures you always know where your business stands.
✨ Key Features of the Luxury Retail KPI Dashboard
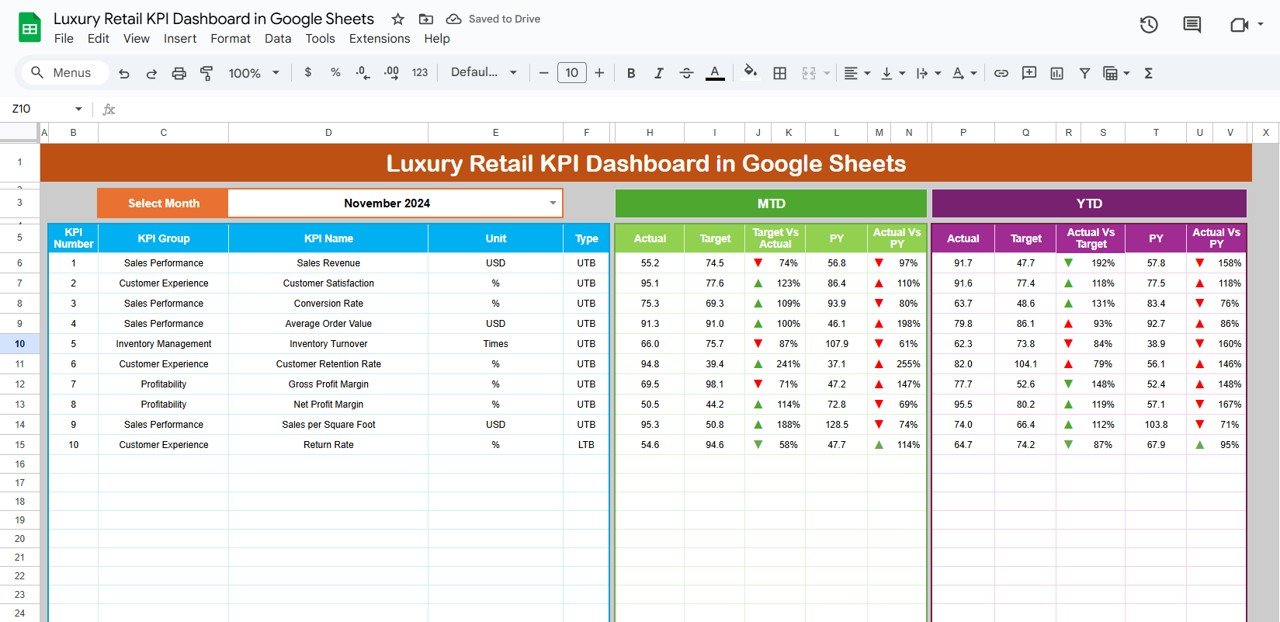
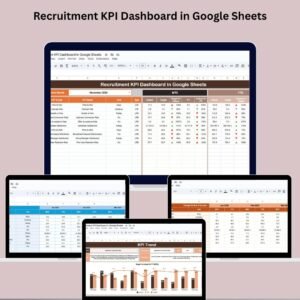
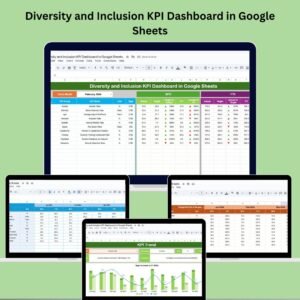
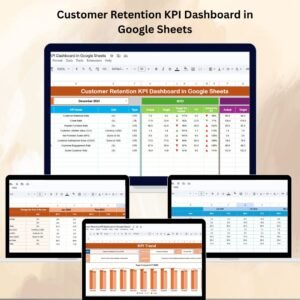
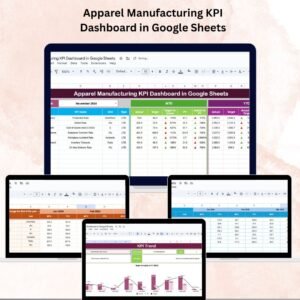
1. Dashboard Sheet Tab – Real-Time Overview
-
Month Selector: Easily switch months using a dropdown, and the entire dashboard updates instantly.
-
MTD & YTD Analysis: View Month-to-Date (MTD) and Year-to-Date (YTD) Actuals, Targets, and Previous Year data.
-
Visual KPIs: Cards and charts give you instant insights into sales, conversion rates, and customer satisfaction.
-
Conditional Formatting: Up/down arrows instantly show if performance is above or below expectations.
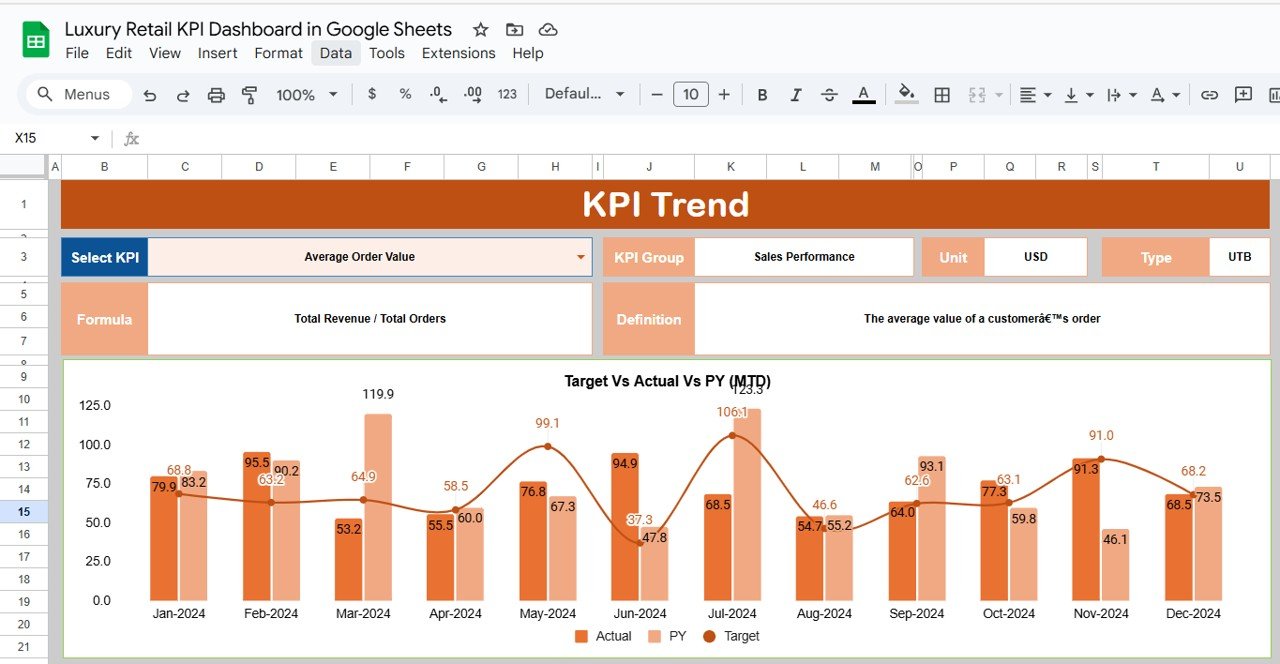
2. KPI Trend Sheet Tab – Deep Dive into Metrics
-
Select a KPI from the dropdown to analyze trends.
-
Displays KPI Group, Unit, Formula, Definition, and Type (Lower-the-Better or Upper-the-Better).
-
Trend charts visualize monthly and yearly changes, helping you spot patterns and improvement areas.
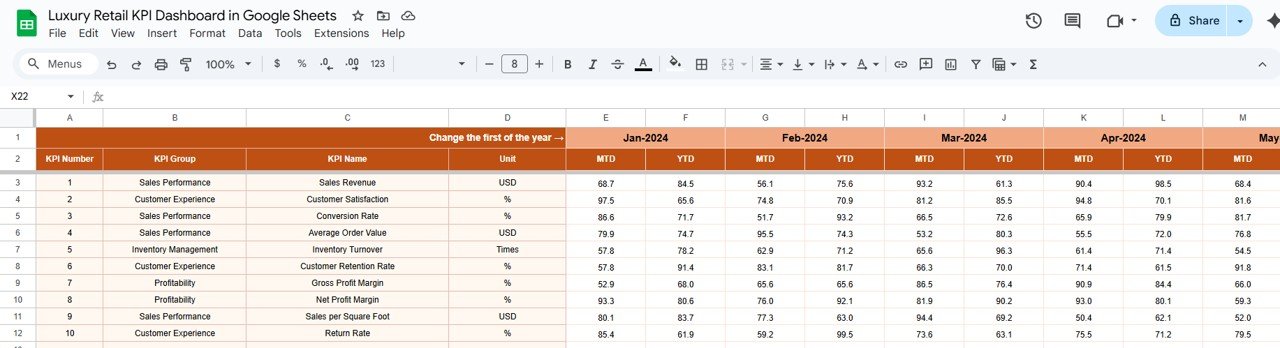
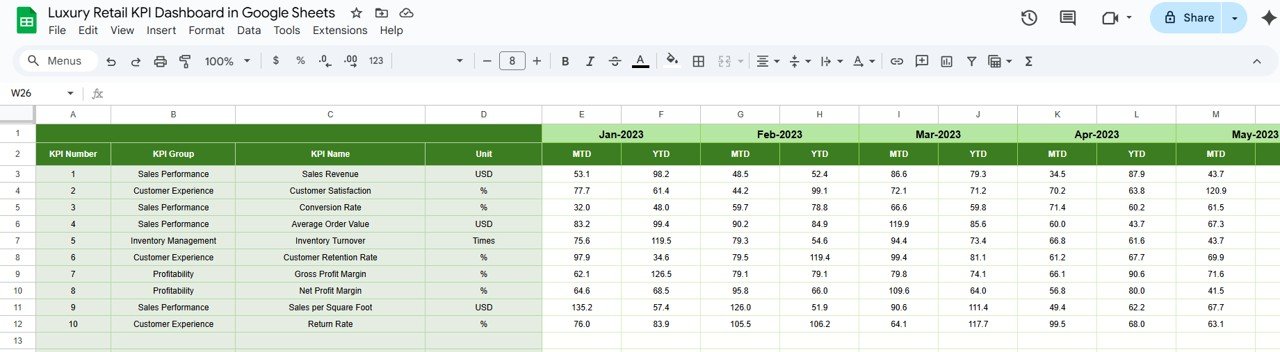
3. Actual Numbers Sheet Tab – Input Real Performance
-
Input actual monthly numbers for all KPIs.
-
Supports both MTD and YTD values.
-
Dynamic updates ensure the dashboard reflects the most recent performance data.
4. Target Sheet Tab – Define Business Goals
-
Enter monthly and yearly target values for each KPI.
-
Enables automatic calculation of performance vs goals.
-
Supports seasonal or business-specific target adjustments.
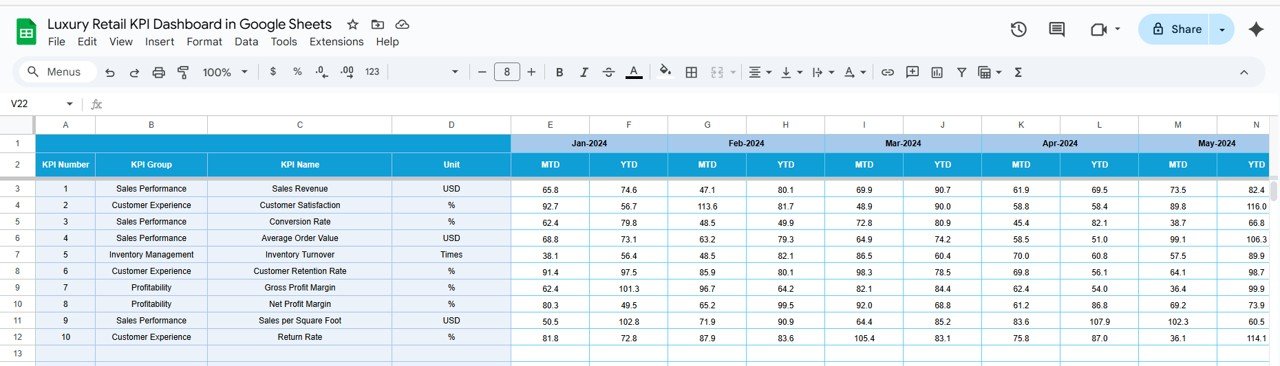
5. Previous Year Numbers Sheet Tab – Benchmarking Made Easy
-
Input last year’s data for MTD and YTD comparison.
-
Helps identify performance improvements, stagnation, or declines.
-
Supports conditional formatting for quick performance checks.
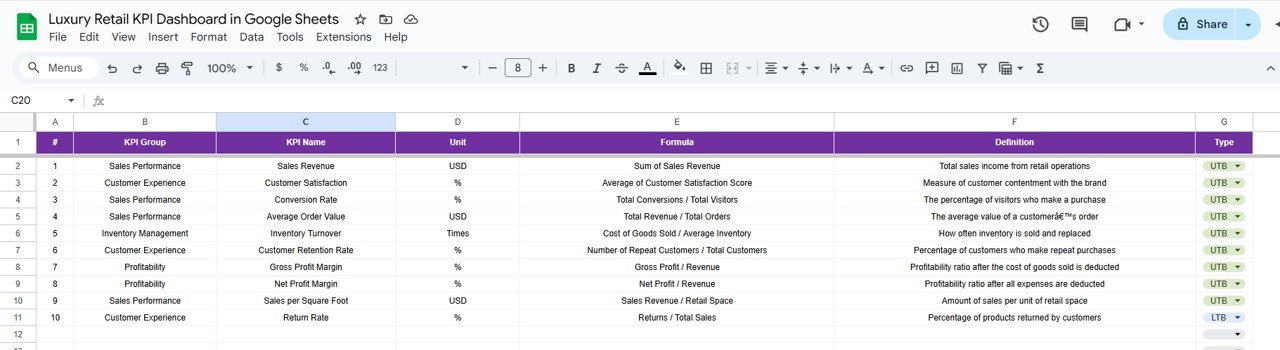
6. KPI Definition Sheet Tab – Clear Documentation
-
Lists KPI Name, Group, Formula, Unit, and Definition.
-
Identifies whether each KPI is Lower-the-Better (LTB) or Upper-the-Better (UTB).
-
Provides clarity and consistency across teams.
📦 What’s Inside the Luxury Retail KPI Dashboard?
-
A 6-tab Google Sheets file covering Dashboard, KPI Trend, Actual Numbers, Targets, Previous Year Numbers, and KPI Definitions.
-
Prebuilt formulas, cards, and conditional formatting.
-
Easy-to-customize structure for your retail business needs.
⚙️ How to Use the Luxury Retail KPI Dashboard
-
Enter actual values in the Actual Numbers Sheet.
-
Define monthly and yearly targets in the Target Sheet.
-
Input last year’s numbers in the Previous Year Sheet for benchmarking.
-
Analyze performance through the Dashboard Sheet.
-
Dive deeper into individual KPIs using the KPI Trend Sheet.
👥 Who Can Benefit from This Dashboard?
-
Retail Managers – Monitor store performance daily, weekly, and monthly.
-
Business Analysts – Track KPIs, measure growth, and prepare reports.
-
Store Owners – Gain complete visibility into sales and customer engagement.
-
Executives – Use performance insights for strategic decision-making.
✅ Advantages of Using This Dashboard
-
Consolidates all KPIs in one central view.
-
Saves time with automated updates and dynamic charts.
-
Provides MTD, YTD, and Year-over-Year performance tracking.
-
Fully customizable to match your business processes.
-
Enables data-driven decisions for revenue growth and operational efficiency.
🚀 Best Practices for Using the Dashboard
-
Update actual numbers regularly for accuracy.
-
Review historical trends to adjust future targets.
-
Use conditional formatting to highlight gaps.
-
Share the dashboard with your team for collaborative analysis.


Reviews
There are no reviews yet.