
Running a subscription-based business requires constant tracking of performance metrics to ensure growth, retention, and profitability. Our Subscription Business KPI Dashboard in Google Sheets is your all-in-one tool for real-time performance tracking, decision-making, and business scaling. Whether you’re managing SaaS subscriptions, digital memberships, or subscription boxes, this dashboard helps you make data-driven decisions with confidence. 📊💼
🚀 Key Features of the Subscription Business KPI Dashboard
This powerful dashboard template is packed with everything a modern subscription business needs:
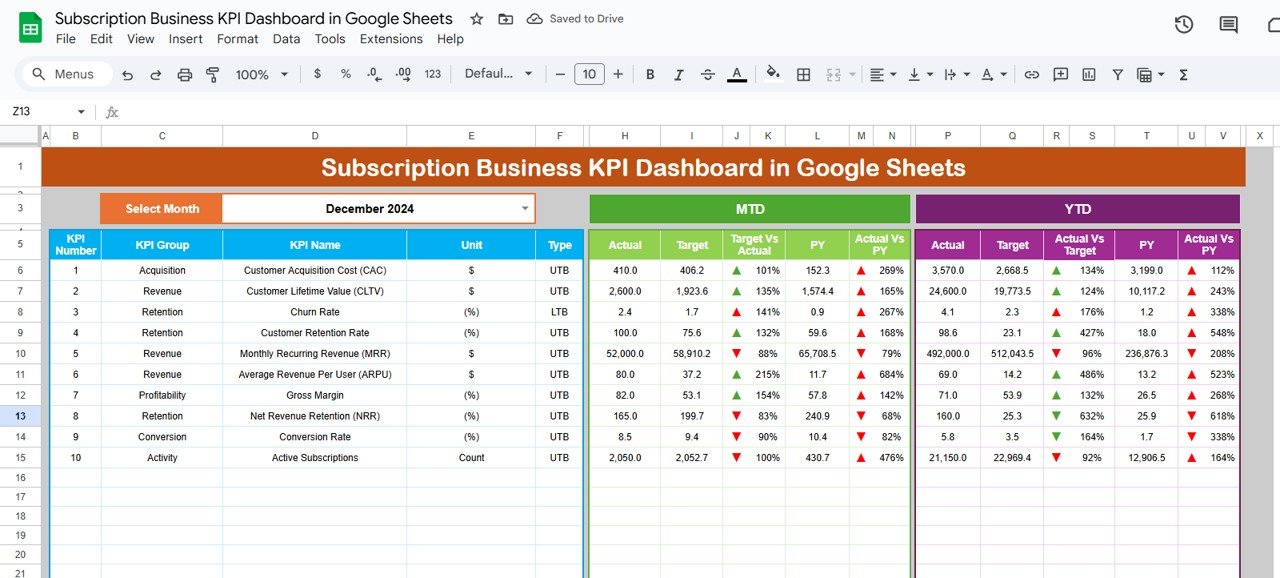
📊 Dashboard Sheet Tab
-
📅 MTD & YTD Tracking: Monitor month-to-date and year-to-date actuals with one glance.
-
🎯 Target vs. Actual View: Compare actual performance to set goals.
-
📈 PY vs. Actual: View comparisons with last year’s performance with up/down indicators.
-
📍 Select Your Month from a dropdown and see all charts and metrics update instantly.
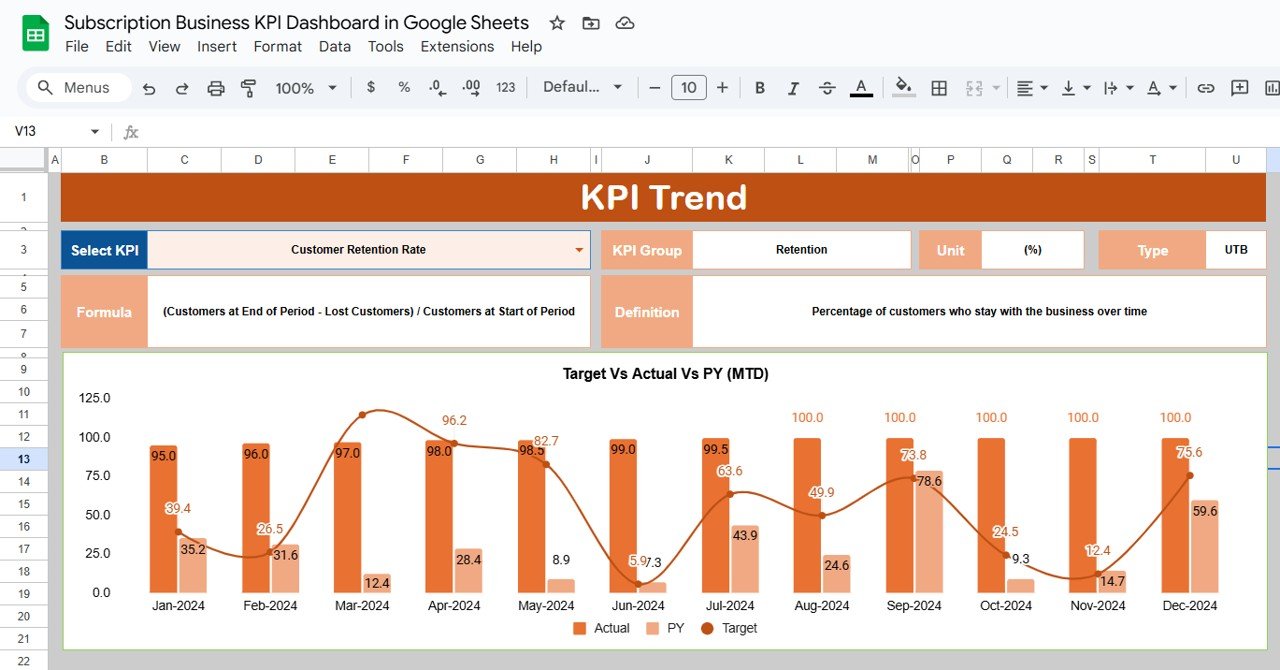
📉 KPI Trend Sheet Tab
-
📌 Drill-Down by KPI: Select individual KPIs and view trend lines and calculations.
-
📚 Definitions & Formulas: Know exactly what you’re tracking and how it’s calculated.
-
🔎 KPI Types: Identify whether each metric is “Lower the Better” (LTB) or “Upper the Better” (UTB).
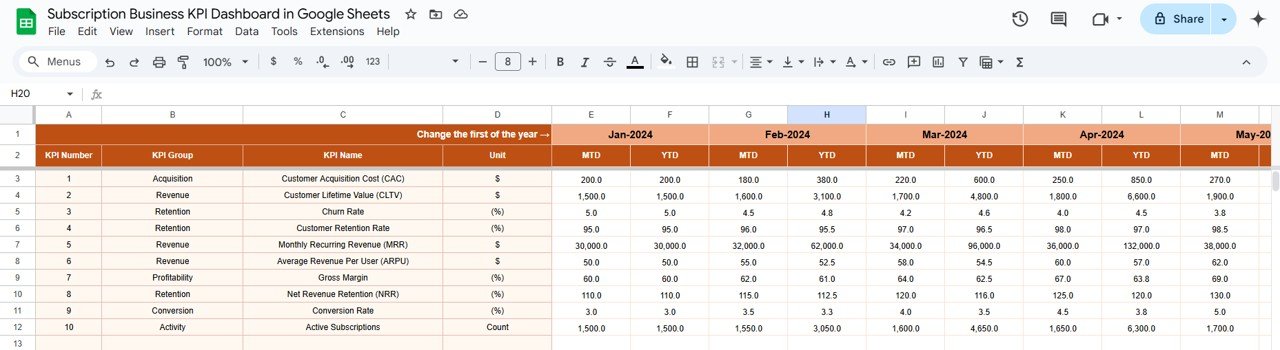
📋 Actual Numbers Sheet Tab
-
Input your actual values for each KPI—both MTD and YTD.
-
The dashboard auto-updates as you enter new data.
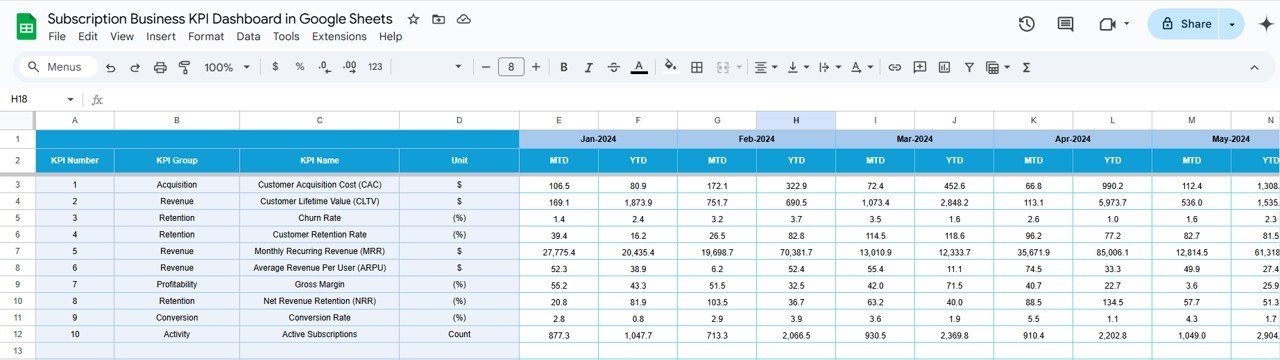
🎯 Target Sheet Tab
-
Enter performance targets for each KPI.
-
Set realistic and trackable goals for your subscription business.
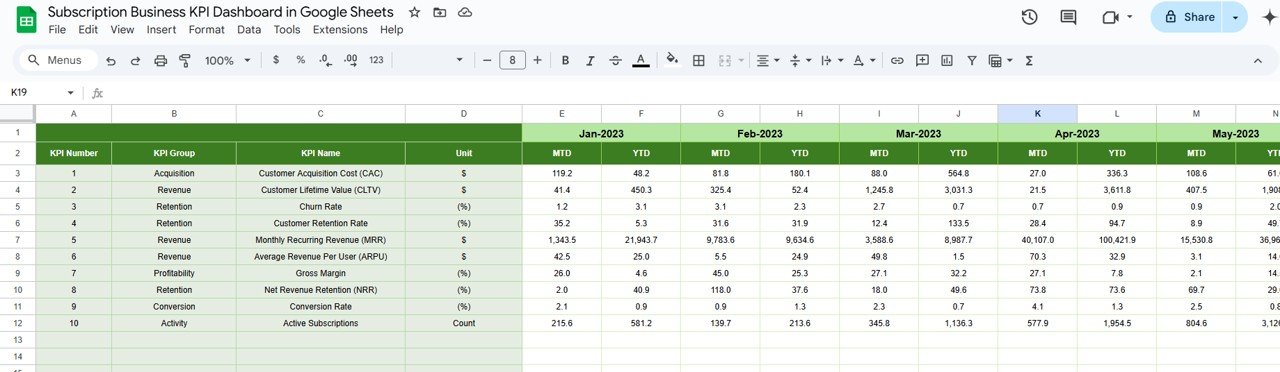
📆 Previous Year Numbers Sheet
-
Maintain year-over-year comparisons to monitor growth.
-
Spot performance improvements or areas of concern quickly.
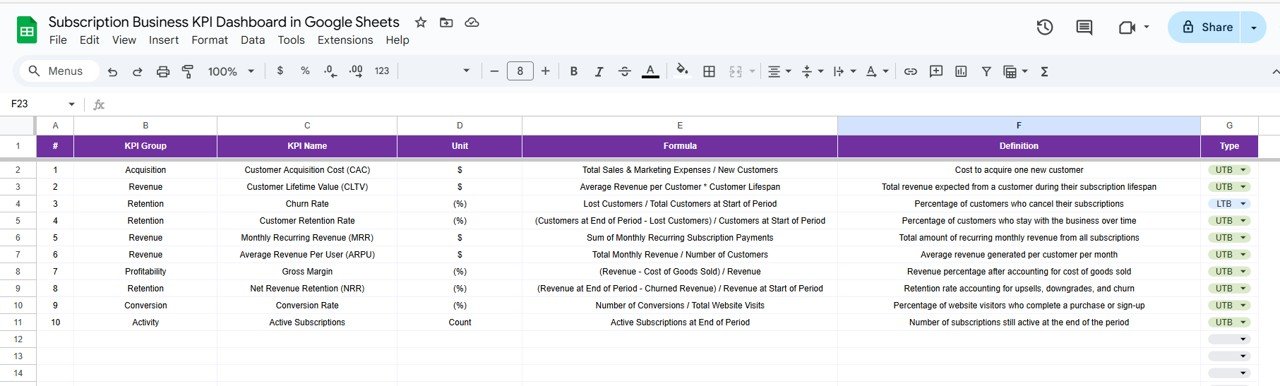
📘 KPI Definition Sheet Tab
-
Centralized list of KPIs with:
-
KPI Name
-
Group
-
Unit of Measurement
-
Formula
-
Description
-
-
Perfect for team training and onboarding.
📦 What’s Inside the Subscription Business KPI Dashboard?
✅ 6 Pre-Built Sheets
✅ Easy Dropdown Month Selector
✅ KPI Categories like MRR, CAC, CLTV, Churn
✅ Conditional Formatting (Up/Down Arrows)
✅ Trend Charts, Comparisons, and Performance Cards
✅ Ready for Google Sheets – No Extra Tools Needed
✅ Customizable to Fit Any Subscription Model
🛠️ How to Use the Dashboard?
-
🔢 Input Your Actual Data in the “Actual Numbers” tab.
-
🎯 Set Monthly and Yearly Targets in the “Target” sheet.
-
🔄 Update Monthly for accurate comparisons.
-
📈 Analyze Performance Trends in the “KPI Trend” tab.
-
🧠 Use Insights to refine acquisition and retention strategies.
👥 Who Can Benefit from This Dashboard?
🎯 SaaS Companies – Track recurring revenue, churn, and growth.
📦 Subscription Boxes – Monitor retention, CAC, and fulfillment.
🎥 Digital Membership Sites – Evaluate content impact on renewals.
🧾 Service Subscriptions – Improve customer LTV and reduce churn.
📊 Startup Founders & Growth Marketers – Gain a data-backed advantage.
⭐ Why You’ll Love It
-
✅ Instant Access – Just open in Google Sheets
-
🧠 No Learning Curve – Simple, intuitive design
-
📈 Visualize Success – Color-coded cards & trend lines
-
🎯 Stay Accountable – Track goals, targets, and gaps
-
💬 Perfect for Reports – Use in team reviews and investor decks
-
🛠 Fully Customizable – Add your KPIs, charts, or brand colors


Reviews
There are no reviews yet.