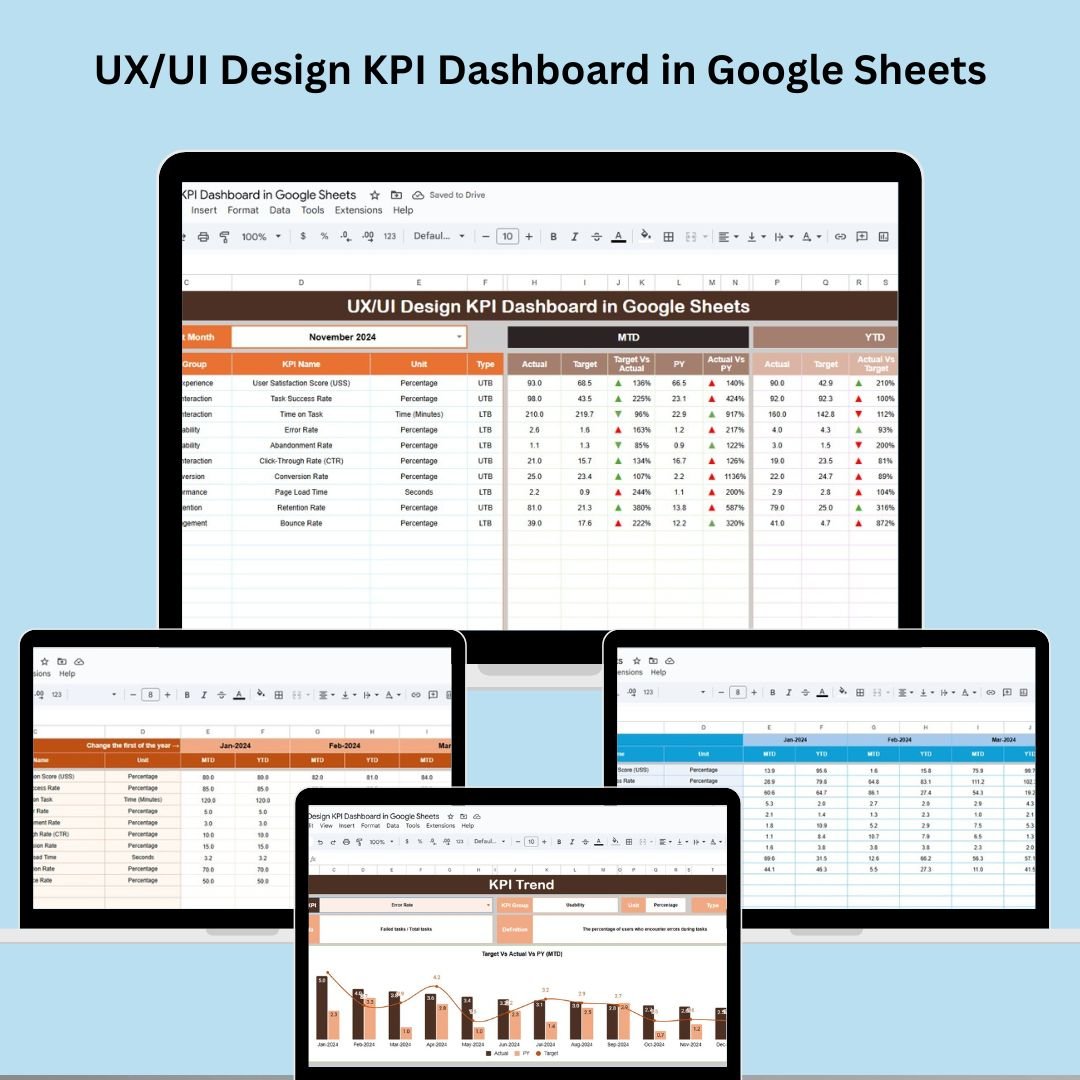
In today’s fast-paced digital world, great design is not just about creativity—it’s about measurable impact. The UX/UI Design KPI Dashboard in Google Sheets is your all-in-one solution to track, evaluate, and improve user experience and interface design using real-time data.
Whether you’re a solo designer, part of an agile product team, or leading a UX department, this ready-to-use dashboard helps you monitor key design KPIs, benchmark performance, and communicate results—all in a visually stunning format right inside Google Sheets.
✨ Key Features of the UX/UI Design KPI Dashboard
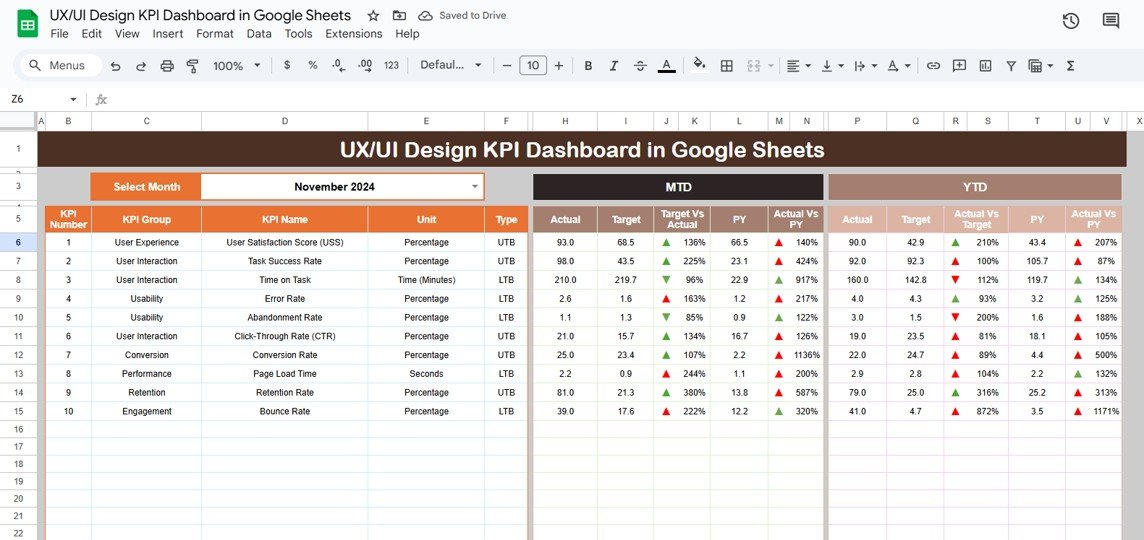
📊 Interactive Dashboard Page
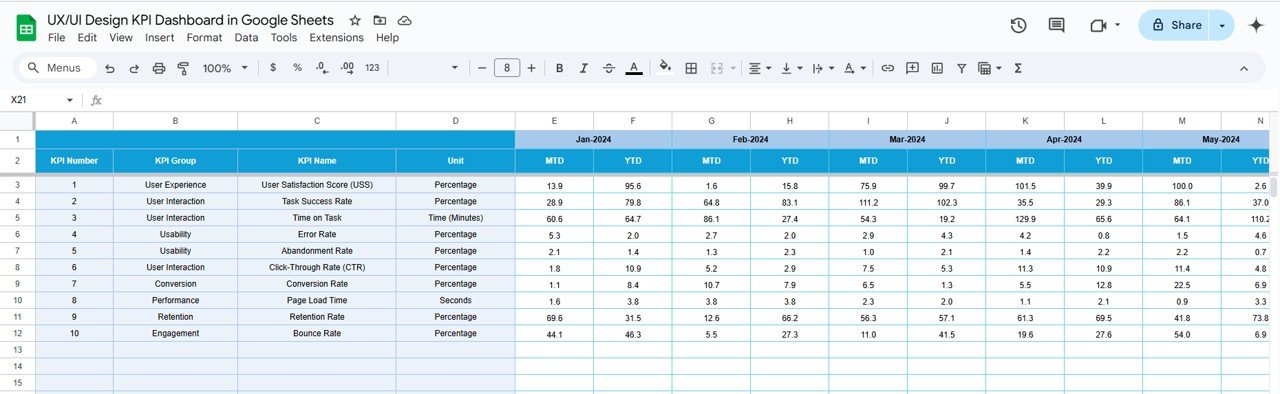
Easily select the month from a dropdown, and the dashboard updates instantly! Compare:
-
MTD (Month-To-Date) and YTD (Year-To-Date) Actuals
-
Target vs Actual
-
Previous Year vs Actual
📈 Arrows with conditional formatting show whether metrics are improving or declining at a glance.
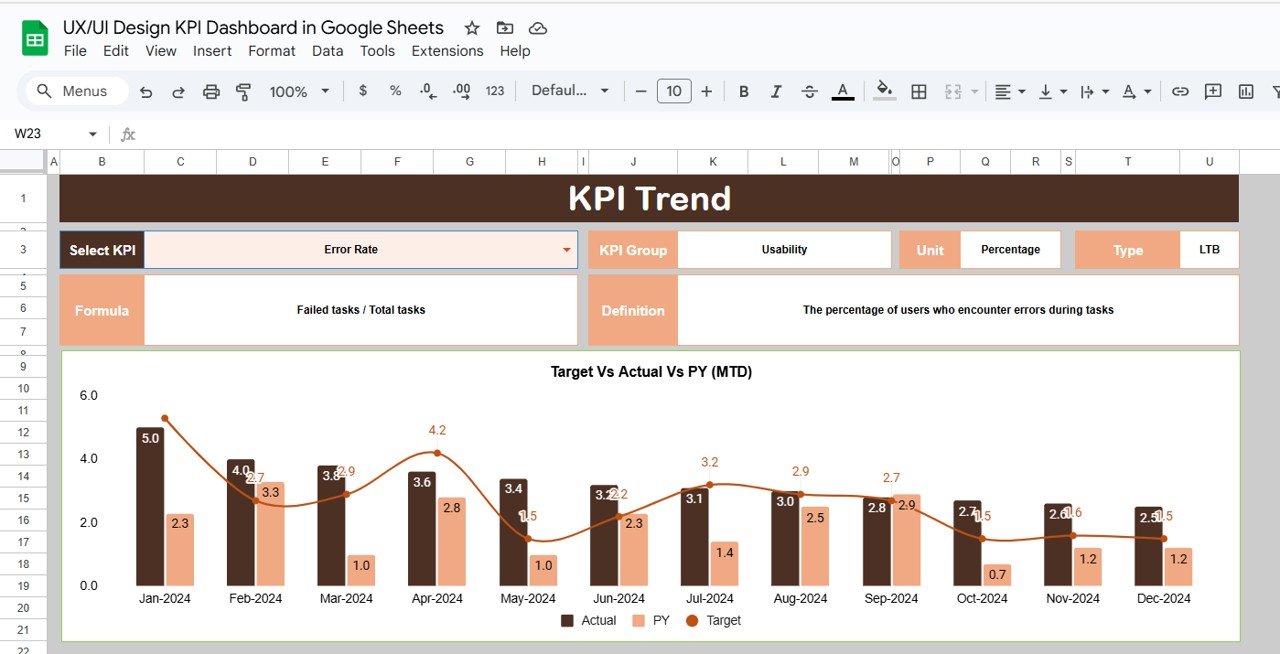
🔍 KPI Trend Sheet
Pick any KPI from the dropdown and instantly get:
-
KPI Group, Unit, Type (UTB/LTB)
-
Formula and Definition
Track historical data trends with precision.
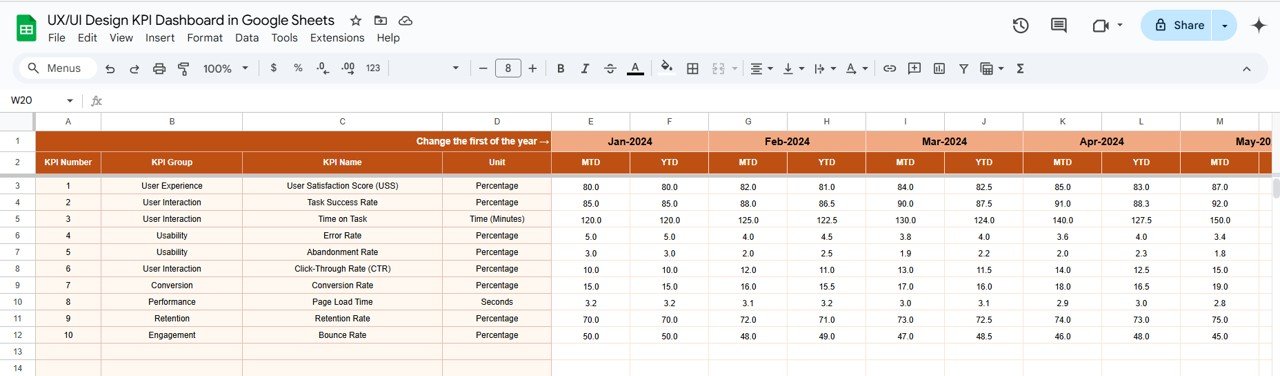
📝 Actual Numbers Input
Enter your actual performance metrics for MTD and YTD in a structured layout. The entire dashboard syncs instantly.
🎯 Target Sheet
Input monthly targets for each KPI—helps you benchmark your design goals.
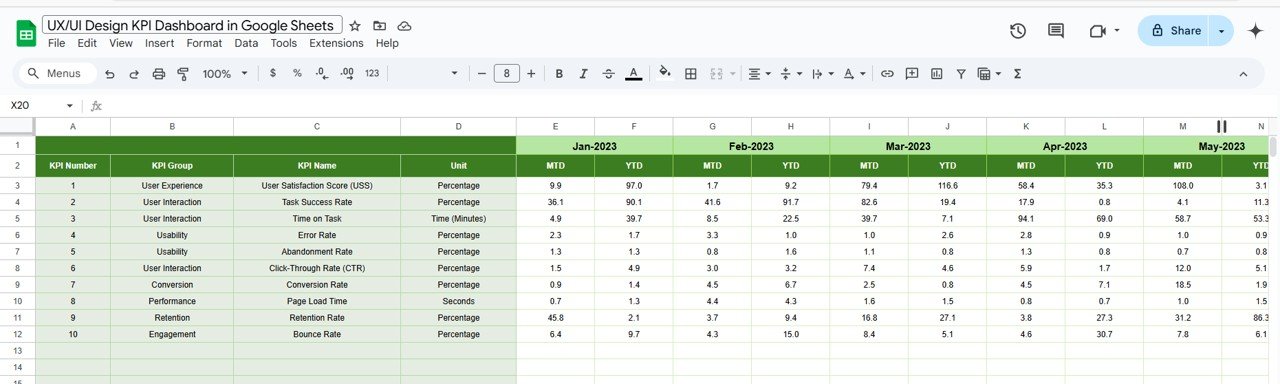
📅 Previous Year Numbers
Compare this year’s metrics against last year’s to evaluate growth, gaps, or regressions.
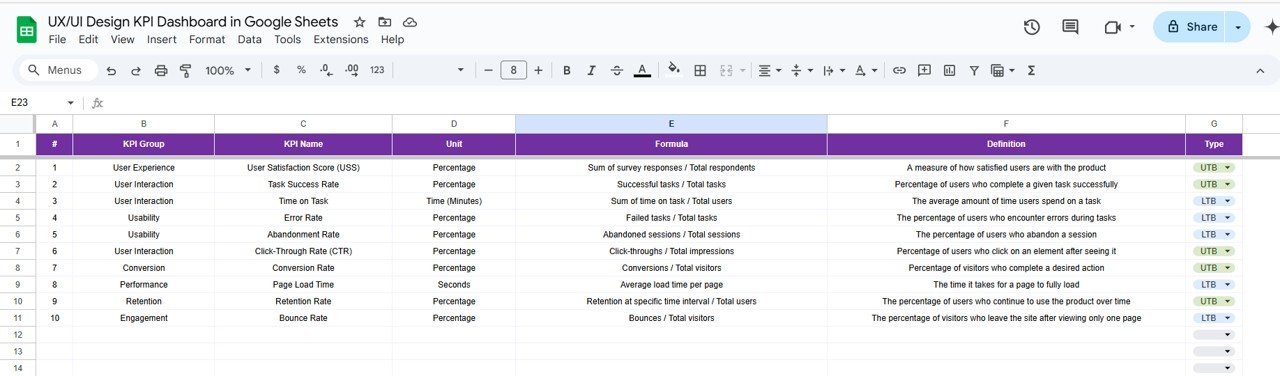
📘 KPI Definition Sheet
Understand each KPI clearly with its:
-
Name, Unit, Formula
-
Definition
-
Type (Lower the Better or Upper the Better)
🧩 What’s Inside the Dashboard?
This dashboard includes 6 smartly designed sheets:
-
Dashboard Sheet – Interactive visualization with dropdowns and arrows
-
KPI Trend Sheet – Focus on individual KPIs with formulas & insights
-
Actual Numbers – Data entry for MTD/YTD
-
Target Sheet – Monthly design goals
-
Previous Year Data – Year-over-year performance view
-
KPI Definition – Clarity on every metric
All connected. All automated. All Google Sheets.
🚀 How to Use the UX/UI Design KPI Dashboard
🧩 Step 1: Open the Google Sheet and go to the “Actual Numbers” tab
📝 Step 2: Enter your design performance data for the selected month
🎯 Step 3: Set your MTD and YTD targets
📅 Step 4: Enter Previous Year’s data (optional)
📊 Step 5: Review dynamic charts, arrows, and trends in the Dashboard & KPI Trend pages
⚙️ Everything auto-updates—no coding required!
👥 Who Can Benefit from This Dashboard?
🎨 UX/UI Designers – Track and showcase your design performance with data
👩💻 Product Managers – Align user experience metrics with product goals
📈 Design Leads – Evaluate team-wide design health
🏢 Startups & Agencies – Report design value to clients and stakeholders
🧪 User Researchers – Monitor satisfaction, load time, errors, and engagement
Whether you work on websites, mobile apps, or software interfaces—this tool delivers!
💡 Why You’ll Love This Template
✔ Google Sheets-Based – No need for complex tools
✔ Real-Time Performance Monitoring
✔ User-Friendly & Editable
✔ Visual Performance Indicators (Arrows, Colors)
✔ Collaborate with Your Team Live
✔ Cost-Effective, No Subscription Needed
Start measuring design success—not just guessing it.
🔗 Click here to read the Detailed blog post
Click here to read the Detailed blog post


Reviews
There are no reviews yet.