

In today’s performance-driven marketing world, affiliate marketing continues to be one of the most cost-effective and scalable acquisition channels. But success hinges on one key factor: data visibility.Affiliate Marketing KPI Dashboard in Google Sheets
That’s why we built the Affiliate Marketing KPI Dashboard in Google Sheets—a ready-to-use, customizable dashboard designed for marketers, agencies, and businesses that want to stay on top of their affiliate program performance.Affiliate Marketing KPI Dashboard in Google Sheets
🚀 What Is the Affiliate Marketing KPI Dashboard in Google Sheets?
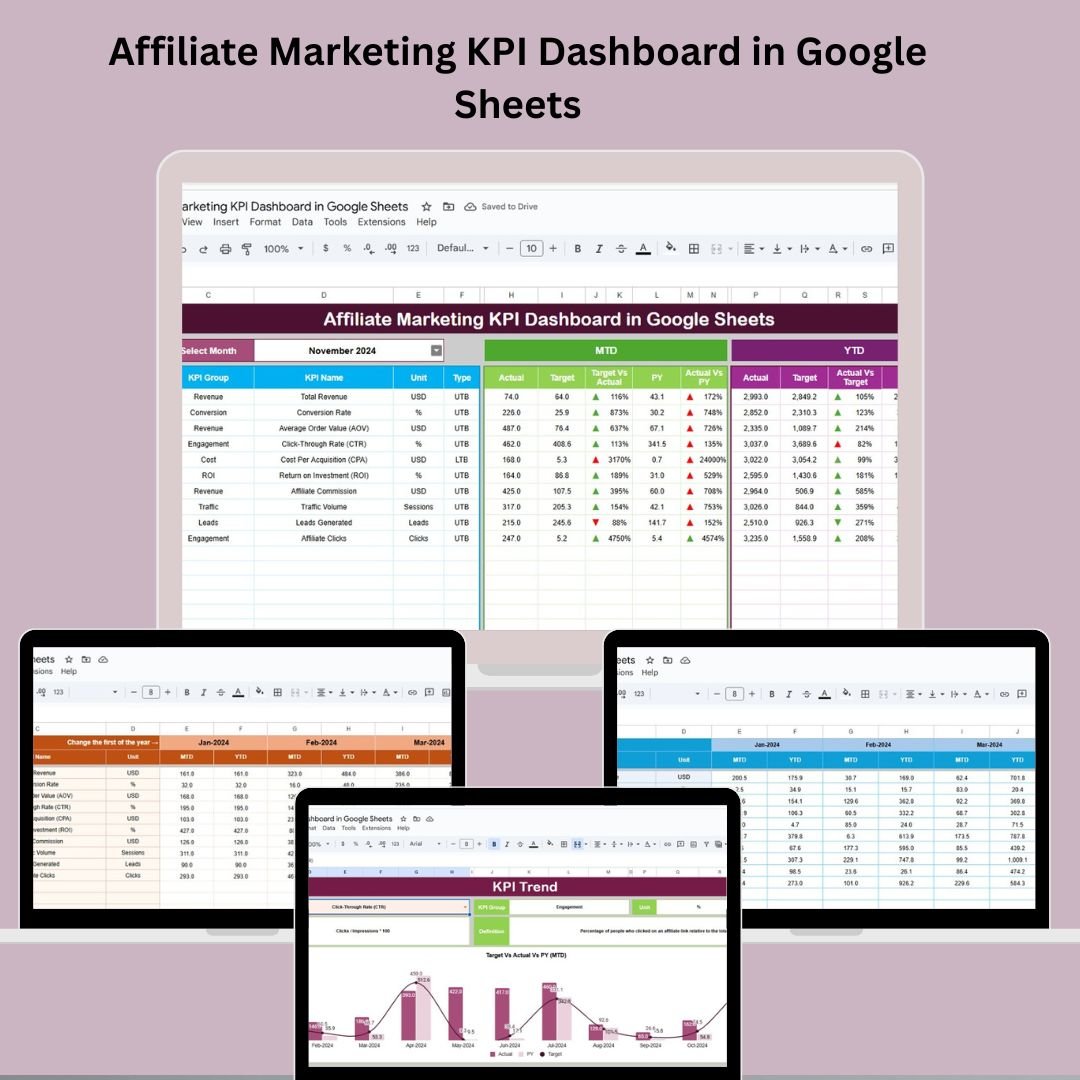
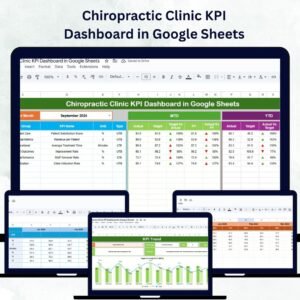
This dashboard is a centralized reporting solution built in Google Sheets that allows you to track vital KPIs, visualize trends, compare targets with actuals, and make data-driven decisions—without the need for expensive tools.
With just a few clicks, you’ll be able to:
🎯 Monitor clicks, conversions, revenue, commissions, ROI, and more
🔄 Compare month-to-date (MTD), year-to-date (YTD), and previous year metrics
📈 Use dynamic visual feedback like arrows and color-coded alerts
🧠 Understand what’s working—and what needs improvement
🧩 Key Features of the Dashboard
The dashboard is structured across six worksheet tabs, each with a clear purpose:
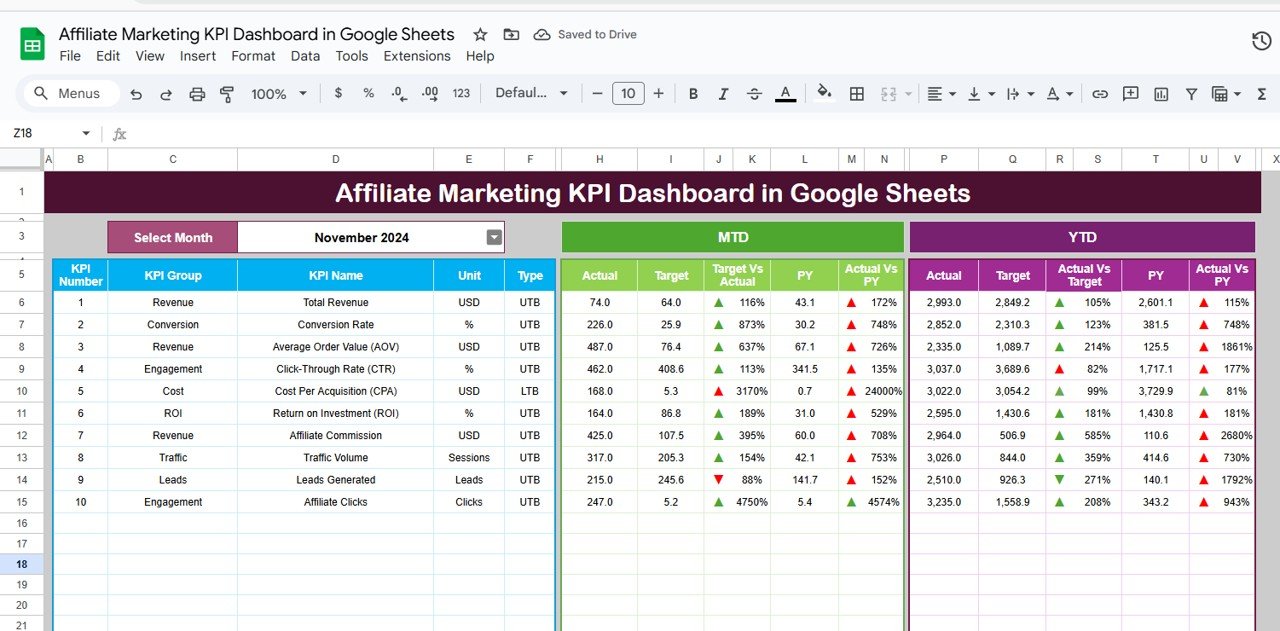
1️⃣ Dashboard Sheet (Main Visual Panel)
Month selector in
D3Instant MTD & YTD visual updates
Compare:
✅ Actual vs Target
📉 Actual vs Previous YearUp/down arrows for visual feedback
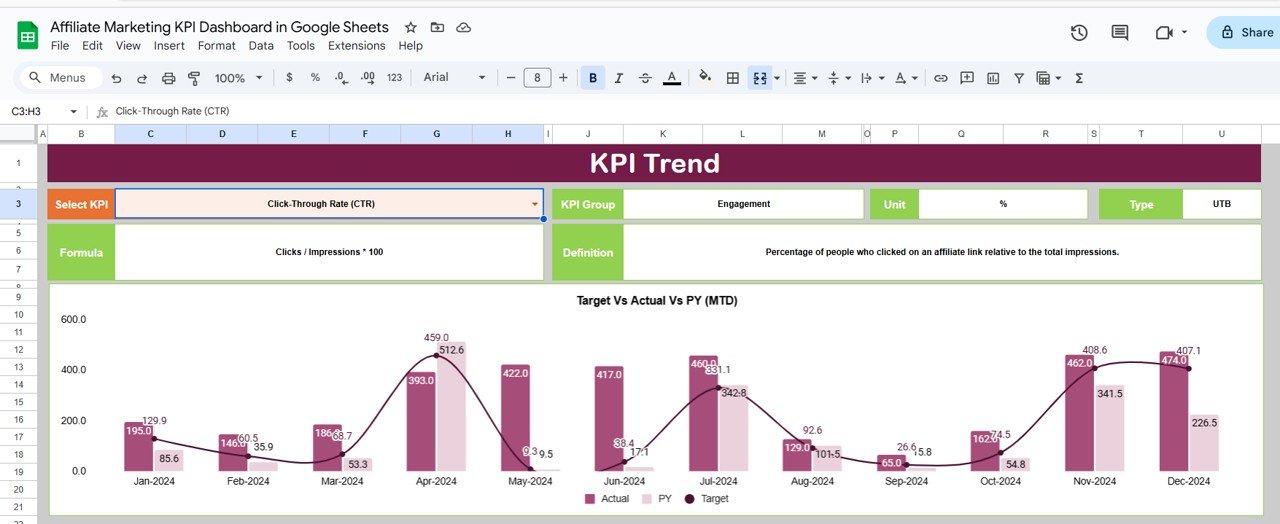
2️⃣ KPI Trend Sheet
Select KPI from dropdown (
C3)View formula, unit, definition, and performance type (UTB/LTB)
Analyze trend line across months
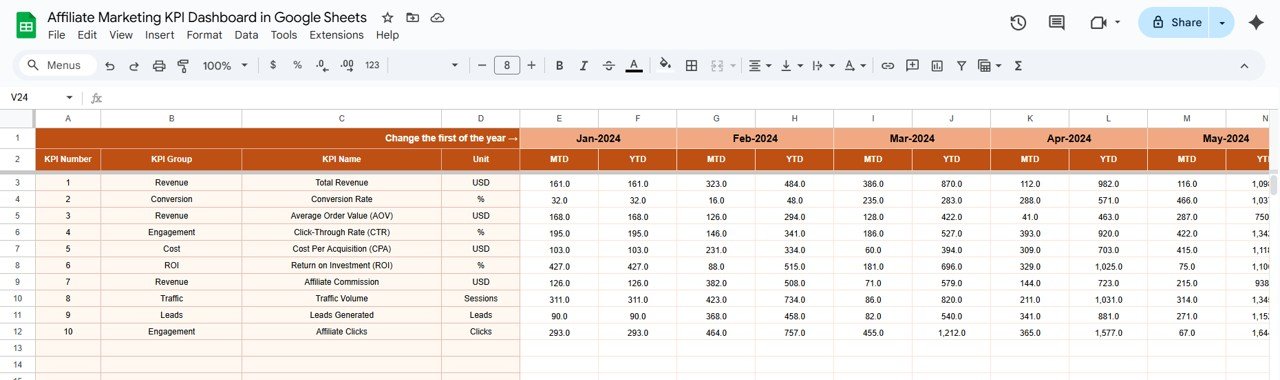
3️⃣ Actual Numbers Sheet
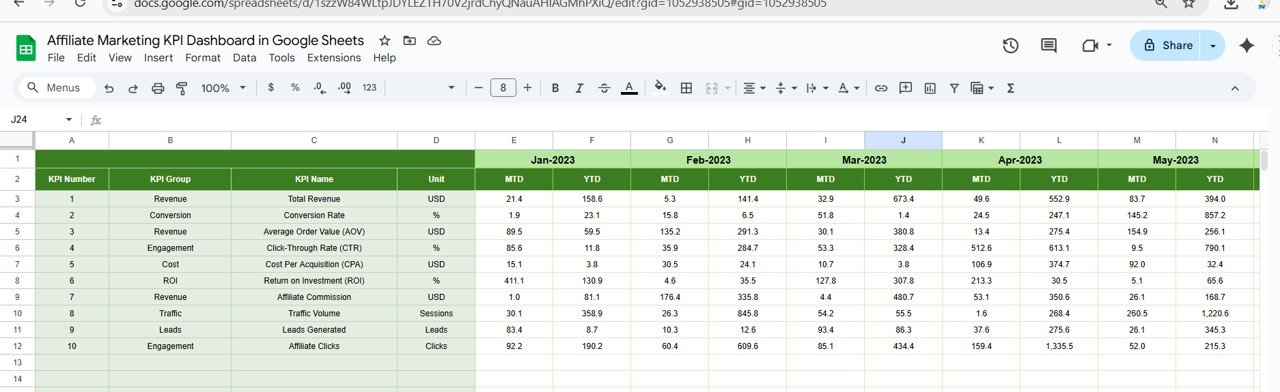
Input real campaign data
Month selector in
E1Auto-feeds the dashboard and trend charts
4️⃣ Target Sheet
Set monthly and annual targets
Auto-compare with actual data
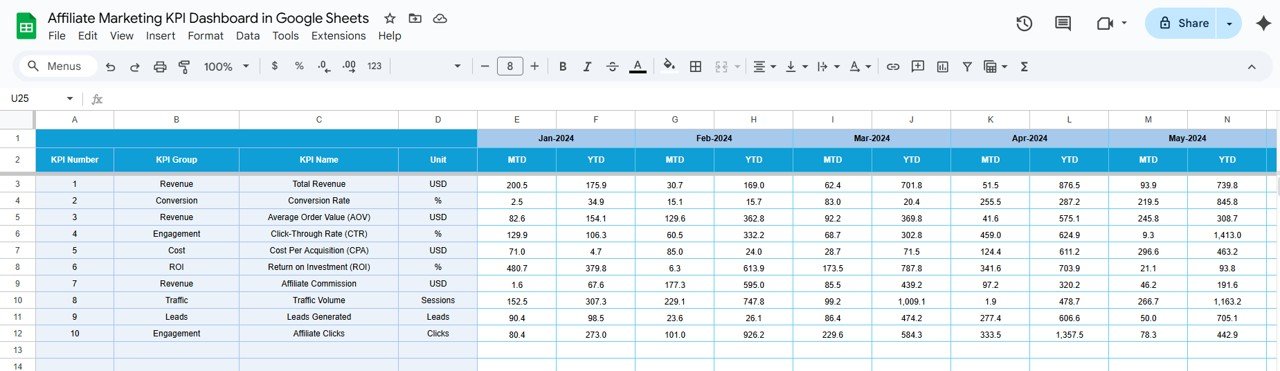
5️⃣ Previous Year Sheet
Input past year’s performance for each KPI
Enables YoY (Year-over-Year) visual analysis
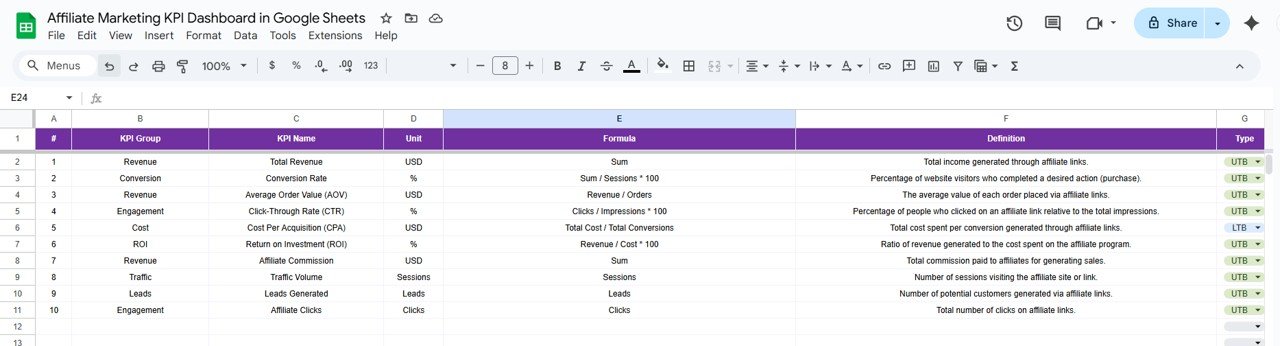
6️⃣ KPI Definition Sheet
Core definitions for all KPIs
Fields include:
🔹 KPI Name
🔹 Group
🔹 Unit of Measure
🔹 Formula
🔹 Type: LTB (Lower the Better) or UTB (Upper the Better)
💡 Sample KPIs Included
Clicks
Conversions
Conversion Rate (%)
Commission Payout
ROI (%)
Revenue
Refund Rate (%)
Affiliate Count
Avg. Commission per Affiliate
You can modify or expand these KPIs easily based on your specific needs.
🏆 Why Use Google Sheets?
✅ Real-Time Collaboration
✅ Free & Accessible Anywhere
✅ Fully Customizable
✅ Integrated with Google Apps Script
✅ Easy Sharing and Access Control
🔧 Opportunities for Improvement
Although the dashboard is fully functional, here are advanced enhancements to consider:
⚙️ Google Apps Script automation
📱 Mobile layout optimization
🗂️ Affiliate segmentation by campaign or type
🚦 SLA tracking for response & payout time
📊 Refund/fraud analysis charts
🏅 Tier assignment (Gold/Silver/Bronze Affiliates)
✅ Best Practices for Affiliate KPI Monitoring
🔹 Standardize KPI definitions
🔹 Use consistent units across all sheets
🔹 Lock definition & target sheets to prevent edits
🔹 Apply conditional formatting for performance alerts
🔹 Review trends monthly
🔹 Backup sheets regularly for version history
👥 Who Should Use This Dashboard?
🔹 Digital Marketing Managers
🔹 Affiliate Program Managers
🔹 Performance Marketing Agencies
🔹 E-commerce Owners
🔹 Bloggers and Influencers managing affiliates
📌 Conclusion
The Affiliate Marketing KPI Dashboard in Google Sheets empowers you to go from guesswork to growth. With real-time insights, automated trend tracking, and intuitive controls, you can fine-tune your strategy and maximize affiliate ROI.
Click here to Read this detailed blog post
🎥 Watch step-by-step tutorials on YouTube
👉 Youtube.com/@NeotechNavigators






Reviews
There are no reviews yet.