



The Food Manufacturing KPI Dashboard in Excel is a powerful tool designed for food manufacturers and production managers to track, analyze, and optimize key performance indicators (KPIs) related to their food production processes. This customizable dashboard allows you to monitor essential aspects of your production line, including production efficiency, quality control, inventory management, resource utilization, and overall profitability.
With real-time data tracking and comprehensive reporting, this Excel-based dashboard provides insights that help you streamline operations, reduce waste, and improve the quality of your products. Whether you are monitoring batch production, raw material usage, or packaging efficiency, the Food Manufacturing KPI Dashboard in Excel enables you to make data-driven decisions to improve performance and drive business success in the competitive food manufacturing industry.
Key Features of the Food Manufacturing KPI Dashboard in Excel
🍞 Comprehensive Production Tracking
Track KPIs such as production volume, yield, efficiency, and downtime. Get a complete view of your manufacturing operations to ensure products are made on time and with minimal waste.
⚡ Real-Time Monitoring of Manufacturing Metrics
Monitor critical production metrics in real time, including machine uptime, production cycles, and raw material consumption. Identify bottlenecks and inefficiencies quickly and take immediate corrective actions.
📈 Quality Control & Product Consistency
Track quality control parameters such as defect rates, inspection results, and compliance with food safety standards. Ensure that all products meet the required quality standards before they are shipped.
📅 Inventory & Resource Management
Manage raw materials, work-in-progress inventory, and finished goods. Optimize resource allocation to prevent overstocking or understocking, ensuring that you have the right materials when needed.
🖥️ Interactive & User-Friendly Interface
The Excel dashboard features interactive charts, filters, and slicers that allow you to dive deep into the data, helping you analyze production performance, quality metrics, and financial performance efficiently.
Why You’ll Love the Food Manufacturing KPI Dashboard in Excel

✅ Track Production Efficiency
Monitor production volume, yield, and efficiency in real-time. Identify areas where you can optimize processes to improve throughput and reduce waste.
✅ Improve Product Quality
Track quality control metrics to ensure consistent product quality and reduce defect rates, ensuring customer satisfaction and compliance with food safety standards.
✅ Optimize Resource Utilization
Monitor resource usage, including raw materials and labor, to ensure that resources are being used efficiently across the production process.
✅ Manage Inventory & Raw Materials
Track inventory levels and manage raw material consumption to reduce waste, avoid stockouts, and maintain smooth production operations.
✅ Make Data-Driven Decisions
Leverage insights from the dashboard to make informed decisions about production schedules, inventory management, and quality control processes, leading to improved overall efficiency and profitability.
What’s Inside the Food Manufacturing KPI Dashboard Template?
- Production Efficiency Tracking: Monitor production output, yield, downtime, and machine performance.
- Quality Control Monitoring: Track defect rates, inspection results, and product consistency to ensure compliance with food safety regulations.
- Inventory & Resource Management: Keep an eye on raw material usage, work-in-progress inventory, and finished goods to optimize inventory management.
- Financial & Cost Analysis: Analyze production costs, overhead, and profitability to improve cost efficiency.
- Customizable KPIs: Adjust the dashboard to track additional KPIs, such as packaging efficiency, labor costs, or energy consumption.
- Interactive Reporting: Use filters and dynamic charts to explore detailed insights into production, quality, and resource utilization.
How to Use the Food Manufacturing KPI Dashboard in Excel
1️⃣ Download the Template: Instantly access your Food Manufacturing KPI Dashboard in Excel.
2️⃣ Input Production Data: Enter data such as production volumes, material usage, and quality control results.
3️⃣ Track & Monitor KPIs: Use the dashboard to monitor key manufacturing metrics and identify inefficiencies.
4️⃣ Analyze & Optimize: Use insights from the dashboard to improve production efficiency, quality, and cost management.
Who Can Benefit from the Food Manufacturing KPI Dashboard in Excel?
🔹 Food Manufacturers & Production Managers
🔹 Quality Control Managers & Food Safety Inspectors
🔹 Supply Chain & Inventory Managers
🔹 Business Owners & Entrepreneurs in the Food Industry
🔹 Operations & Resource Managers
🔹 Data Analysts & Business Intelligence Professionals in Manufacturing
Track, analyze, and optimize your food manufacturing operations with the Food Manufacturing KPI Dashboard in Excel. Monitor production performance, resource allocation, quality control, and costs to improve efficiency and profitability in your manufacturing processes.
Click here to read the Detailed blog post
Visit our YouTube channel to learn step-by-step video tutorials
Youtube.com/@PKAnExcelExpert
Compatibility and Requirements
- Works in Microsoft Excel desktop (Excel 2016 or later, or Microsoft 365).
- The dashboard uses filters and slicers. Microsoft explains slicers in Use slicers to filter data.
Frequently Asked Questions
Which production KPIs does it track?
Production volume, yield, efficiency, downtime, machine uptime, production cycles and raw material consumption.
Does it cover quality control?
Yes. It tracks defect rates, inspection results and compliance with food safety standards.
Can I track inventory?
Yes. It covers raw materials, work-in-progress inventory and finished goods.
Can I add other KPIs?
Yes. You can add KPIs such as packaging efficiency, labor costs or energy consumption.
How do I explore the data?
Use the interactive charts, filters and slicers to look at production, quality and cost results in detail.
Related Food Manufacturing Templates
- Food Manufacturing KPI Dashboard in Power BI: the same topic for Power BI users
- Food Manufacturing KPI Dashboard in Google Sheets: the same topic in Google Sheets
- Food Manufacturing KPI Scorecard in Excel: a scorecard view of food production KPIs
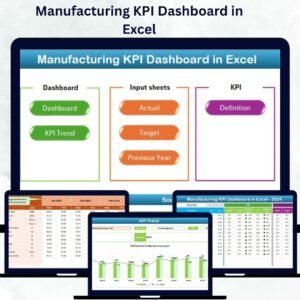
- Manufacturing KPI Dashboard in Excel: general manufacturing KPIs
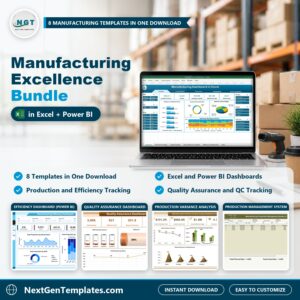
- Manufacturing Excellence Bundle: 8 premium manufacturing templates in one bundle
Browse all Excel KPI dashboards or the Excel manufacturing templates.






















Reviews
There are no reviews yet.