

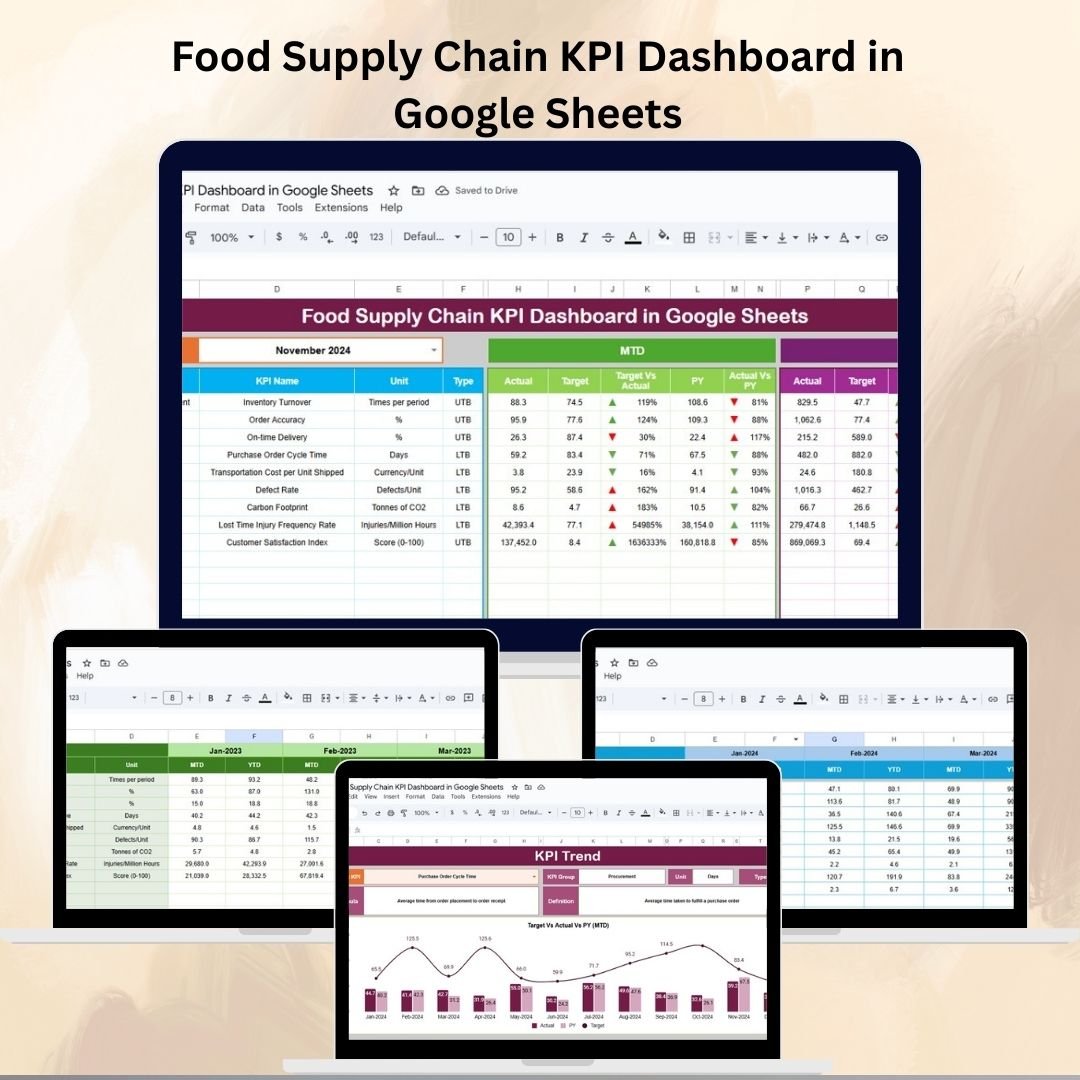
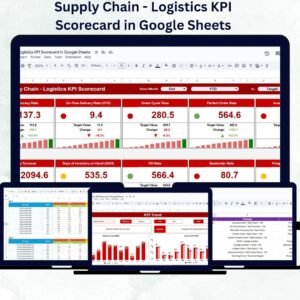
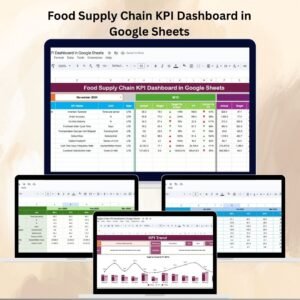
The food supply industry is fast-paced, complex, and highly competitive. 🚚 From farm to fork, businesses must ensure efficiency, quality, and timely delivery to satisfy customers and remain profitable. Managing multiple performance metrics across sourcing, production, logistics, and retail can quickly become overwhelming. That’s why we created the Food Supply Chain KPI Dashboard in Google Sheets — a ready-to-use, interactive, and customizable solution to streamline your supply chain performance management.
This dashboard consolidates key supply chain metrics into one powerful Google Sheets tool, allowing businesses to track monthly and year-to-date (YTD) performance, compare actuals against targets and historical data, and gain actionable insights with ease. It ensures supply chain leaders make data-driven decisions that reduce waste, improve efficiency, and maximize profitability.
🔑 Key Features of the Food Supply Chain KPI Dashboard
📊 Dashboard Sheet Tab
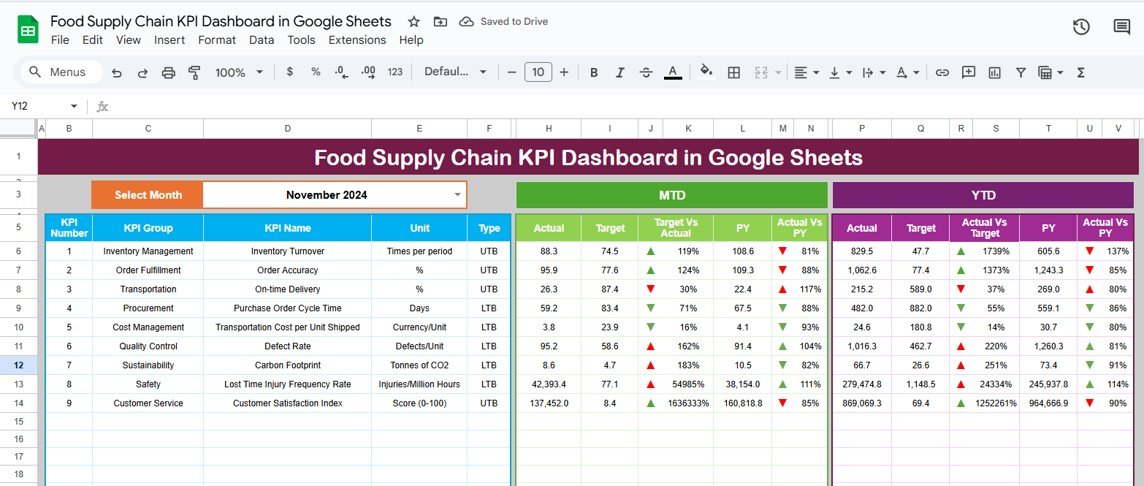
Month Selector – Pick a month to update all dashboard values automatically
MTD & YTD Analysis – Actual vs Target vs Previous Year metrics
Conditional Formatting – Up/Down arrows highlight performance status
Target vs Actual Comparison – Identify gaps in real time
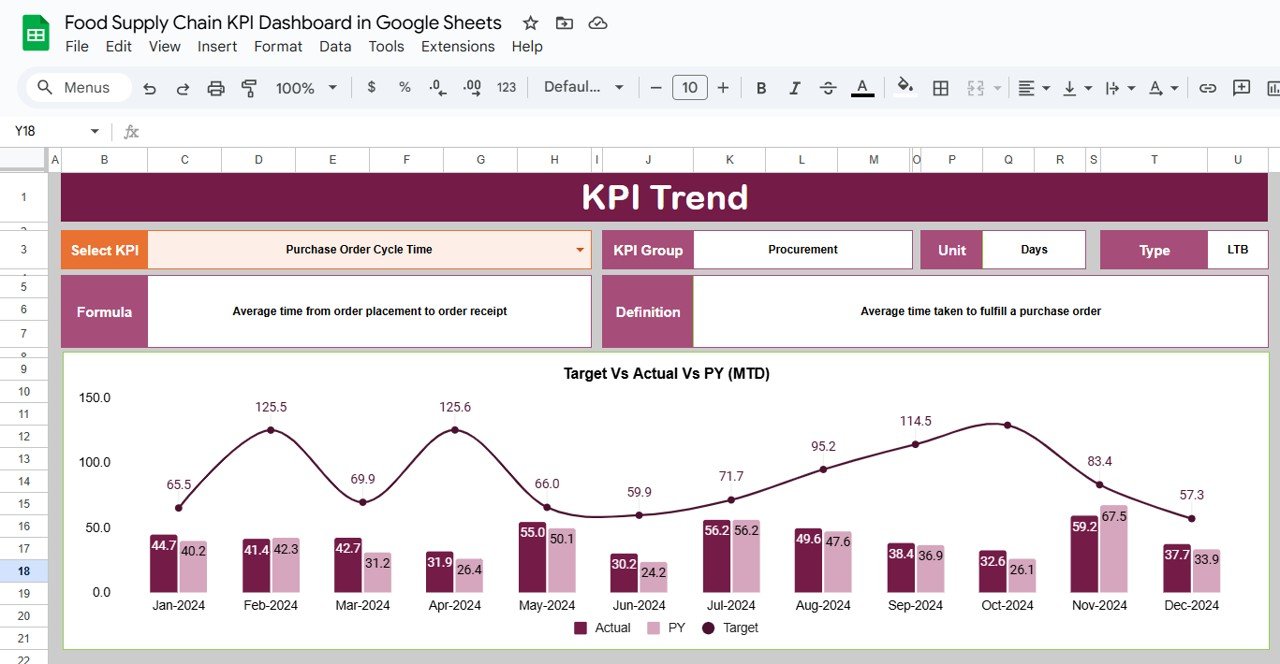
📈 KPI Trend Sheet Tab
KPI Selector – Analyze trends for individual KPIs
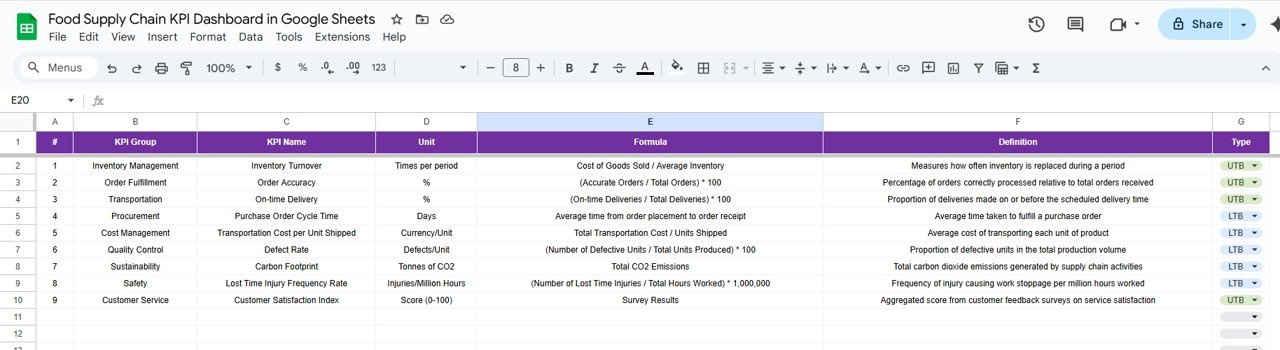
KPI Details – Group, Unit, Formula, Type (UTB/LTB), and Definition
Trend Analysis – Detect performance improvements or bottlenecks
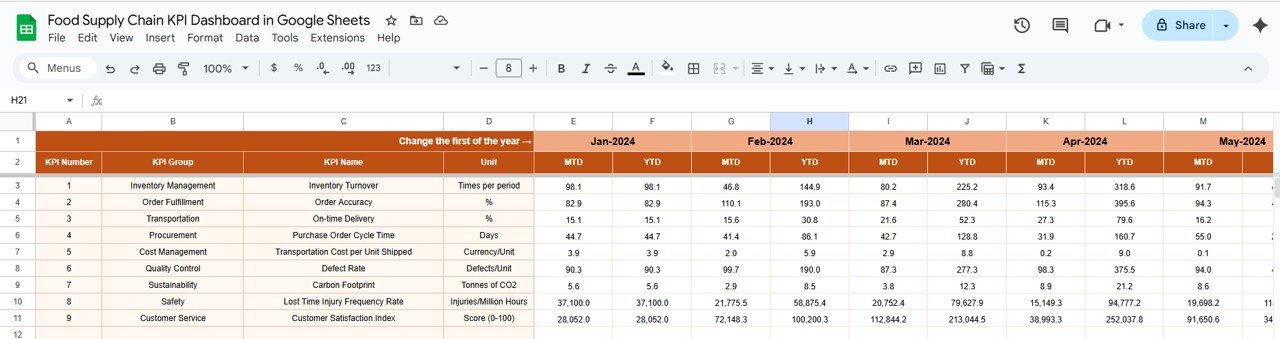
🧾 Actual Numbers Sheet Tab
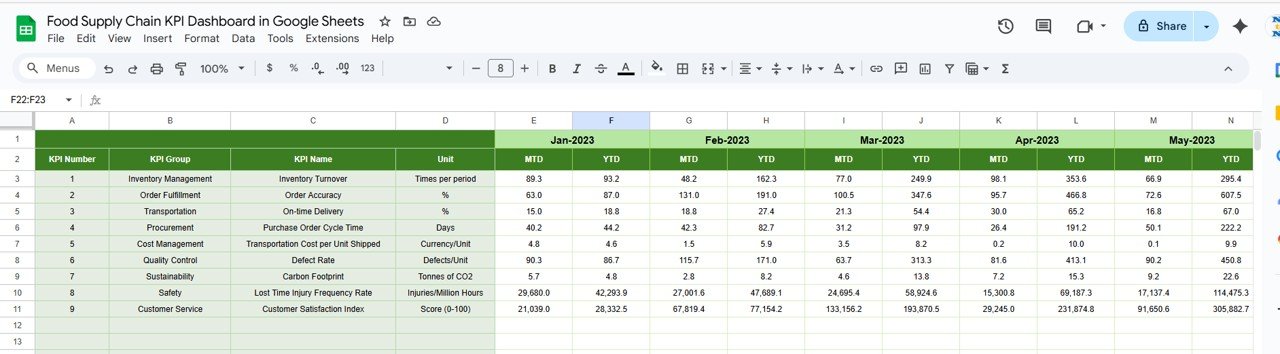
Input real performance data for MTD and YTD
Dashboard updates dynamically for accuracy
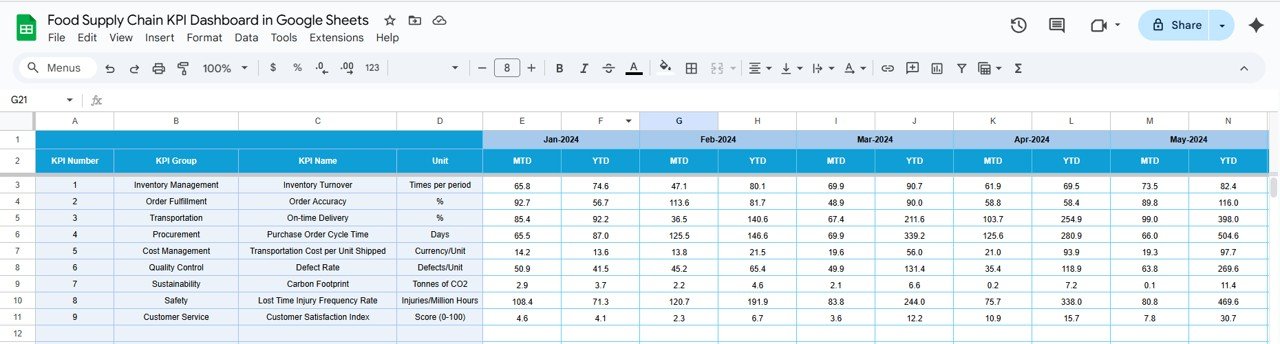
🎯 Target Sheet Tab
Define MTD and YTD targets for all KPIs
Track progress against goals
📊 Previous Year Numbers Sheet Tab
Enter last year’s data for benchmarking
Evaluate long-term improvement trends
📘 KPI Definition Sheet Tab
Master reference for KPI Name, Group, Formula, Unit, and Type
Ensures consistency and transparency
📦 What’s Inside the Dashboard?
✅ Dashboard Tab – Central hub with KPI cards and charts
✅ KPI Trend Tab – Analyze individual metrics in depth
✅ Actual Numbers Tab – Input real-time performance data
✅ Target Tab – Store monthly & yearly goals
✅ Previous Year Tab – Compare with historical data
✅ KPI Definition Tab – Clear documentation for each KPI
✅ Pre-Filled Sample Data – Jump-start usage instantly
🧠 How to Use the Dashboard
Set KPI Targets – Populate the Target sheet with MTD & YTD goals
Input Actual Data – Regularly update Actual Numbers for accuracy
Add Previous Year Data – Maintain benchmarks for historical comparison
Review Dashboard – Use visuals to identify trends & underperforming areas
Deep Dive Trends – Use KPI Trend tab for root cause analysis
Share with Teams – Collaborate in real time with Google Sheets access
👥 Who Can Benefit from This Dashboard?
🏭 Food Manufacturers – Monitor production efficiency & wastage
🚛 Logistics Providers – Track delivery performance & timeliness
🛒 Retail Chains – Evaluate supplier reliability & inventory levels
✅ Quality Assurance Teams – Ensure compliance with food safety standards
💼 Procurement Teams – Optimize vendor relationships and sourcing costs
⭐ Advantages of Using the Food Supply Chain KPI Dashboard
📑 Centralized Tracking – All KPIs in one place
📊 Visual Insights – Conditional formatting & charts make analysis easy
⏱ Time-Saving – No more manual calculations
🔄 Historical Comparison – Benchmark against last year’s data
🤝 Collaboration-Ready – Multiple users can update simultaneously
🛠 Customizable – Add more KPIs or adapt to your unique supply chain
🔗 Click here to read the Detailed blog post
Watch the step-by-step video Demo:








Reviews
There are no reviews yet.