

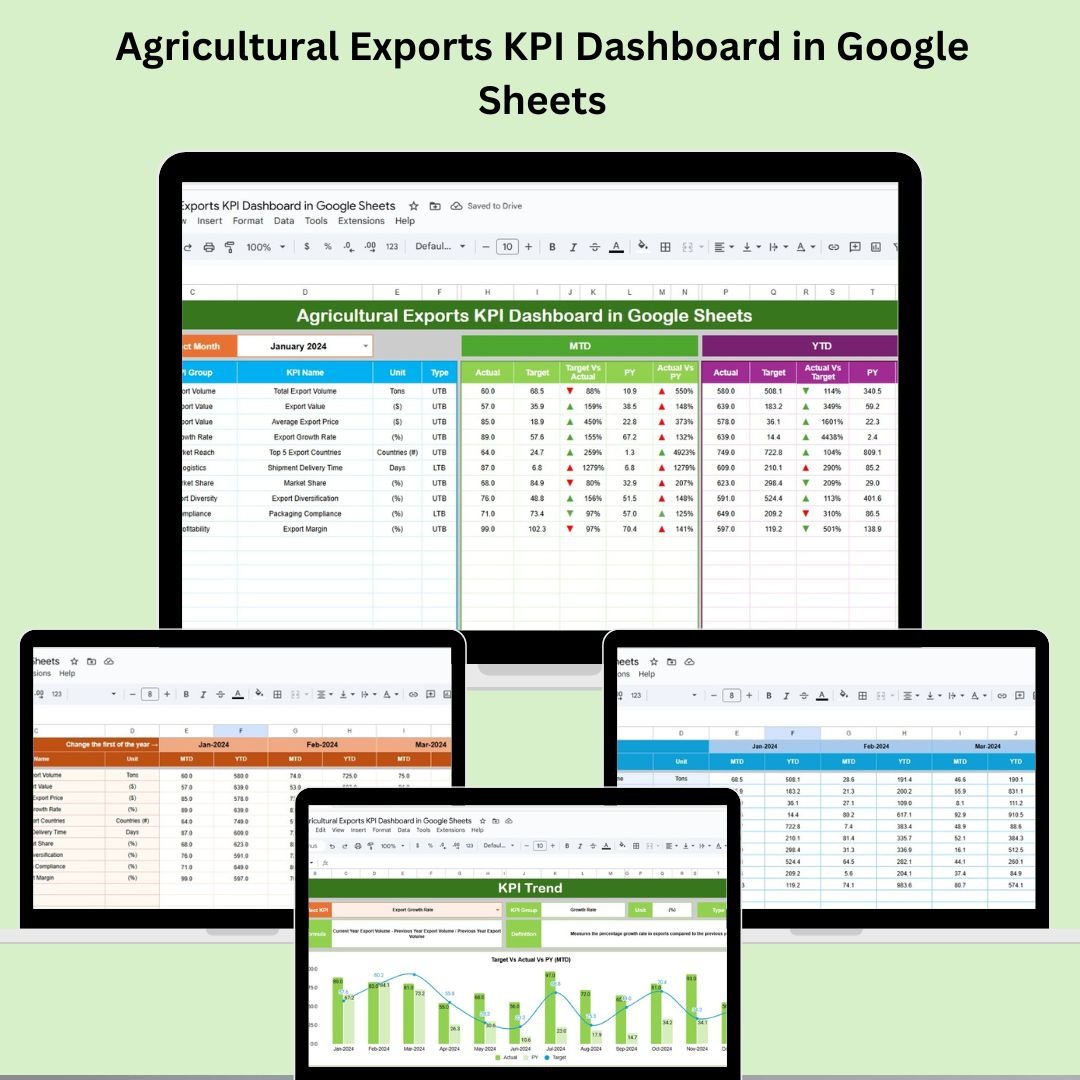

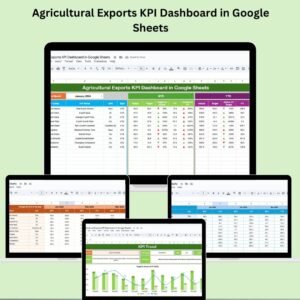
Managing agricultural exports is more than moving products—it’s about driving results. The Agricultural Exports KPI Dashboard in Google Sheets is your all-in-one solution to monitor performance, track export goals, and make strategic decisions backed by real-time data.
Designed for producers, exporters, cooperatives, and agribusiness stakeholders, this dashboard empowers you to visualize trends, optimize efficiency, and boost profitability—without needing any technical skills.
📊 Key Features of Agricultural Exports KPI Dashboard
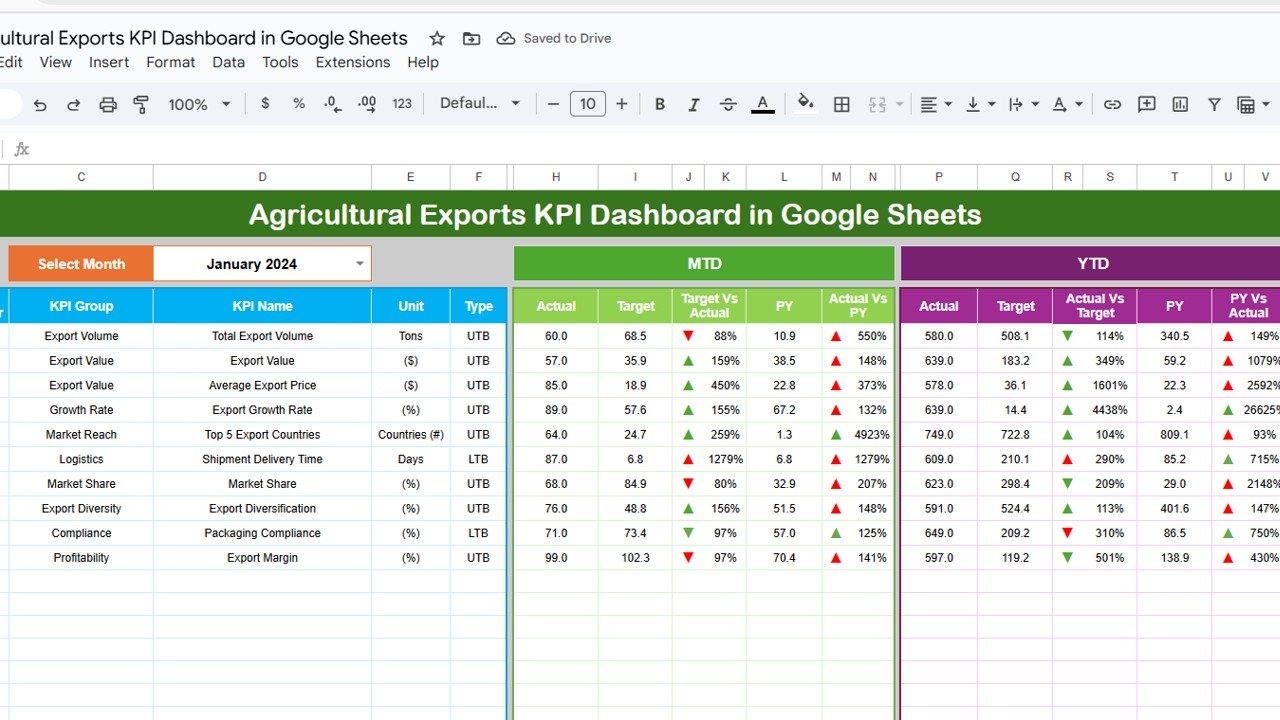
📌 MTD & YTD Performance Tracking
Easily compare Month-to-Date and Year-to-Date figures with:
Actual vs Target Values
Actual vs Previous Year
Automatic up/down arrows for performance clarity
📉 Dynamic Charts for Insightful Visualization
Gain instant clarity with charts like:
Total Export Volume by Product Type
Export Revenue vs Target
Export Growth by Region
Total Exports by Month
🔁 Auto-Update Functionality
Change the month in one click (Cell E1), and watch all KPIs update across the dashboard instantly.
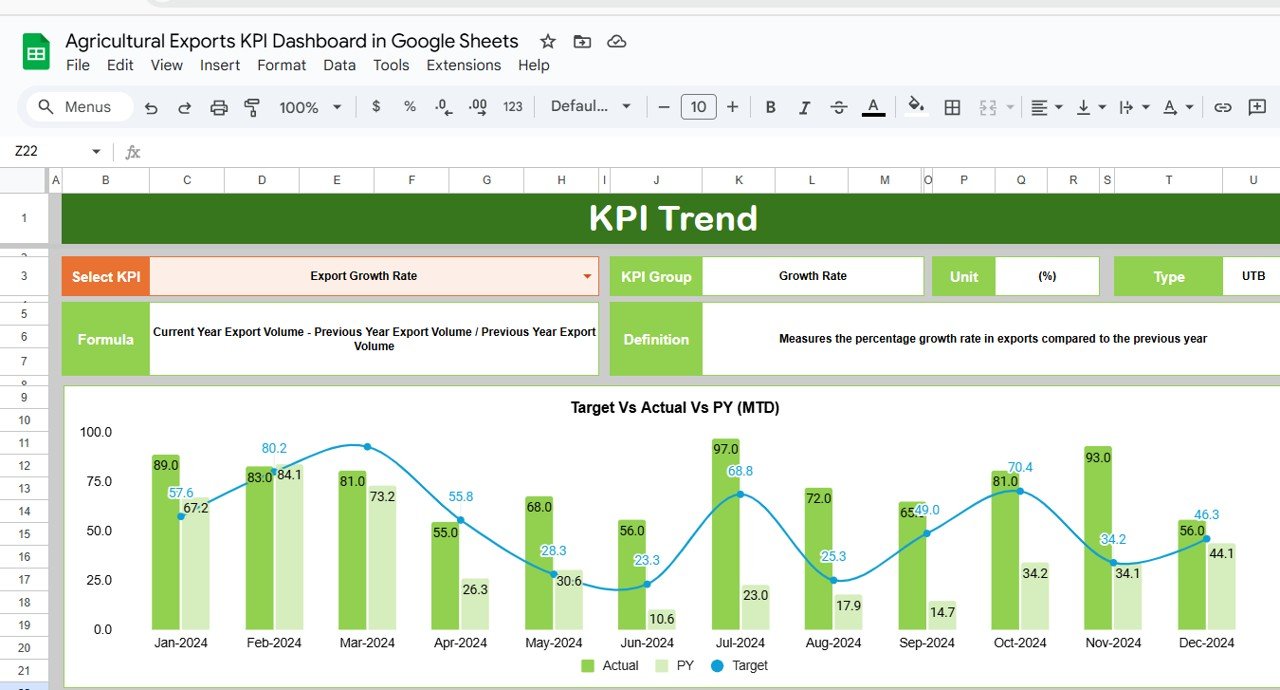
📊 KPI Trend Sheet
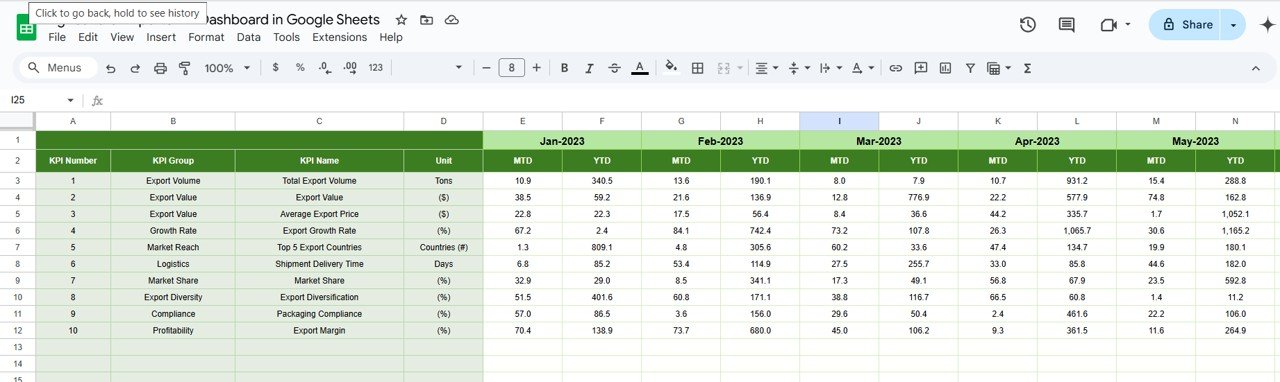
Select individual KPIs and monitor their movement over time. Each KPI includes:
Group, Unit, Type (UTB/LTB)
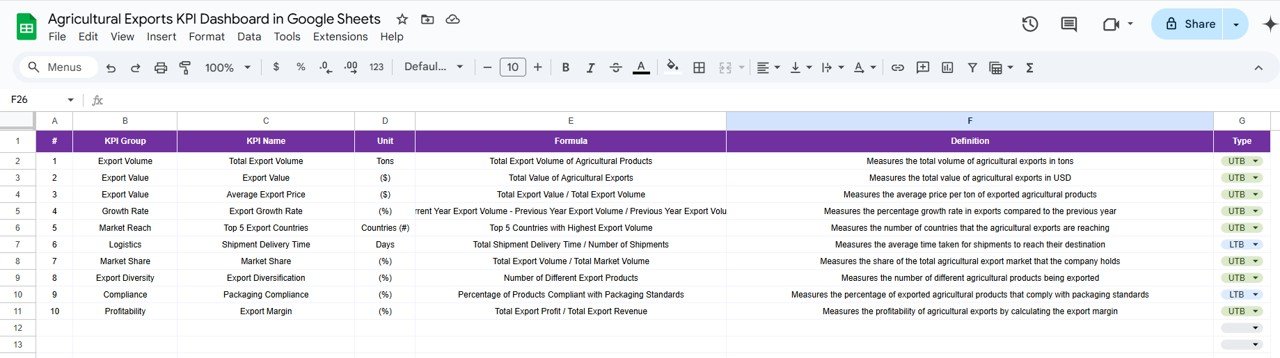
Formula and Definition for transparency
📋 KPI Definition Sheet
Stay consistent with a dedicated definition tab—your one-stop guide for KPI structure and tracking logic.
📦 What’s Inside the Dashboard?
This Google Sheets dashboard includes 6 professionally structured worksheets:
Dashboard Sheet – Real-time KPIs, goal comparison & charts
KPI Trend Sheet – Track performance history by KPI
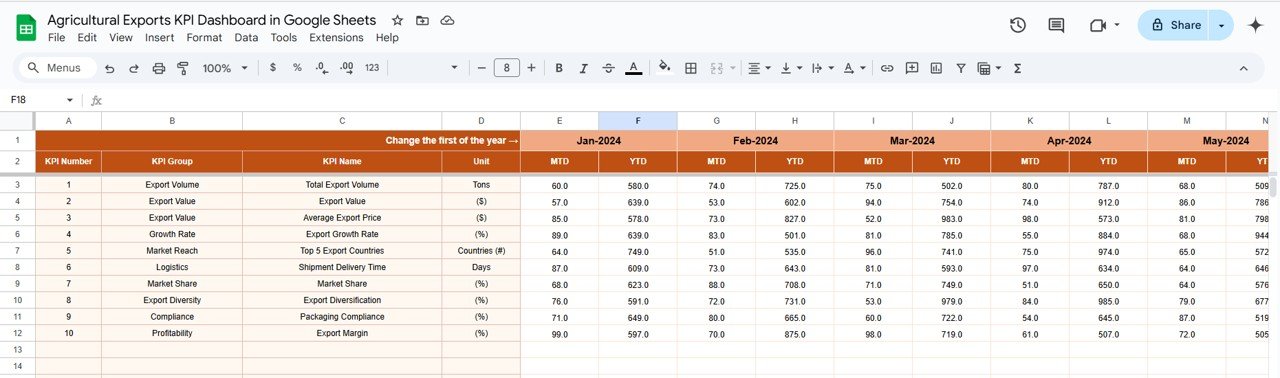
Actual Number Sheet – Enter current data by month
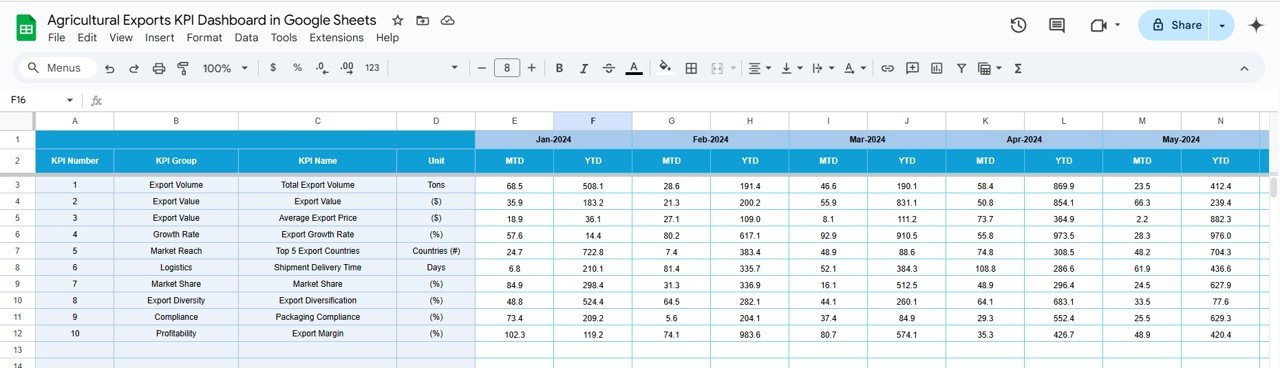
Target Sheet – Input KPI targets for better comparison
Previous Year Sheet – Add historical data for trend analysis
KPI Definition Sheet – Maintain formula transparency and uniformity
💡 Built-in dropdowns, formatting, and slicers make interaction smooth—even for non-tech users!
🚀 How to Use the Dashboard
🖊️ Step 1: Input export data in the Actual Number Sheet
🎯 Step 2: Set monthly and yearly targets in the Target Sheet
📈 Step 3: Add last year’s data for benchmark comparisons
📊 Step 4: Use the Dashboard and Trend tabs to analyze and plan
🔁 Step 5: Update regularly to keep performance metrics accurate
No coding required. No complex tools. Just smart data tracking in Google Sheets.
👩🌾 Who Can Benefit from This Dashboard?
🌍 Exporters & Trade Companies – Monitor volumes and revenue by region
📦 Agricultural Producers – Track product-wise export efficiency
🏢 Agri-Business Analysts – Analyze trends and optimize reporting
📊 Cooperative Societies – Align KPIs with growth goals
📈 Government & Policy Bodies – Support data-backed agricultural policies
💼 Logistics Teams – Track performance against time-sensitive targets
Whether you’re exporting rice, wheat, fruits, or vegetables, this dashboard keeps your data fresh and your decisions sharp.
🎯 Why You Need This Dashboard
✅ Built in Google Sheets – No special software required
✅ Fully Editable – Add KPIs, adjust formulas, or redesign views
✅ Real-Time Collaboration – Team members can edit live
✅ Monthly Controls – Easily switch month and view instant insights
✅ Zero Learning Curve – Designed for anyone to use
✅ Visually Clear – Arrows, charts, and highlights make insights obvious
🔍 Click here to read the Detailed blog post
Click here to read the Detailed blog post
Watch the step-by-step video Demo:
🎥 Visit our YouTube channel to learn step-by-step video tutorials
Youtube.com/@NeotechNavigators
Compatibility and Requirements
- Works in Google Sheets. You need a free Google account and a web browser.
- You pick the month from a dropdown on the Dashboard sheet. Google explains dropdowns in Create an in-cell dropdown list.
Frequently Asked Questions
Which sheets are included?
Six sheets: Dashboard, KPI Trend, Actual Number, Target, Previous Year and KPI Definition.
How do I change the month?
Select the month in cell E1 of the Dashboard sheet. All KPIs and charts update to that month.
How do I enter my export data?
Enter your monthly figures in the Actual Number sheet and your goals in the Target sheet. Add last year’s figures to the Previous Year sheet to compare against them.
Which charts does the dashboard show?
Total Export Volume by Product Type, Export Revenue vs Target, Export Growth by Region and Total Exports by Month.
Is there an Excel or Power BI version?
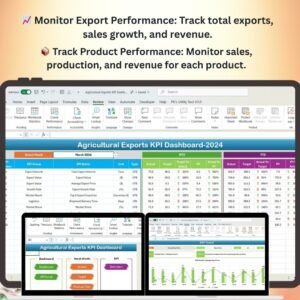
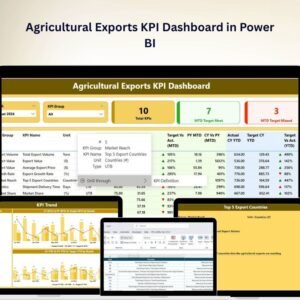
Yes. See the Agricultural Exports KPI Dashboard in Excel and the Agricultural Exports KPI Dashboard in Power BI.
Related Agricultural Export Templates
- Agricultural Exports KPI Dashboard in Excel: the same KPIs in Excel
- Agricultural Exports KPI Dashboard in Power BI: the Power BI edition
- Agricultural Exports KPI Scorecard in Excel: a scorecard view of export KPIs
- Agro Export Companies Dashboard in Excel: a dashboard for agro export companies
- Export Compliance KPI Dashboard in Excel: KPIs for export compliance
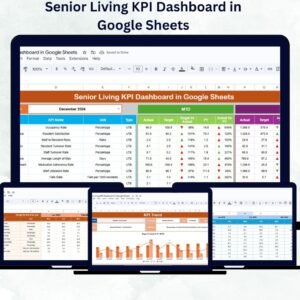
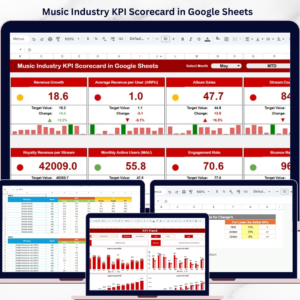
Browse all Google Sheets KPI dashboards.





Reviews
There are no reviews yet.