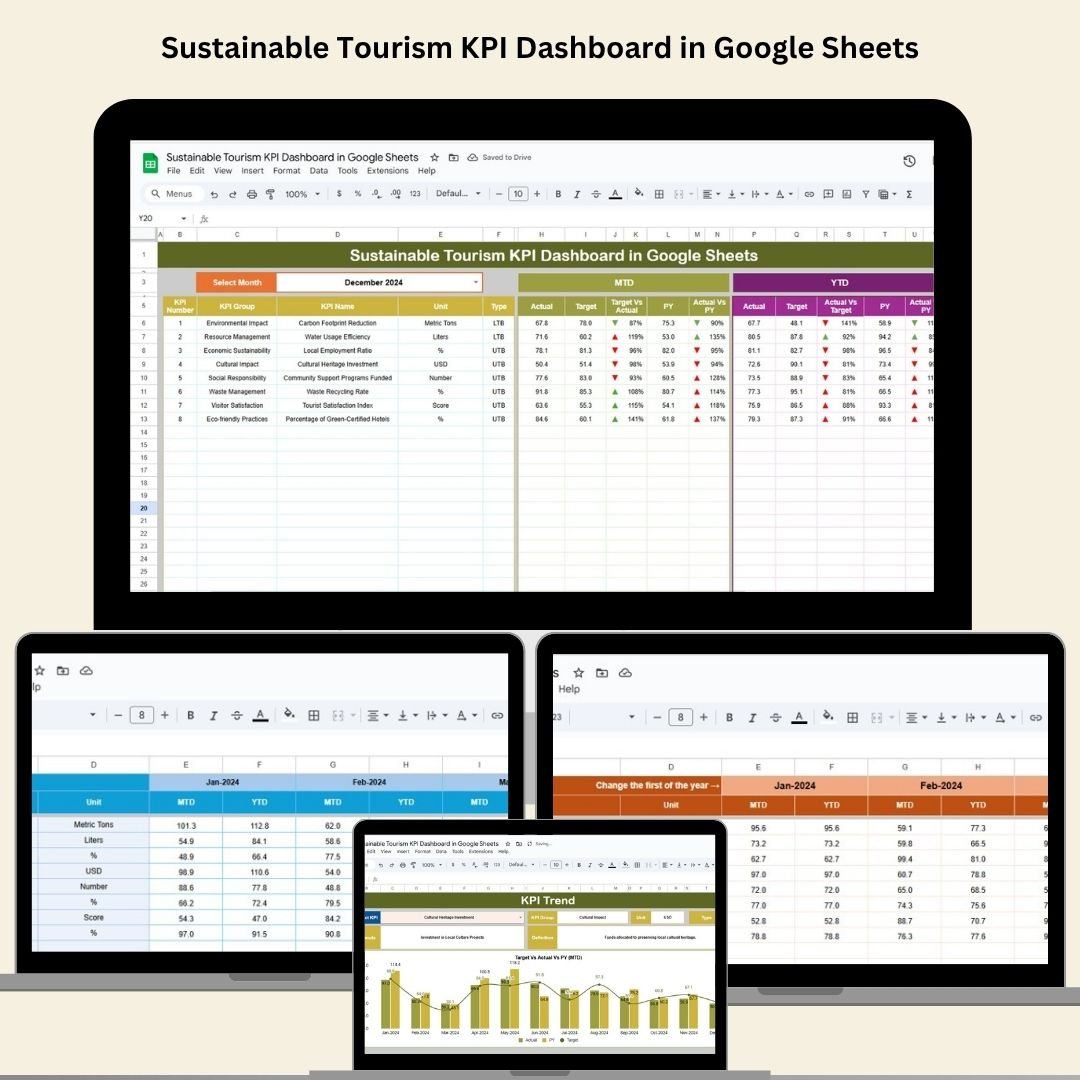
In today’s eco-conscious world, sustainability isn’t just a trend—it’s a responsibility. The Sustainable Tourism KPI Dashboard in Google Sheets gives tourism businesses the power to track environmental, social, and economic impact with precision. From carbon footprint to community engagement, this all-in-one dashboard helps you measure what truly matters.
🧭 Key Features of the Sustainable Tourism KPI Dashboard
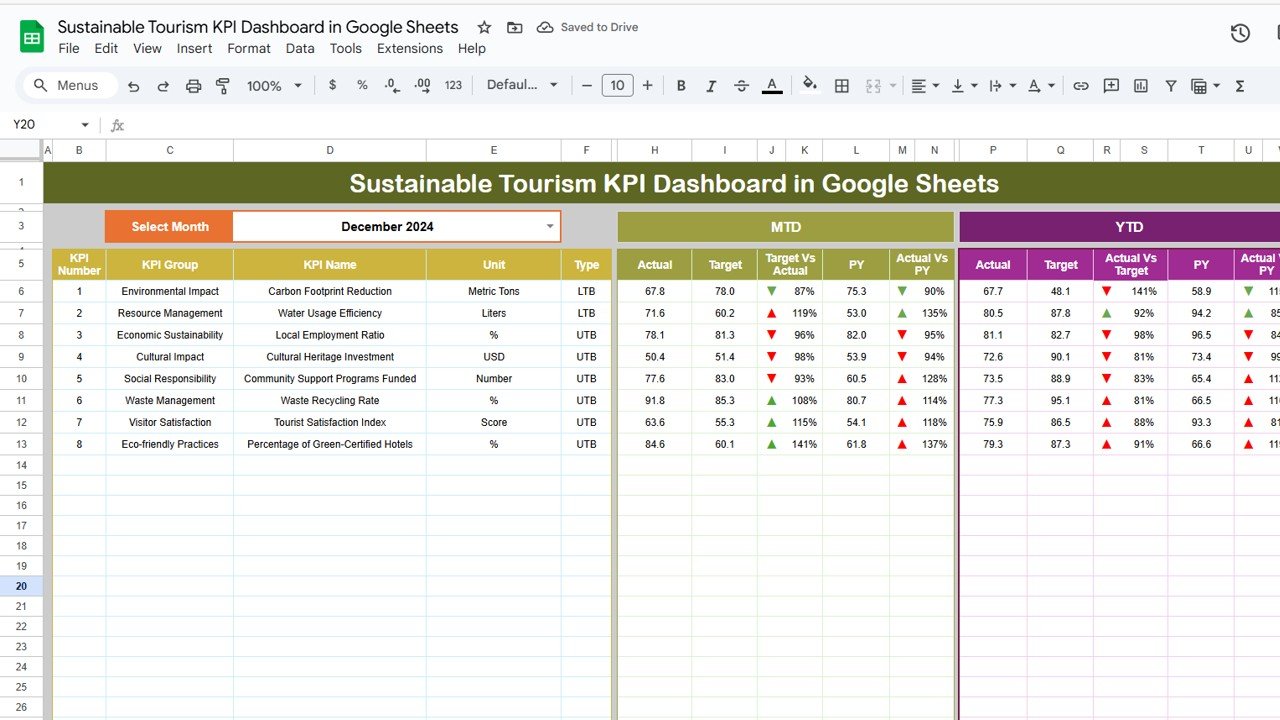
📊 Interactive Dashboard Sheet
-
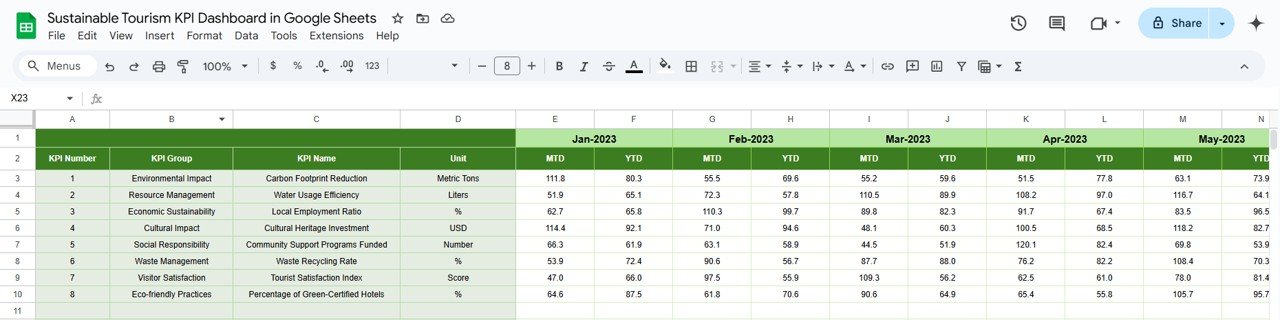
✅ MTD & YTD Actuals – Stay updated with current and year-to-date performance
-
🎯 Target vs Actual – Instantly see which KPIs are on track or need improvement
-
📆 Previous Year Comparison – Compare against last year’s numbers
-
🔽 Month Dropdown (Cell D3) – Select a month and auto-refresh the entire dashboard
-
🔺🔻 Conditional Formatting – Visual indicators for fast performance assessment
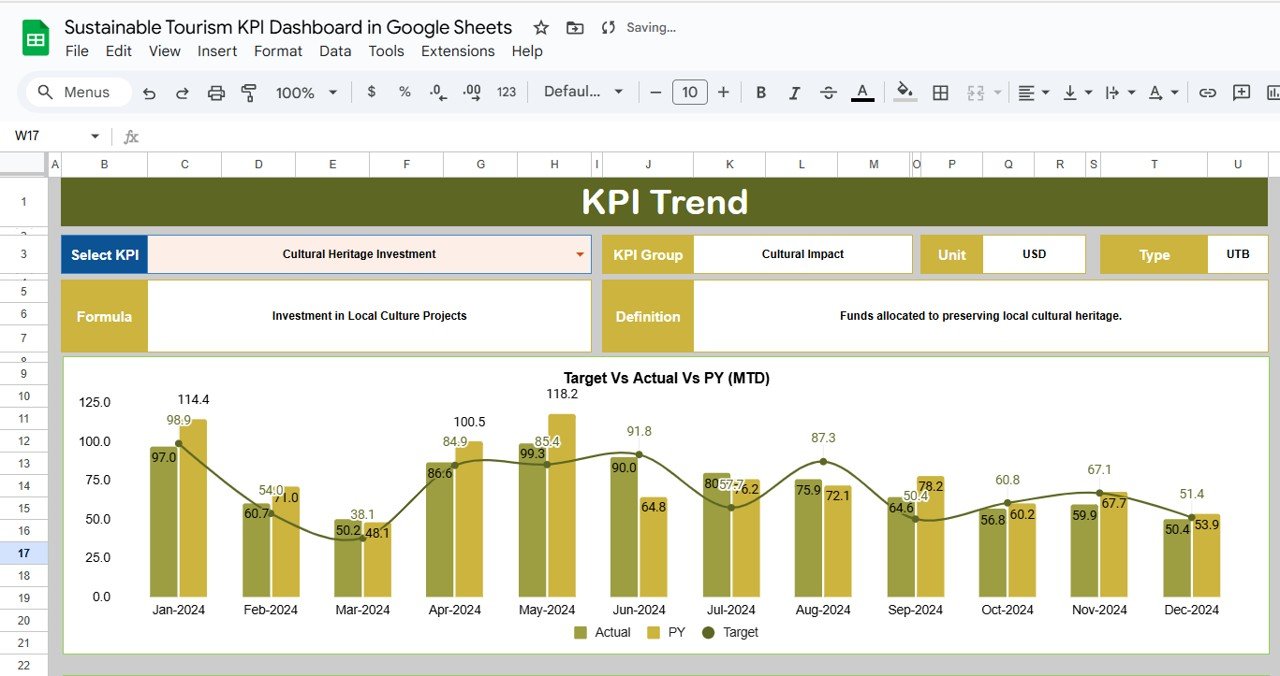
📈 KPI Trend Sheet Tab
-
🔍 Select any KPI to analyze historical trends
-
🧮 View its Group, Unit, Formula, Definition, and whether it’s LTB (Lower the Better) or UTB (Upper the Better)
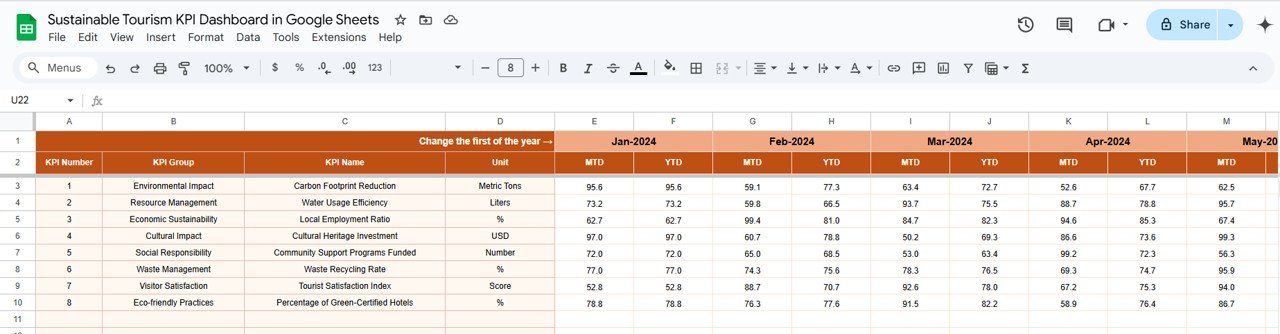
📥 Data Entry Made Easy
-
Actual Numbers Sheet – Enter MTD/YTD actuals; the dashboard updates automatically
-
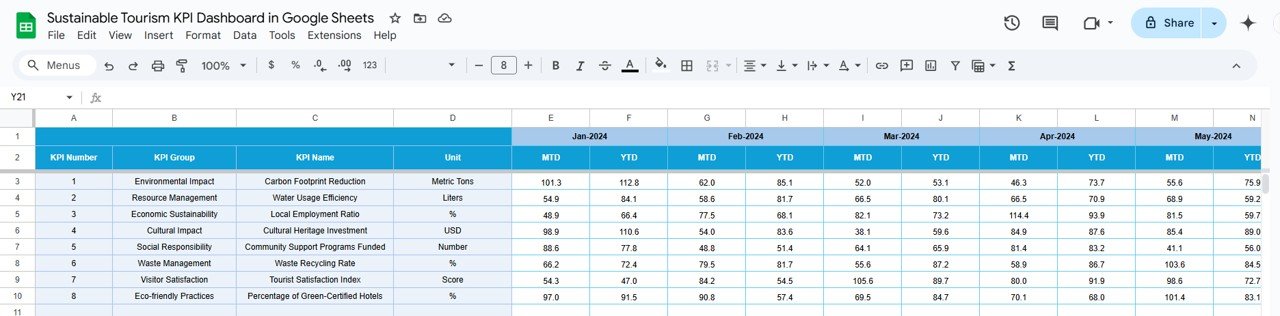
Target Sheet – Input monthly and annual sustainability goals
-
Previous Year Sheet – Enter last year’s data to track progress over time
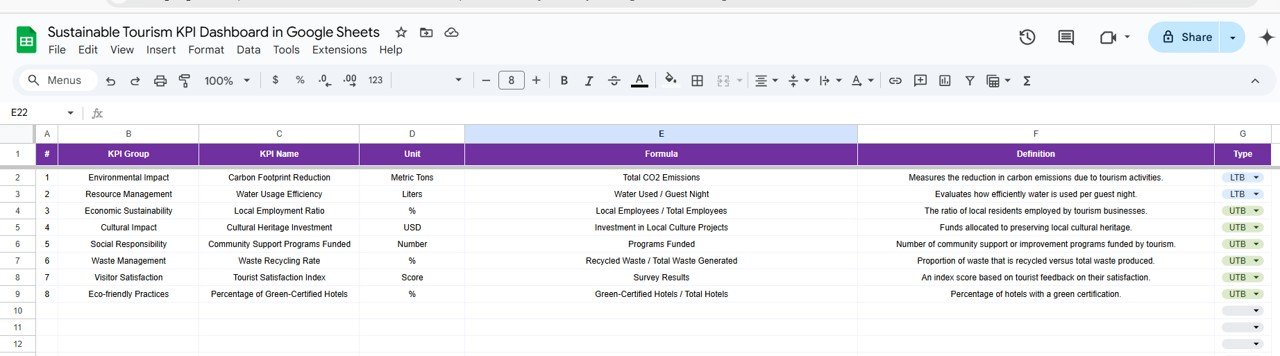
📖 KPI Definition Sheet
-
View definitions, formulas, and measurement units for each KPI
-
Ensures clarity and alignment across your sustainability team
📦 What’s Inside the Sustainable Tourism KPI Dashboard
This Google Sheets template includes six fully integrated tabs:
1️⃣ Dashboard – High-level KPI summary with interactive visuals
2️⃣ KPI Trend – Choose any KPI and visualize monthly performance
3️⃣ Actual Numbers – Fill in monthly and year-to-date actuals
4️⃣ Target Sheet – Enter monthly and yearly goals
5️⃣ Previous Year Numbers – Store and compare past performance
6️⃣ KPI Definitions – Complete glossary of KPI formulas and purposes
Each tab works together to give you real-time insight into your sustainability journey.
🛠️ How to Use the Sustainable Tourism KPI Dashboard
-
📝 Enter Actual Data – Input monthly & YTD numbers into the Actual Numbers tab
-
🎯 Set Targets – Define realistic goals in the Target tab
-
📅 Select Month – Use the dropdown to focus on a specific month
-
📊 View Results – The dashboard automatically calculates and displays comparisons
-
📈 Track KPI Trends – Use the Trend tab to spot performance over time
-
🔄 Compare with Previous Year – Analyze YOY growth in sustainability
Zero coding. Zero setup. 100% impact.
👥 Who Can Benefit from This Dashboard?
🏨 Eco-Friendly Hotels & Resorts – Track water, energy, and waste reduction efforts
🗺️ Sustainable Tour Operators – Monitor community engagement and emissions
🛳️ Cruise Lines & Adventure Companies – Evaluate resource efficiency metrics
🌿 Destination Management Organizations – Oversee multi-location sustainability KPIs
🏕️ Ecotourism & Nature Parks – Track conservation goals and visitor impact
If sustainability matters to your tourism brand—this tool is essential.
💡 Why Choose This Google Sheets Dashboard?
✅ Easy to Use – No learning curve. Plug in your data and go
✅ Fully Editable – Add KPIs, adjust formulas, or change layouts
✅ Live Visuals – Real-time arrows and highlights for instant decisions
✅ Month & Year Comparisons – Spot trends and gaps
✅ No Software Required – Google Sheets = access from anywhere
✅ Professional-Grade Reporting – Export to PDF or present live in meetings
🔁 Click here to read the Detailed blog post
Click here to read the Detailed blog post


Reviews
There are no reviews yet.