In moments of crisis—whether it’s a cyberattack, natural disaster, system failure, or any unexpected disruption—every second counts. But making decisions based on assumptions or outdated information can escalate issues instead of resolving them. That’s why the Crisis Management KPI Dashboard in Google Sheets is a must-have tool for organizations aiming to stay resilient, informed, and data-driven under pressure.
This easy-to-use, visual dashboard tracks all key crisis-related KPIs in real-time—empowering teams to monitor response speed, resolution efficiency, stakeholder communication, and more. It’s built for speed, collaboration, and accuracy—ensuring your team doesn’t just react to a crisis but manages it like pros. ✅
⚙️ Key Features of the Crisis Management KPI Dashboard
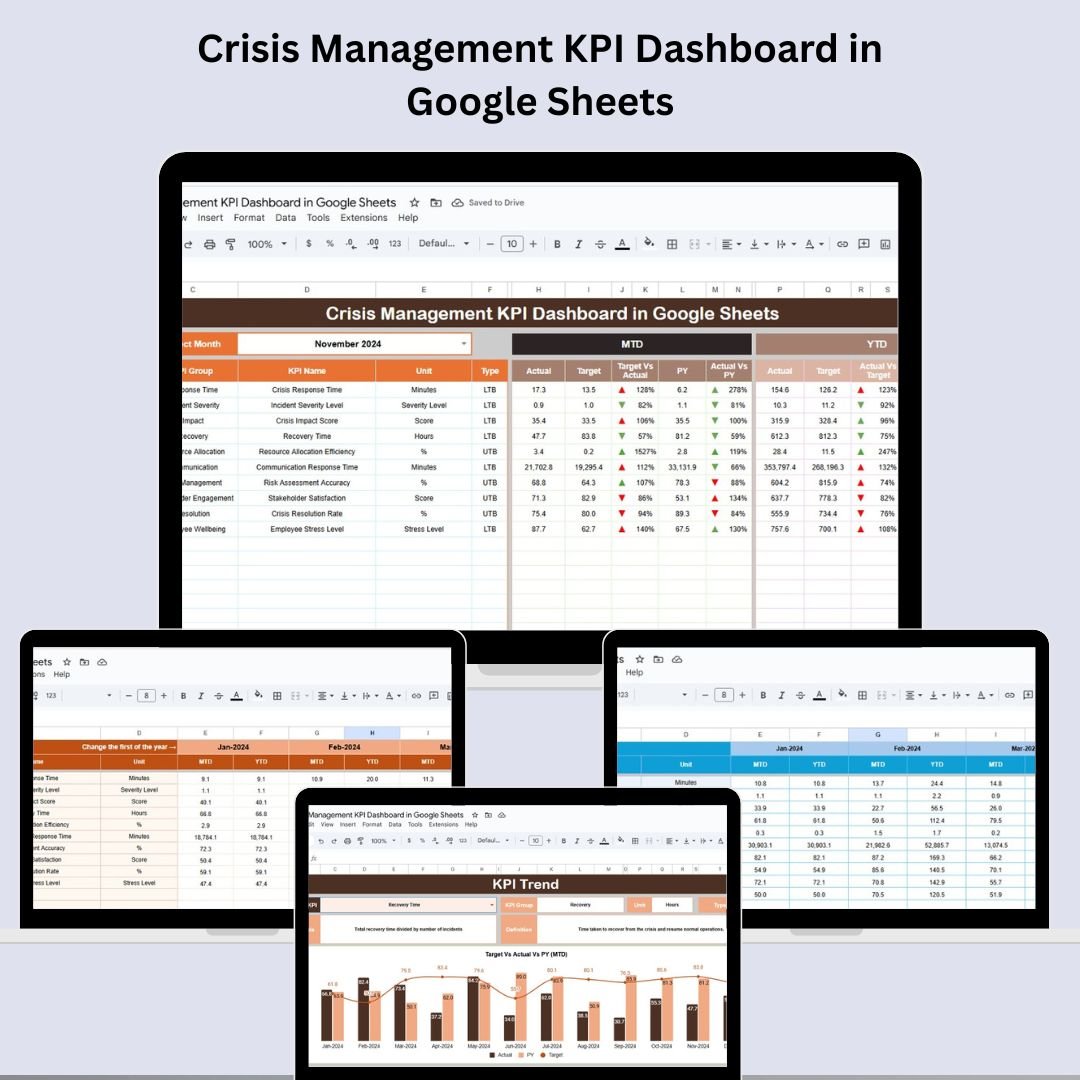
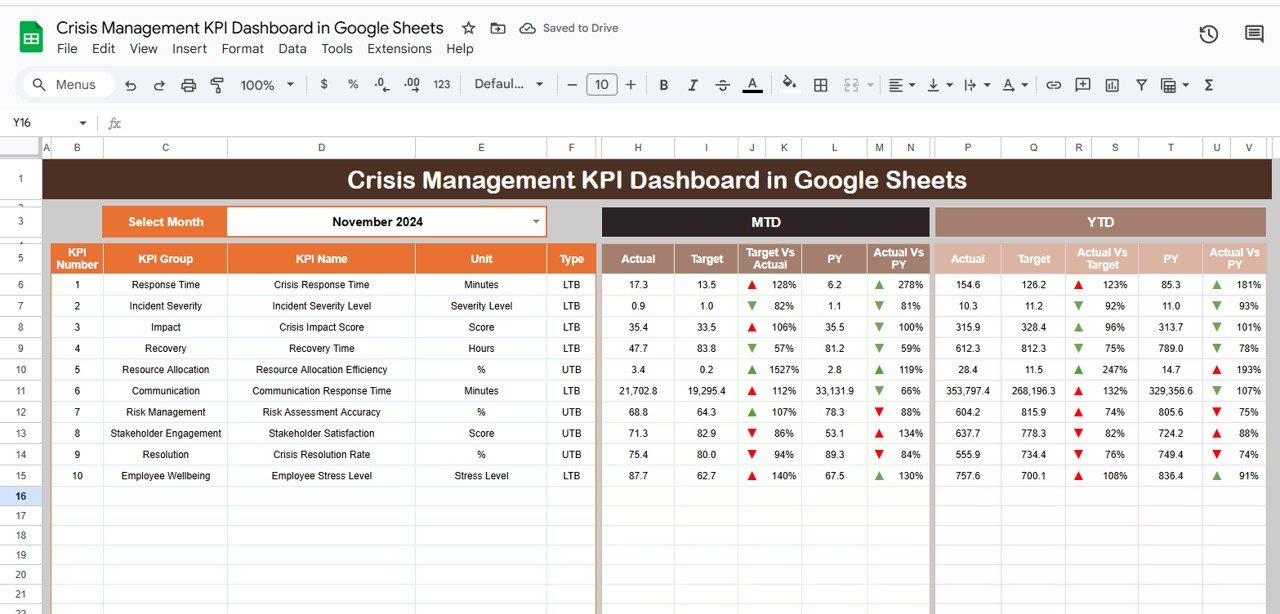
📊 Interactive Dashboard Sheet
Select a Month (cell D3) to auto-update the entire dashboard
Compare Actual vs. Target and Previous Year values
MTD & YTD views with trend arrows (↑↓) for quick assessment
Instantly spot performance dips with conditional formatting
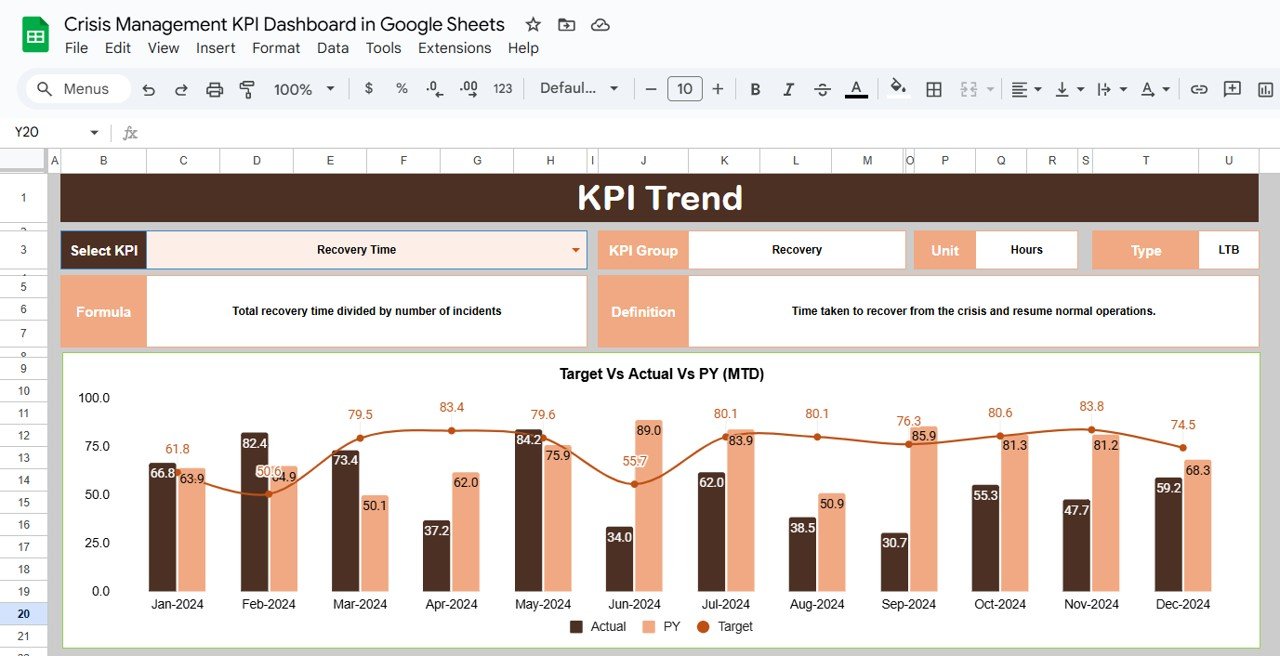
📈 KPI Trend Sheet
Deep dive into any KPI with a single dropdown (cell C3)
View KPI Group, Unit, Formula, and Definition clearly
Know whether a KPI is UTB (Upper the Better) or LTB (Lower the Better)
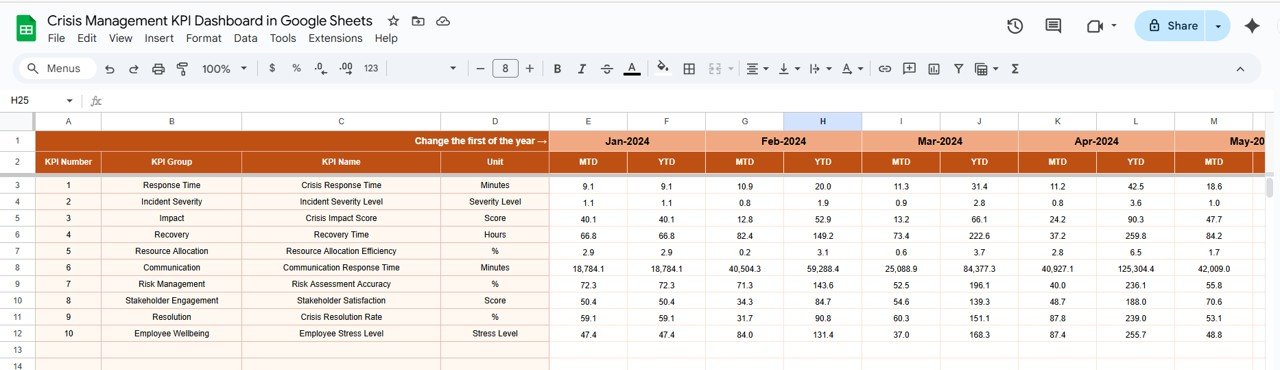
🧮 Actual Numbers Input
Enter MTD and YTD performance metrics easily
Auto-connects to the dashboard’s calculations
Use the Month selection in cell E1 to filter instantly
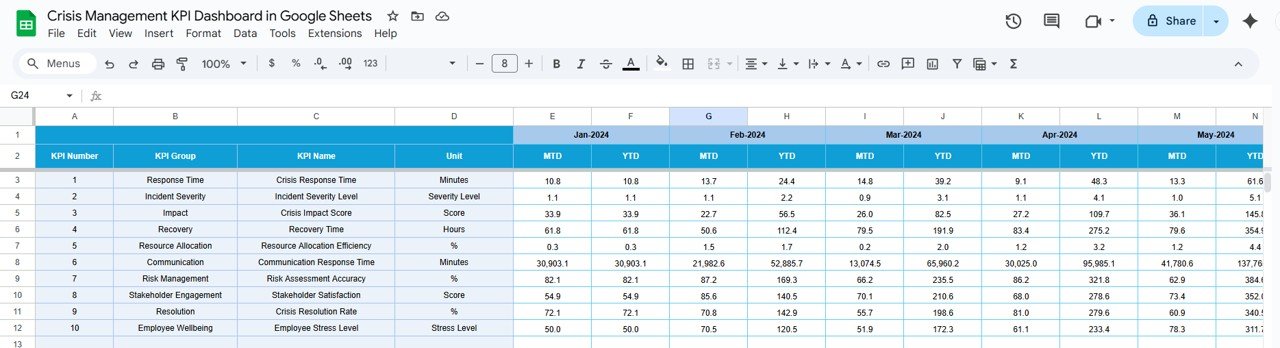
🎯 Target Setting Tab
Define monthly MTD & YTD target values
Align KPIs with internal SLAs or external compliance goals
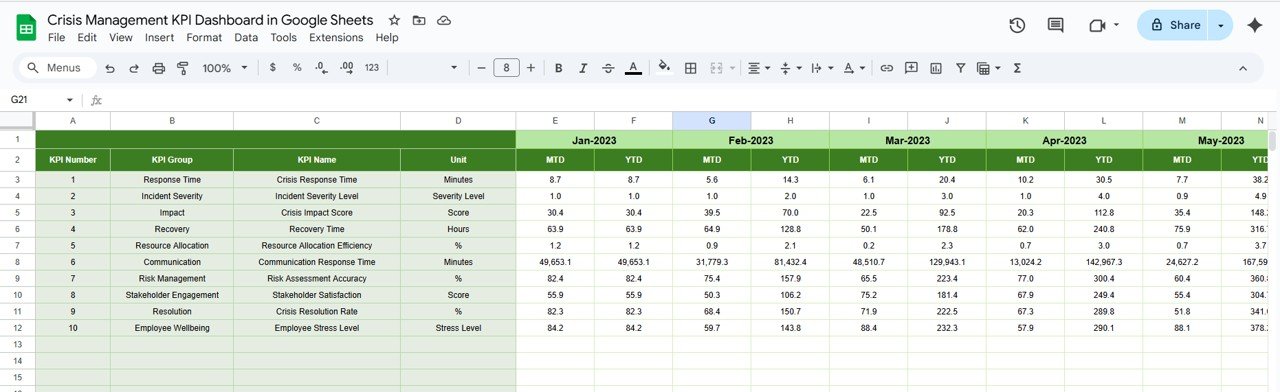
📆 Previous Year Data
Record last year’s KPI performance for seamless YoY comparisons
Enables context-driven strategic reviews
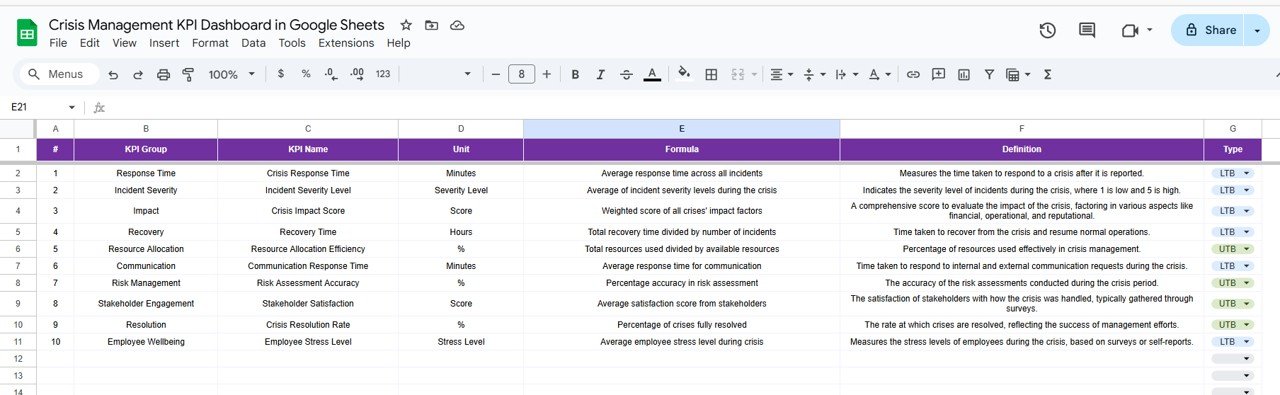
📚 KPI Definition Sheet
Crystal-clear KPI breakdown: Name, Group, Unit, Formula, Definition, Type
Standardizes KPI understanding across teams
📥 What’s Inside the Dashboard?
✅ 6 Prebuilt Tabs to manage every aspect of crisis KPIs
✅ Fully Formula-Driven dashboard — no complex setup needed
✅ 100% Customizable to your organization’s needs
✅ Works across any device with Google Sheets access
✅ Includes space to track over 30+ key KPIs (expandable!)
🛠️ How to Use the Dashboard
Input actual data monthly in the Actual Numbers tab
Set your target values in the Target sheet
Add past performance in the Previous Year Numbers tab
Use the Dashboard tab to monitor trends and take action
Regularly review the KPI Trend Sheet for progress analysis
Share the dashboard in meetings or audits using Google Sheets’ collaboration features
👥 Who Can Benefit from This Dashboard?
🎯 Crisis Response Teams – Stay on top of every emergency metric
📊 Risk Managers – Track impact, speed, and accountability
🧑💼 Executives & Stakeholders – Visualize crisis performance at a glance
🔐 IT Teams – Monitor breach response and detection time
🏥 Healthcare Admins – Prepare for patient surges or compliance incidents
🏢 Operations Teams – Reduce downtime and service disruption risks
🔍 Click here to read the Detailed blog post
Watch the step-by-step video Demo: