

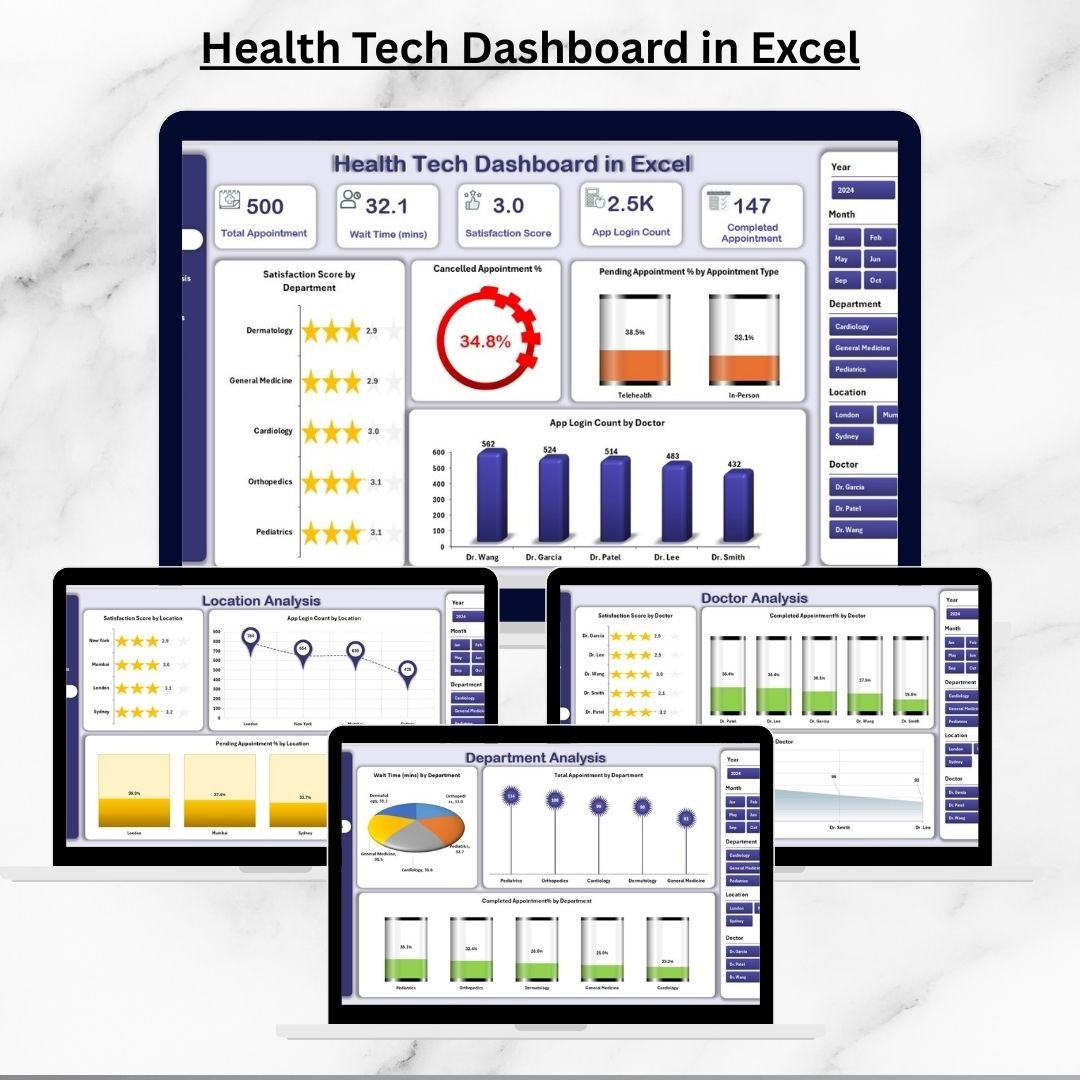

Healthcare organizations today handle massive volumes of data—from appointments and cancellations to patient satisfaction, doctor performance, and even digital adoption metrics. Managing this manually is time-consuming and error-prone. That’s why we designed the Health Tech Dashboard in Excel, a ready-to-use, interactive reporting solution that transforms raw data into actionable insights.
Instead of juggling scattered spreadsheets, this dashboard centralizes healthcare performance into one intuitive platform. Whether you’re a hospital administrator, a clinic manager, or part of a healthcare IT team, you can monitor appointments, identify bottlenecks, and improve patient outcomes—all within Excel.
✨ Key Features of Health Tech Dashboard in Excel
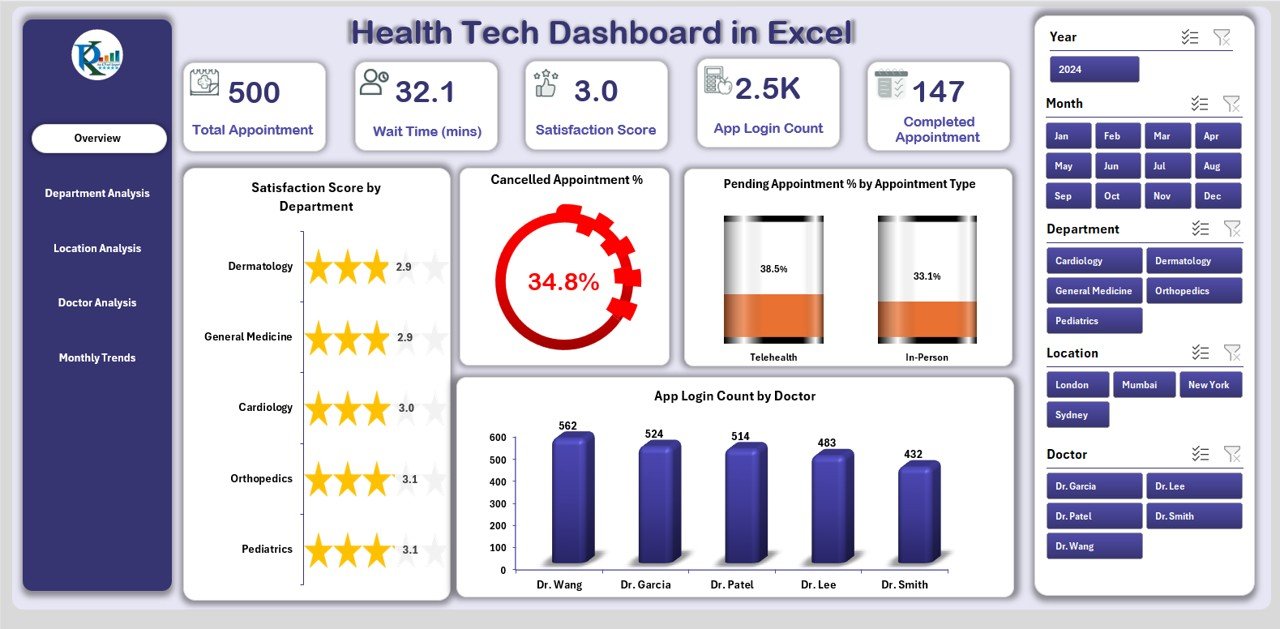
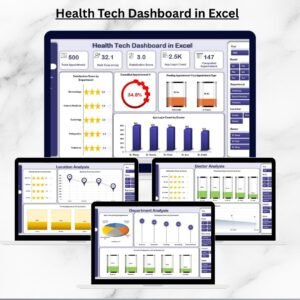
📊 5 Analytical Pages – Overview, Department, Location, Doctor, and Monthly Trends.
🎯 KPI Cards – Track total appointments, cancellations, pending %, satisfaction score, and logins.
⚡ Dynamic Charts – Visualize performance by department, doctor, and location.
🗂 Support Sheet – Easy backend data entry for automatic updates.
🚦 Interactive Slicers – Filter results by department, doctor, or time period instantly.
🛠 Customizable – Add KPIs like patient wait times or new digital metrics.
💰 Cost-Effective – Built in Excel, no pricey healthcare analytics software needed.
📂 What’s Inside the Dashboard
Overview Page – Central hub with 5 KPI cards and 4 charts covering satisfaction, cancellations, pending %, and digital adoption.
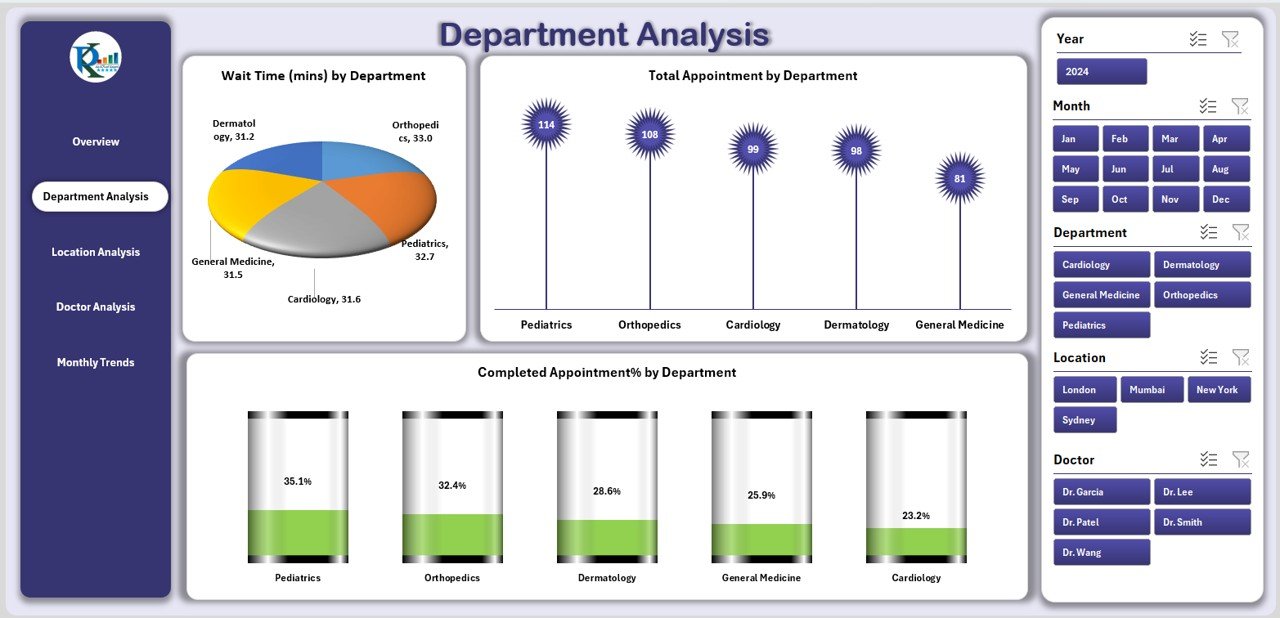
Department Analysis – Compare wait times, appointment counts, and completion rates across departments.
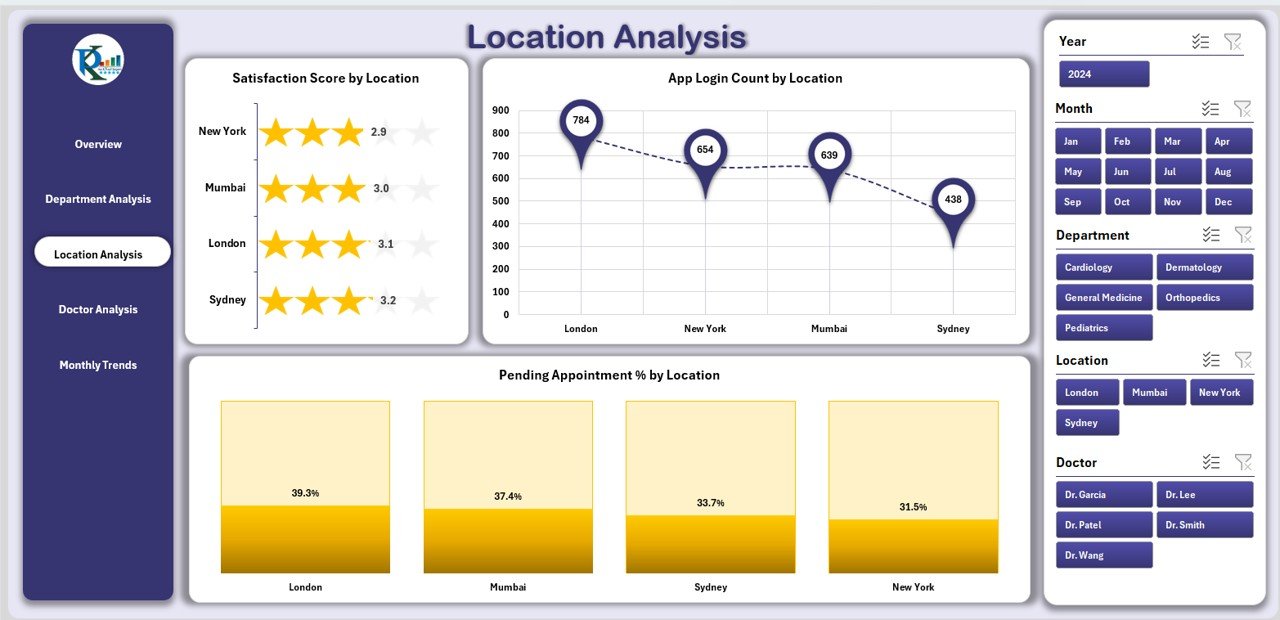
Location Analysis – Evaluate satisfaction, app usage, and pending % across hospitals or clinics.
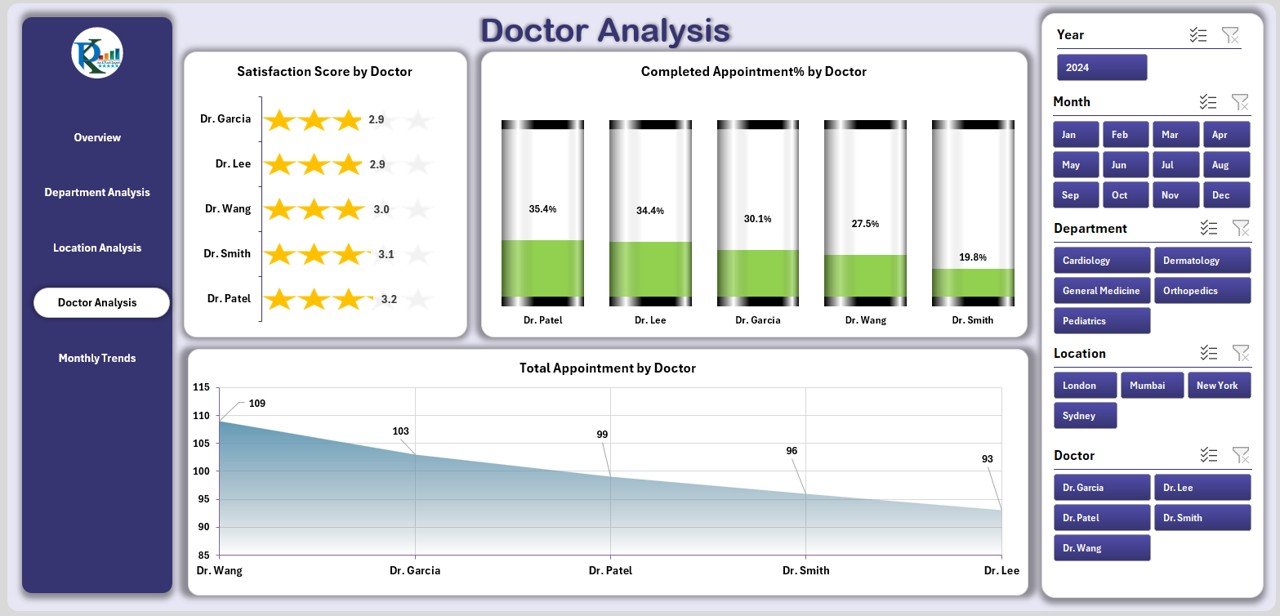
Doctor Analysis – Track satisfaction scores, total appointments, and completion % for each doctor.
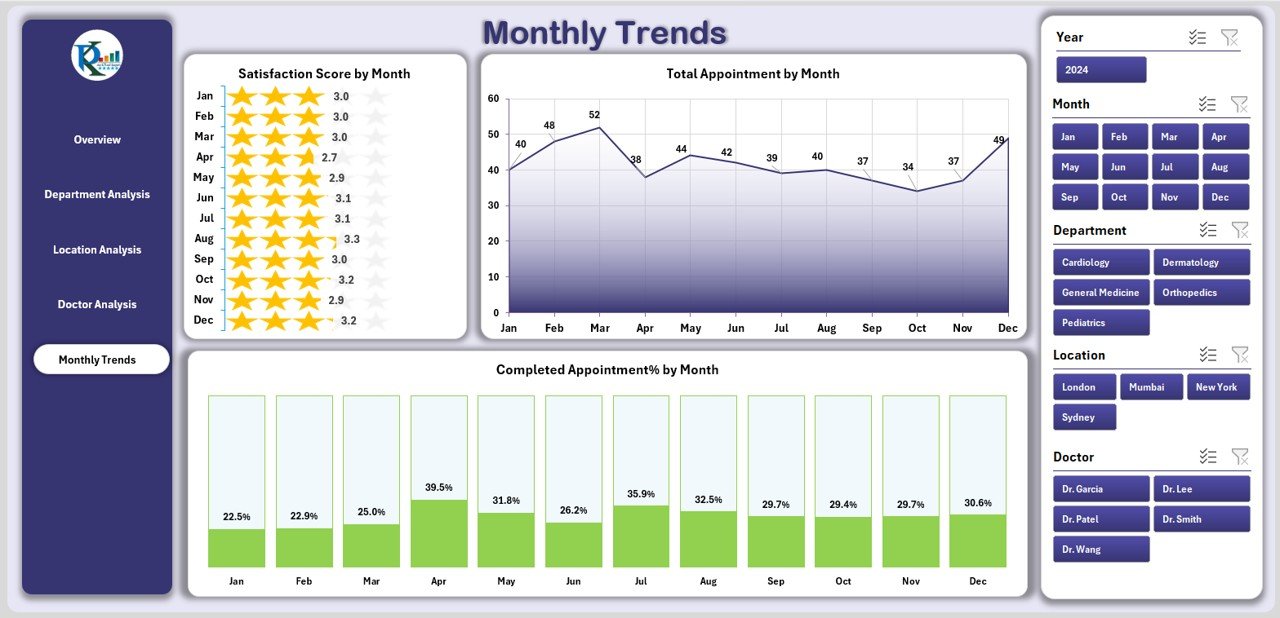
Monthly Trends – Monitor satisfaction scores, appointment counts, and completion rates month by month.
Support Sheet – Enter appointment details, doctor info, and patient feedback in a structured way.
📖 How to Use the Health Tech Dashboard
Enter Data – Add raw data (appointments, feedback, doctors, etc.) in the Support Sheet.
Navigate Pages – Use the left-side Page Navigator to switch views.
Filter Insights – Apply slicers to focus on specific departments, doctors, or months.
Analyze Trends – Check KPIs and trend charts to identify bottlenecks or success areas.
Take Action – Use insights to reduce cancellations, shorten wait times, and improve satisfaction.
👥 Who Can Benefit from This Dashboard?
🏥 Hospitals – Track department-level efficiency and doctor performance.
🩺 Clinics – Improve patient satisfaction and reduce appointment delays.
🚀 Health Startups – Monitor digital adoption and app usage trends.
🧑⚕️ Doctors & Managers – Compare performance across individuals and locations.
🏛 Healthcare Administrators – Gain high-level oversight for strategic decisions.
This dashboard ensures that patient care and operational efficiency remain measurable, trackable, and improvable.
✅ Click here to read the Detailed blog post
Visit our YouTube channel to learn step-by-step video tutorials
Watch the step-by-step video tutorial:
Compatibility and Requirements
- Works in Microsoft Excel desktop (Excel 2016 or later, or Microsoft 365).
- Slicers filter the pages by department, doctor and time period. Microsoft’s guide to using slicers to filter data explains how they work.
Frequently Asked Questions
How many pages does the Health Tech Dashboard have?
Five analysis pages (Overview, Department, Location, Doctor and Monthly Trends) plus a Support Sheet where you enter the data. A Page Navigator on the left switches between them.
Which KPI cards are on the Overview page?
Total appointments, cancellations, pending %, satisfaction score and logins. The page also has 4 charts covering satisfaction, cancellations, pending % and digital adoption.
Where do I enter appointment data?
On the Support Sheet. Add appointment details, doctor information and patient feedback there, and the five pages update from it.
Can I compare doctors and locations?
Yes. The Doctor Analysis page shows satisfaction scores, total appointments and completion % for each doctor, and the Location Analysis page compares satisfaction, app usage and pending % across hospitals or clinics.
Related Healthcare Templates
- Health Tech Dashboard in Power BI: the same topic in Power BI.
- Health Tech Dashboard Report in Excel: a report version for health tech data.
- Healthcare Dashboard in Excel: wider healthcare operations in Excel.
- Healthcare Dashboard in Google Sheets: for teams that work in Google Sheets.
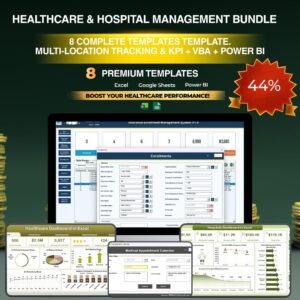
- Healthcare & Hospital Management Bundle: 8 healthcare templates in one pack.
Browse all Excel dashboards or the Excel health and safety templates.























Reviews
There are no reviews yet.