
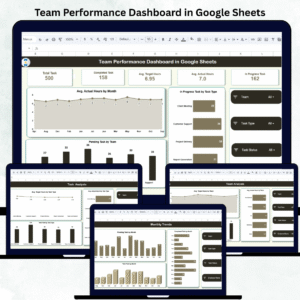
📊 Healthcare Dashboard in Google Sheets – Your All-in-One Visual Tool for Patient & Revenue Insights!
Managing a healthcare facility requires continuous tracking of complex data: patient volume, treatment progress, revenue trends, and satisfaction scores. The Healthcare Dashboard in Google Sheets is a ready-to-use and fully customizable template built to help healthcare professionals and administrators simplify these essential tasks. With a beautifully designed dashboard featuring insightful charts, performance cards, and smart slicers, this tool offers everything you need to make data-driven decisions and deliver better patient care.

🧩 Key Features of the Dashboard:
📍 Dashboard Sheet Tab
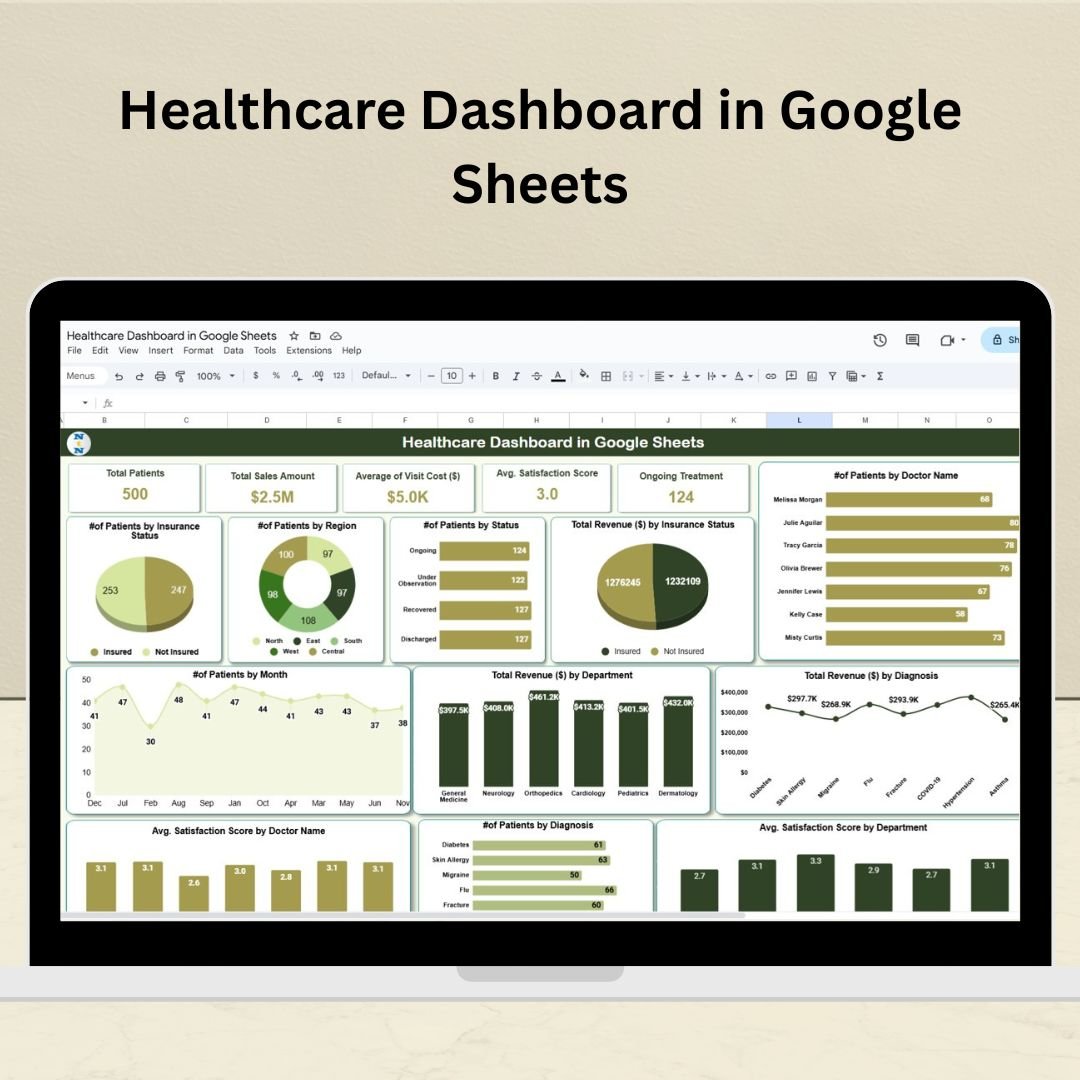
This is the main visual hub that includes KPI cards and dynamic charts for real-time decision-making.
✅ KPI Cards Include:
- 🧍♂️ Total Patients
- 💰 Total Sales Amount
- 💸 Average Visit Cost ($)
- ⭐ Avg. Satisfaction Score
- 🩺 Ongoing Treatment Cases
📈 Charts Provide Insight On:
of Patients by Doctor Name 🧑⚕️
- Patients by Insurance Status 💳
- Patients by Region 🗺️
- Revenue by Department 💼
- Avg. Satisfaction by Doctor and Department 🩻
- Monthly Trends and Diagnoses 📆
📊 Data-Driven Metrics at Your Fingertips!
📍 Data Sheet Tab
The source of truth for all your visualizations! Enter raw patient data, visit logs, financials, and satisfaction scores in one place. As you update, the dashboard refreshes automatically—no need for manual adjustments!
💡 Advantages of Using This Dashboard:
📌 Real-Time Monitoring – Track performance KPIs instantly with updated data inputs.
📌 Customizable Layout – Modify KPIs, adjust layouts, and fine-tune visualizations to meet specific hospital or clinic needs.
📌 Centralized Information – Manage everything in one place and avoid scattered spreadsheets.
📌 Visual Storytelling – Beautiful charts and cards help tell the story of your healthcare facility’s performance.
📌 Improved Team Communication – Share the dashboard with staff to keep everyone aligned on goals.
✅ Best Practices for Maximum Impact:
📅 Update the Data Sheet Tab regularly to keep insights fresh.
🔍 Use slicers for quick breakdowns by doctor, department, or diagnosis.
🎯 Set performance goals using KPI benchmarks.
👥 Share insights during team meetings to encourage accountability and collaboration.
Whether you’re overseeing a private practice, a specialty clinic, or a large healthcare institution, this dashboard will help you stay on top of critical metrics and elevate the quality of your services.
🔗 Watch the step-by-step video tutorial on our YouTube channel:
youtube.com/@NeotechNavigators


Reviews
There are no reviews yet.