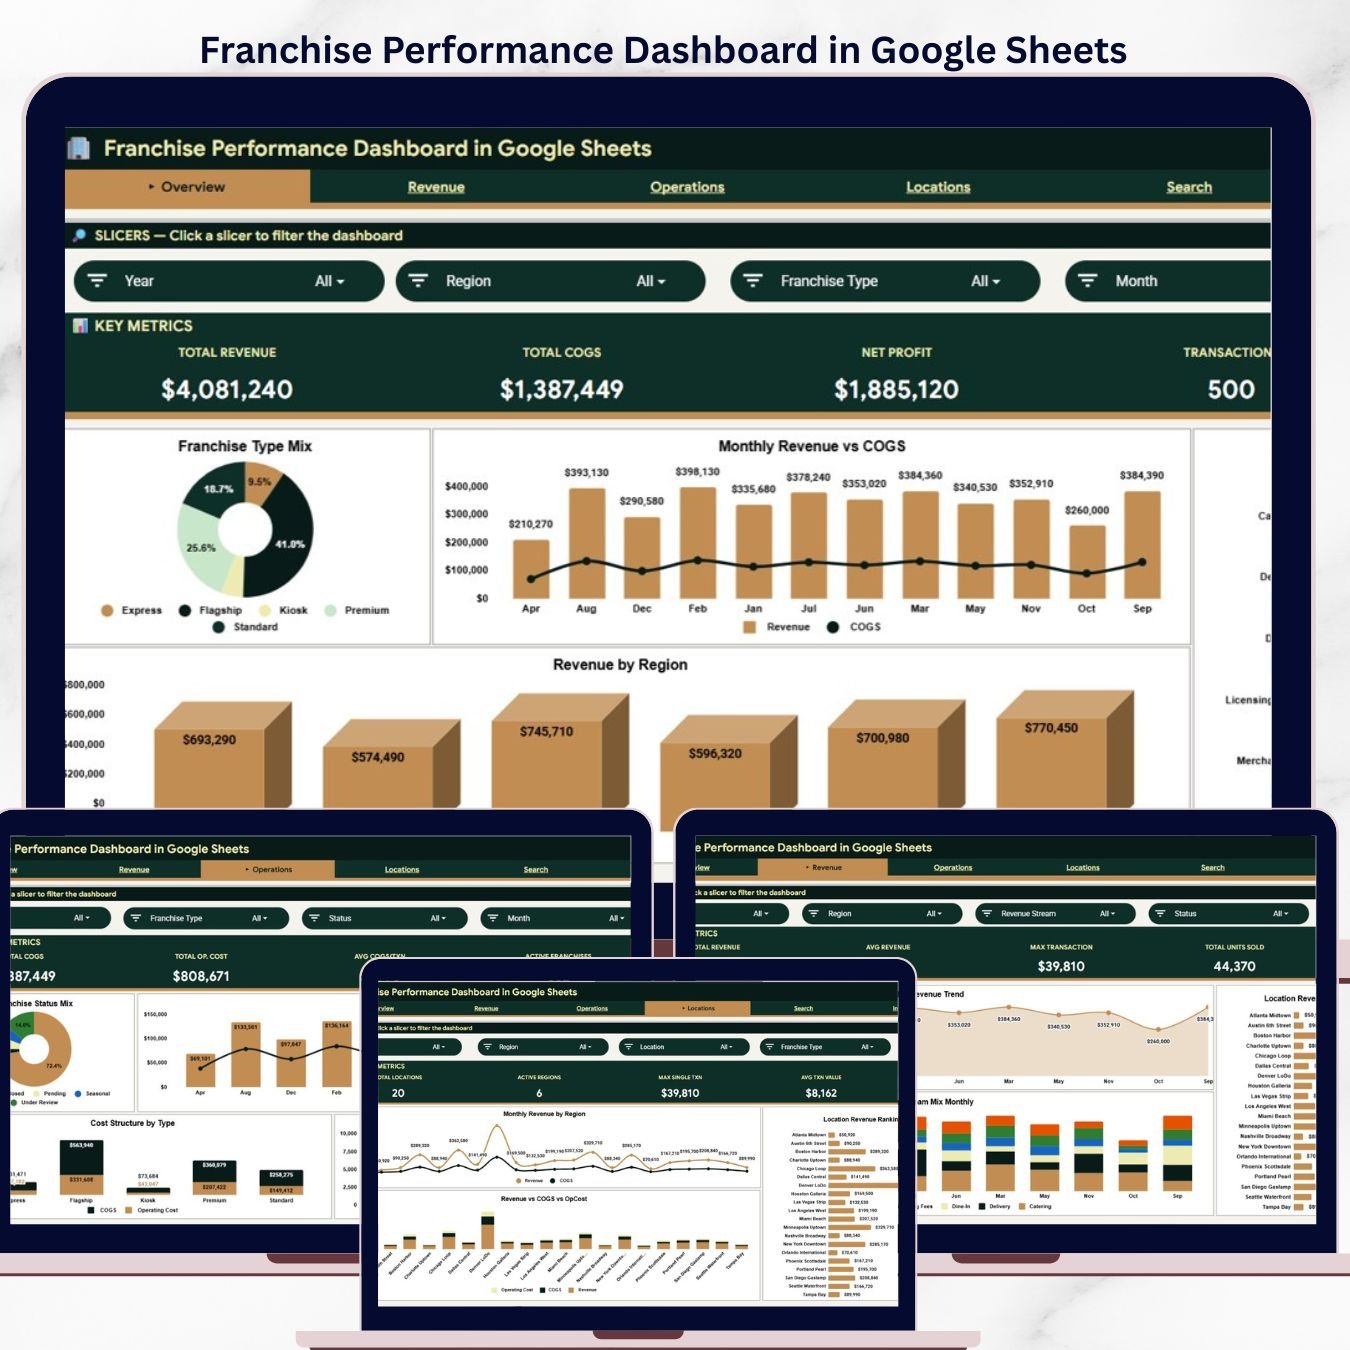


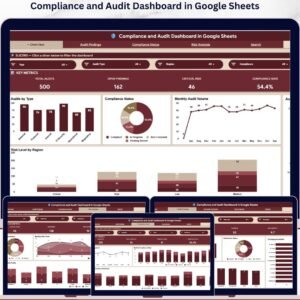
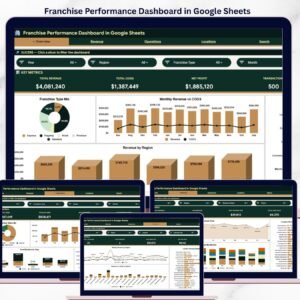
The Franchise Performance Dashboard in Google Sheets tracks 4 KPIs across 5 interactive pages, with 12+ pre-built charts and slicer-driven filters covering Franchise Type, Region, Location, and Revenue Stream. Setup takes under 10 minutes — just paste your franchise transaction data into the Data sheet and every chart, KPI card, and analysis page updates automatically.
🌍 Join 8,400+ teams in 40+ countries using NextGenTemplates to replace paid SaaS tools with one-time-purchase Excel, Google Sheets, Power BI, and HTML templates.
✅ Instant download · One-time payment · No subscription · No per-user fees · Lifetime access
🔑 Key Features of Franchise Performance Dashboard in Google Sheets
📊 4 KPI Cards on the Overview Page — Total Revenue, Total COGS, Net Profit, and Transactions give you a single-screen snapshot of your franchise network’s financial health. Every card responds to slicer selections so you can isolate a single region, franchise type, or revenue stream in under 5 seconds.
📈 12+ Pre-Built Charts Across 5 Analysis Pages — The dashboard includes Franchise Mix by Type, Revenue and COGS by Month, Revenue by Revenue Stream, Revenue by Region, Revenue by Month, Revenue by Revenue Stream and Month, Revenue by Location, Franchise Mix by Status, COGS and Operating Cost by Month, Cost by Franchise Type, Units Sold by Region, Revenue and COGS by Region and Month, and Revenue COGS and Operating Cost by Location.
🔍 Slicer Filters for Instant Analysis — Multiple slicers let you filter the dashboard by Franchise Type, Region, Location, Revenue Stream, and Status. The entire dashboard responds to your filter selections, making ad-hoc analysis effortless.
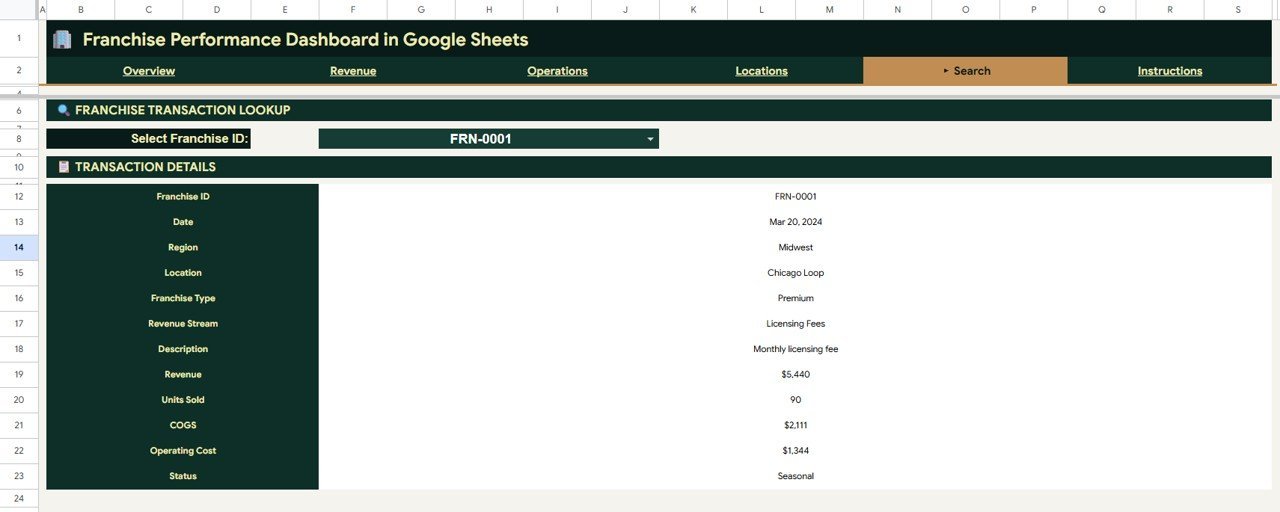
🔎 Franchise Transaction Lookup — Select any Franchise ID from the dropdown on the Search Sheet to instantly display the full transaction details including Date, Region, Location, Franchise Type, Revenue Stream, Description, Revenue, Units Sold, COGS, Operating Cost, and Status. No scrolling through raw data required.
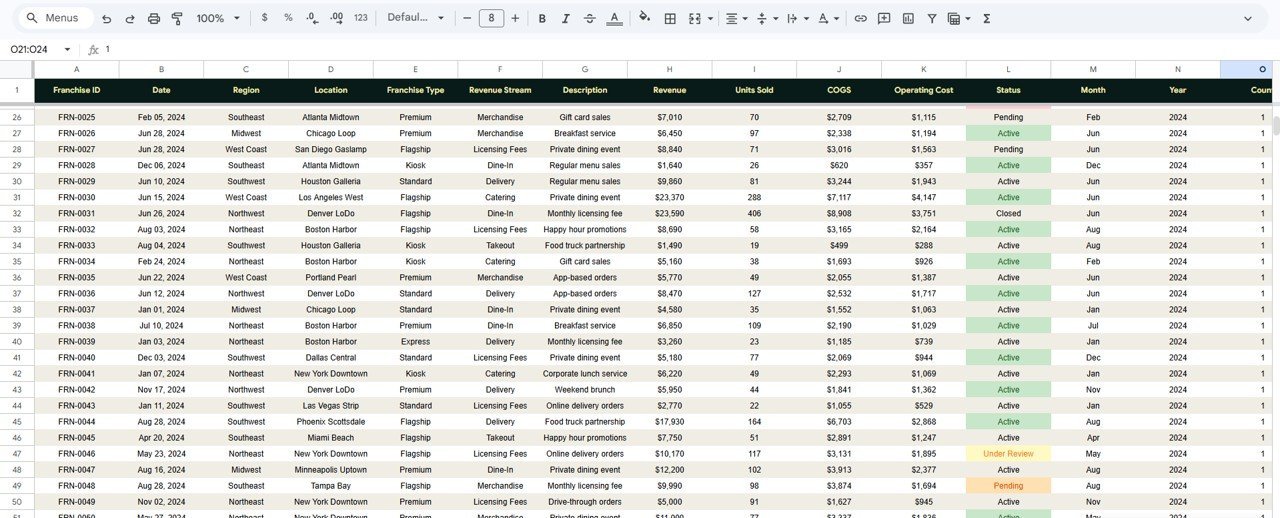
📋 Structured Data Sheet — A clean, organized data sheet where you paste your franchise records in the exact format. Every dashboard page reads from this single source of truth, so updates happen everywhere at once.
🛠️ Zero Technical Setup — Built entirely on native Google Sheets formulas and pivot tables. No macros, no Apps Script triggers, no add-ons. Works in any free Google account, on desktop or mobile.
📦 What’s Inside the Franchise Performance Dashboard in Google Sheets
📌 Overview Page — The top-level summary features 4 KPI cards (Total Revenue, Total COGS, Net Profit, Transactions) plus charts covering Franchise Mix by Type, Revenue and COGS by Month, Revenue by Revenue Stream, and Revenue by Region. Slicer filters sit at the top for quick drill-downs.
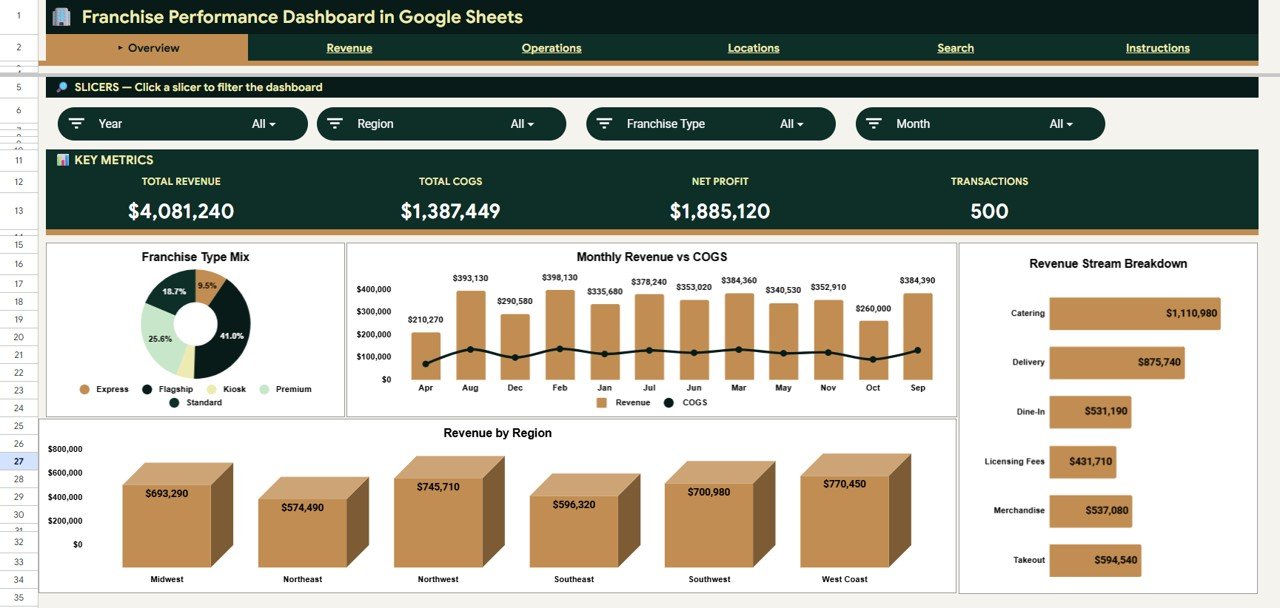
Franchise Performance Dashboard in Google Sheets
📌 Revenue Page — Dives into revenue trends with Revenue by Month, Revenue by Revenue Stream and Month, and Revenue by Location. Helps identify which months and streams drive the most income across your franchise network.
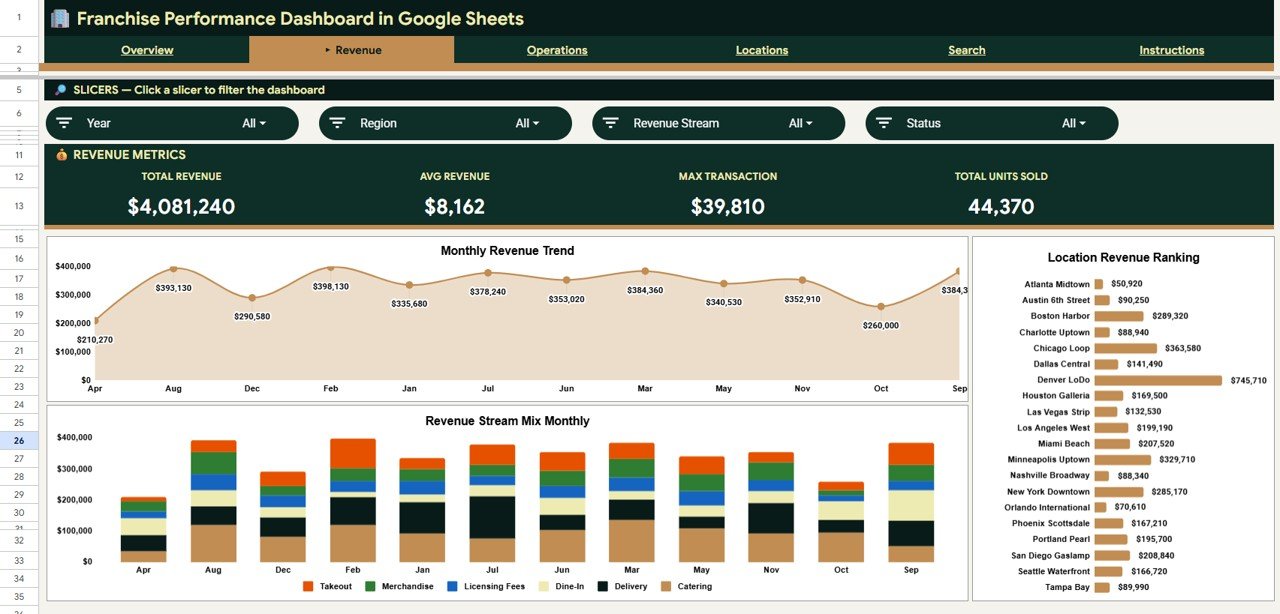
Revenue Page
📌 Operations Page — Analyzes cost structure with Franchise Mix by Status, COGS and Operating Cost by Month, Cost by Franchise Type, and Units Sold by Region. This page answers where costs are concentrated and which franchise types have the widest margins.
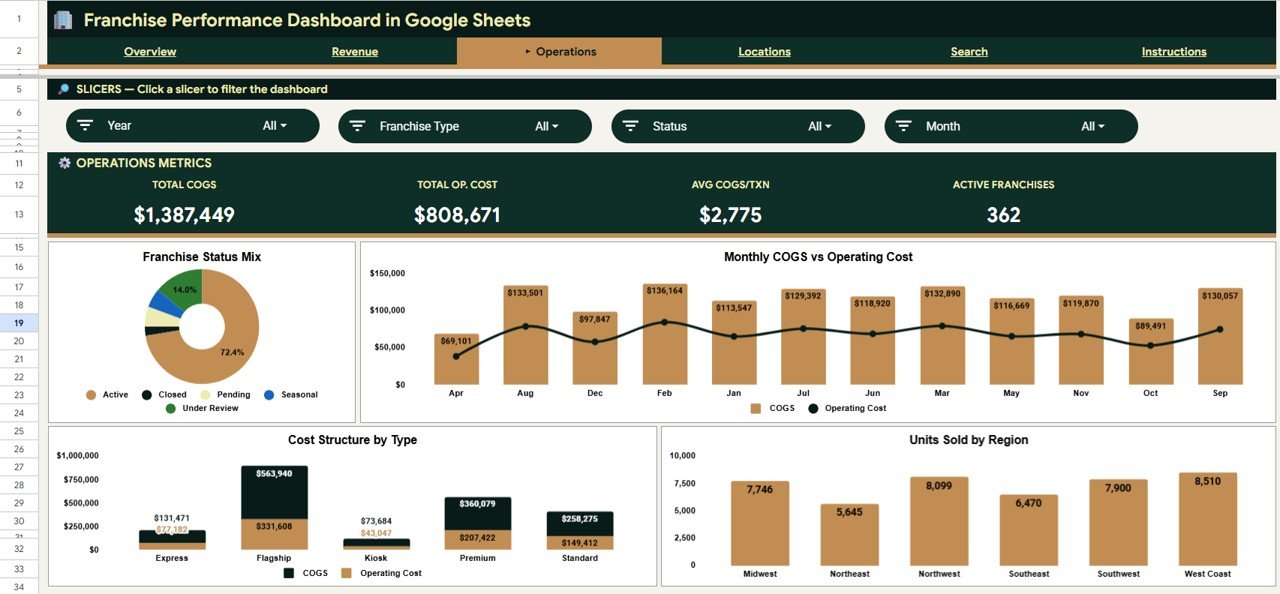
Operations Page
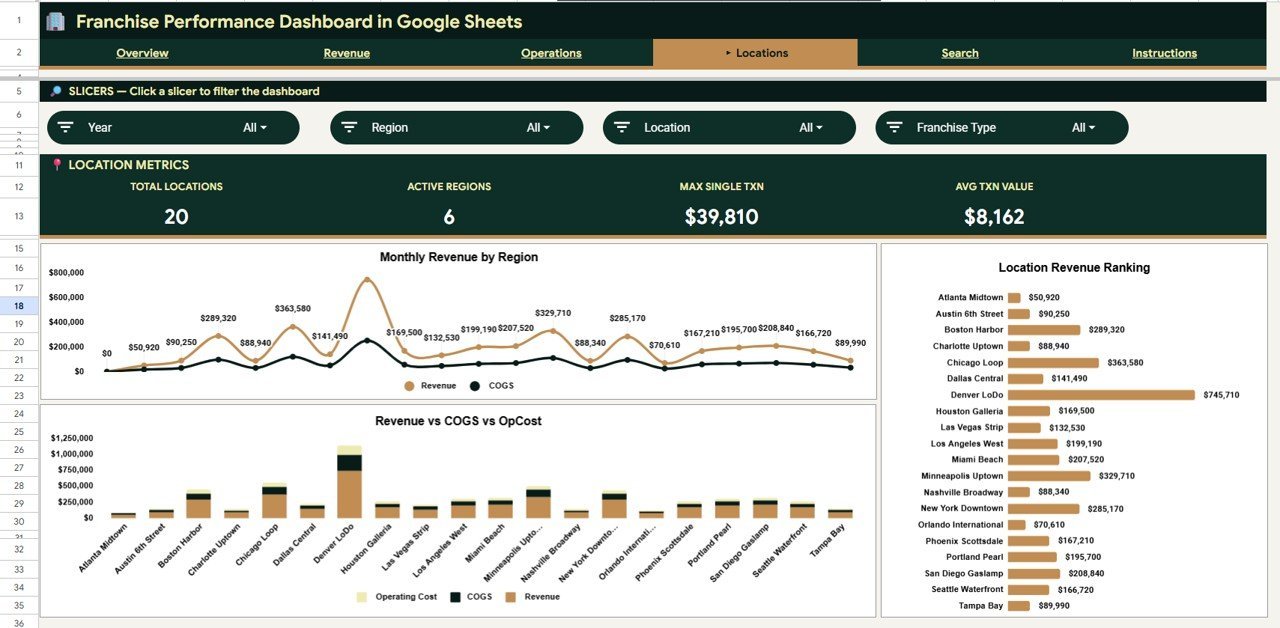
📌 Locations Page — Regional and location-level analysis with Revenue and COGS by Region and Month, Revenue COGS and Operating Cost by Location, and Revenue by Location. Built for multi-location franchise operators comparing branches.

Locations Page
📌 Search Sheet — Select a Franchise ID from the dropdown and the complete transaction record appears instantly: Date, Region, Location, Franchise Type, Revenue Stream, Description, Revenue, Units Sold, COGS, Operating Cost, and Status.
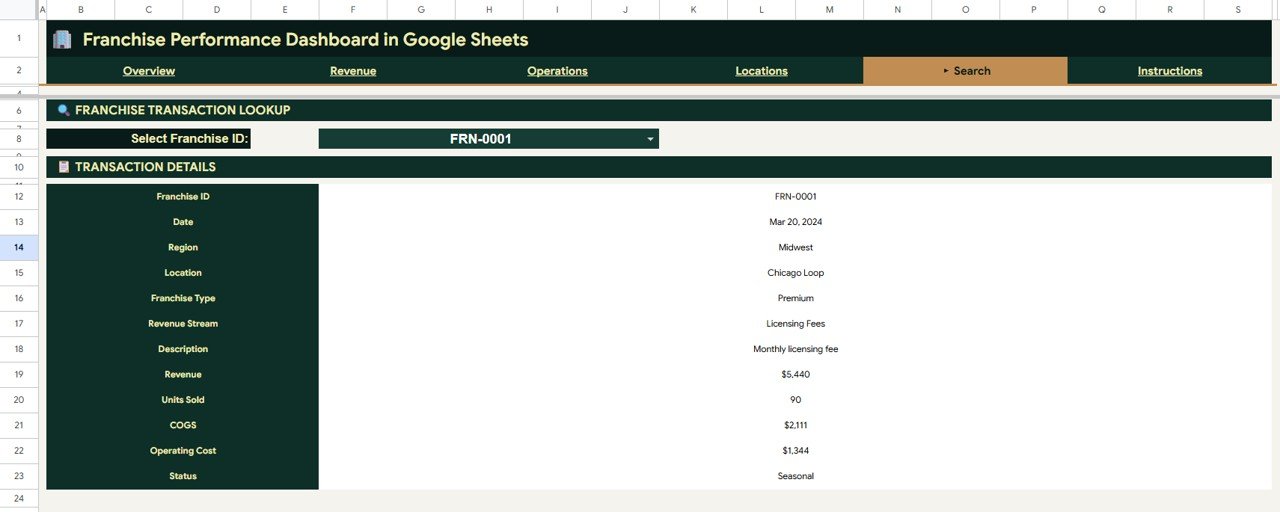
Search Sheet tab
📌 Data Sheet — This is where you add your franchise data. Simply paste your records in the same column format and every dashboard page refreshes automatically.
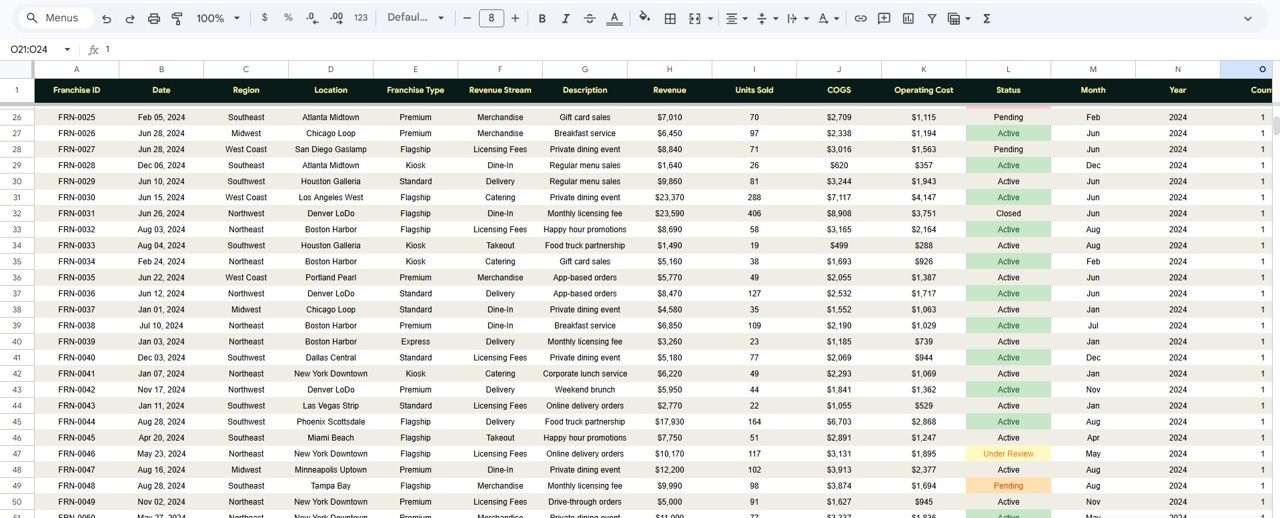
Data Sheet tab
📊 Franchise Performance Dashboard in Google Sheets vs. Microsoft Excel Dashboard vs. FranConnect — Where This Fits
| Feature | Franchise Performance Dashboard in Google Sheets | Excel Franchise Dashboard | FranConnect / Naranga / FranchiseSoft |
|---|---|---|---|
| Cost | $9.99 one-time | $17.99 one-time | $200–$1,500/month |
| Platform | Google Sheets (free account) | Microsoft Excel (license needed) | Cloud SaaS |
| Setup Time | Under 10 minutes | Under 10 minutes | 4–12 weeks onboarding |
| Real-Time Collaboration | ✅ Built-in (Google Sheets) | ❌ Requires OneDrive | ✅ Yes |
| Mobile Access | ✅ Google Sheets app | Limited on mobile | ✅ Dedicated app |
| Customizable Fields | ✅ Fully editable | ✅ Fully editable | Limited to plan tier |
| Franchise ID Lookup | ✅ Dropdown search | ✅ VBA or manual | ✅ Built-in CRM |
| Year-1 Cost (5 Users) | $9.99 total | $17.99 + Excel licenses | $2,400–$18,000 |
| Revenue Stream Analysis | ✅ Included | ✅ Included | Depends on plan |
For franchise owners who want multi-location revenue and cost tracking without paying $200+/month for FranConnect, the Franchise Performance Dashboard in Google Sheets sits in the sweet spot.
👥 Who This Template Is For — and Who It’s Not For
✅ This template is built for:
- Franchise owners and operators managing 2–50 locations across multiple regions
- Restaurant franchise managers tracking revenue by stream (Dine-in, Takeaway, Delivery, Catering)
- Multi-unit retail franchise operators comparing COGS and operating costs across branches
- Franchise consultants who need a client-ready reporting template for franchise performance reviews
❌ This template is NOT for:
- Enterprise franchises with 100+ locations needing automated POS integration and real-time syncing
- Franchise networks requiring built-in royalty calculation, compliance tracking, or franchisee portals
- Teams needing HIPAA-compliant or SOC 2-certified data storage
⚙️ How to Use the Franchise Performance Dashboard in Google Sheets
1️⃣ Download the PDF guide from your purchase confirmation and click the Google Sheets copy link inside it.
2️⃣ Open the Data Sheet tab and replace the sample data with your franchise’s transaction records — dates, regions, locations, franchise types, revenue, COGS, operating costs, and status.Franchise Performance Dashboard in Google Sheets
3️⃣ Navigate to the Overview page to see all 4 KPI cards and summary charts update automatically.Franchise Performance Dashboard in Google Sheets
4️⃣ Use the slicer filters at the top of each page to drill into specific franchise types, regions, or revenue streams.
5️⃣ Explore the Revenue, Operations, and Locations pages for detailed analysis on income trends, cost structure, and branch-level performance.Franchise Performance Dashboard in Google Sheets
6️⃣ Use the Search Sheet to look up individual franchise transactions by selecting any Franchise ID from the dropdown.
💼 Real-World Use Cases
Raj manages a 12-location fast-food franchise in Maharashtra. He uses the Franchise Performance Dashboard in Google Sheets every Monday to compare revenue by location, identify which branches have the highest COGS-to-revenue ratio, and present monthly performance to investors — without paying ₹15,000+/month for FranConnect.
Sarah operates a 6-unit coffee franchise across Texas. She tracks Revenue by Revenue Stream to see which locations generate more from takeaway versus dine-in, helping her decide where to invest in drive-through upgrades. The slicer filters let her compare Q1 vs Q2 by region in two clicks.Franchise Performance Dashboard in Google Sheets
Carlos is a franchise consultant working with 4 QSR brands. He uses the same Google Sheets template across all clients — each gets a copy with their own data. The Restaurant P&L Dashboard in Google Sheets complements this template for deeper profit-and-loss analysis.Franchise Performance Dashboard in Google Sheets
❓ Frequently Asked Questions
What KPIs does the Franchise Performance Dashboard in Google Sheets track?
The Franchise Performance Dashboard in Google Sheets tracks 4 KPIs on the Overview page — Total Revenue, Total COGS, Net Profit, and Transactions — plus 12+ supporting charts across Revenue, Operations, Locations, and a Search Sheet. All metrics update automatically when you replace sample data.
Can I use this template with a free Google account?
Yes. The Franchise Performance Dashboard in Google Sheets runs entirely on native Google Sheets formulas and pivot tables. No paid Google Workspace plan, add-ons, or macros are required.
How does this compare to FranConnect or franchise management software?
FranConnect starts at $200/month per location. This dashboard costs $9.99 once. It lacks automated POS integration and franchisee portals but delivers the same multi-location revenue and cost analytics that most small-to-mid franchise operators need.
How many franchise locations can this dashboard handle?
Google Sheets supports up to 10 million cells. The Franchise Performance Dashboard handles 50–100 locations with thousands of transaction records smoothly. For larger datasets, consider the Google Sheets Dashboard collection for alternatives.Franchise Performance Dashboard in Google Sheets
Can I customize the charts and add my own metrics?
Yes. Every chart, KPI formula, and slicer is fully editable. You can add new columns to the Data sheet, create additional pivot tables, and build extra charts using standard Google Sheets features.Franchise Performance Dashboard in Google Sheets
How long does setup take?
Under 10 minutes. Open the Google Sheets copy link, paste your data into the Data Sheet, and every dashboard page, chart, and KPI card refreshes automatically. No formulas to edit.Franchise Performance Dashboard in Google Sheets
Is this template available in Excel or Power BI?
Yes. NextGenTemplates offers franchise dashboards in Excel and Power BI formats as well.
👤 About the Author
Built by PK — Microsoft Certified Professional with 15+ years of Excel, Google Sheets, and Power BI experience. Founder of NextGenTemplates, reaching 300K+ subscribers across YouTube channels (@PK-AnExcelExpert, @NextGenTemplates, @NeoTechNavigators). Every template is hand-built and tested before release.
🔗 Explore Related Templates
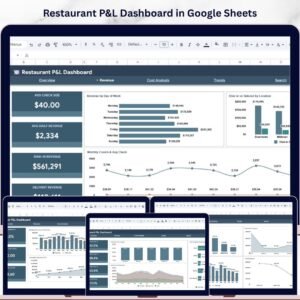
📌 Restaurant P&L Dashboard in Google Sheets — Deeper profit-and-loss analysis for restaurant franchise operations.
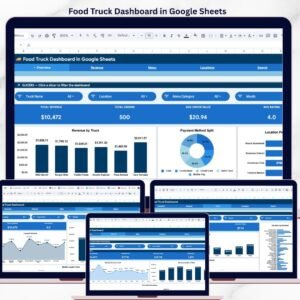
📌 Food Truck Dashboard in Google Sheets — Mobile food business analytics with revenue and cost tracking.
📌 Food and Beverage Dashboard in Google Sheets — F&B operations tracking across menu items and outlets.
🔍 Browse all Google Sheets Dashboard Templates
📖 Click here to read the Detailed Blog Post
Watch the step-by-step video tutorial:
🎥 Visit our YouTube channel for step-by-step video tutorials
👉 YouTube.com/@NextGenTemplates


Reviews
There are no reviews yet.