


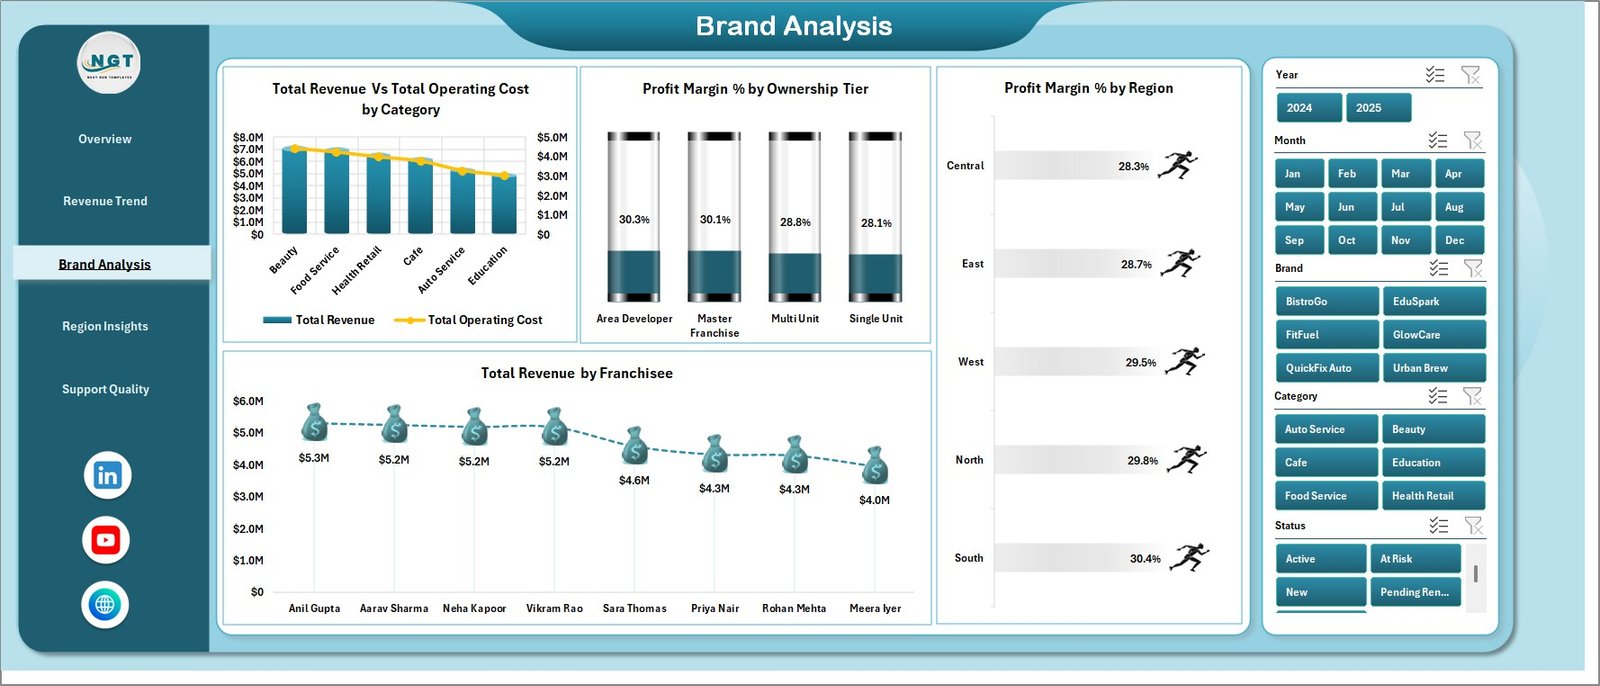



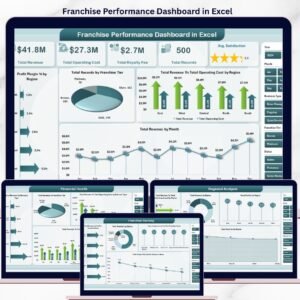
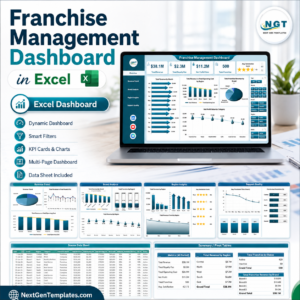
Franchise Management Dashboard in Excel helps franchise owners, operators, finance teams, and regional managers review revenue, royalty fees, operating cost, net profit, franchise status, compliance, satisfaction, brand, category, region, and ownership tier in one ready-to-use workbook. The template includes 7 Excel sheet tabs, 5 high-level KPI cards, multiple slicers, 18 analysis charts, a structured Data sheet, and a pivot-backed Support sheet. Join 10,000+ customers in 180+ countries using NextGenTemplates for one-time-purchase business templates. Instant download, lifetime file access, and no monthly SaaS subscription.
Key Features of Franchise Management Dashboard in Excel
- 7 worksheet tabs for Overview, Revenue Trend, Brand Analysis, Region Insights, Support Quality, Data, and Support.
- 5 executive KPI cards for Total Revenue, Total Royalty Fee, Net Profit Value, Total Franchise, and Avg. Satisfaction Score.
- Multiple slicers so users can filter the dashboard quickly by key franchise dimensions.
- Revenue and cost analysis by month, quarter, region, brand, category, franchisee, and status.
- Brand and ownership tier views for comparing profit margin, operating cost, revenue, and performance by brand or ownership level.
- Regional insight pages to compare compliance rating, satisfaction score, franchise count, and revenue by region.
- Pivot-powered workflow with a hidden Support sheet. Update the Data sheet, click Refresh All, and the dashboard updates.
- Editable Excel workbook for teams that want to customize fields, charts, colors, and slicers.
What’s Inside the Franchise Management Dashboard in Excel
1. Overview Page
The Overview page gives leadership a quick read on franchise network health. KPI cards show Total Revenue, Total Royalty Fee, Net Profit Value, Total Franchise, and Avg. Satisfaction Score, while slicers help users filter the entire dashboard quickly.
Total Revenue by Month: This chart shows monthly revenue movement across the franchise network. Use it to identify seasonality, growth months, or periods where revenue needs investigation.
Total Revenue Vs Total Operating Cost by Region: This comparison highlights whether each region is generating enough revenue to cover operating cost. It helps managers spot territories with margin pressure or stronger cost control.
Total Franchise Records by Status: This chart separates franchise records by operating status. It helps users understand active, inactive, at-risk, or other status groups at a glance.
Net Profit Value by Category: This chart shows which franchise categories contribute the most net profit. It supports category-level planning, expansion, and performance review.
2. Revenue Trend
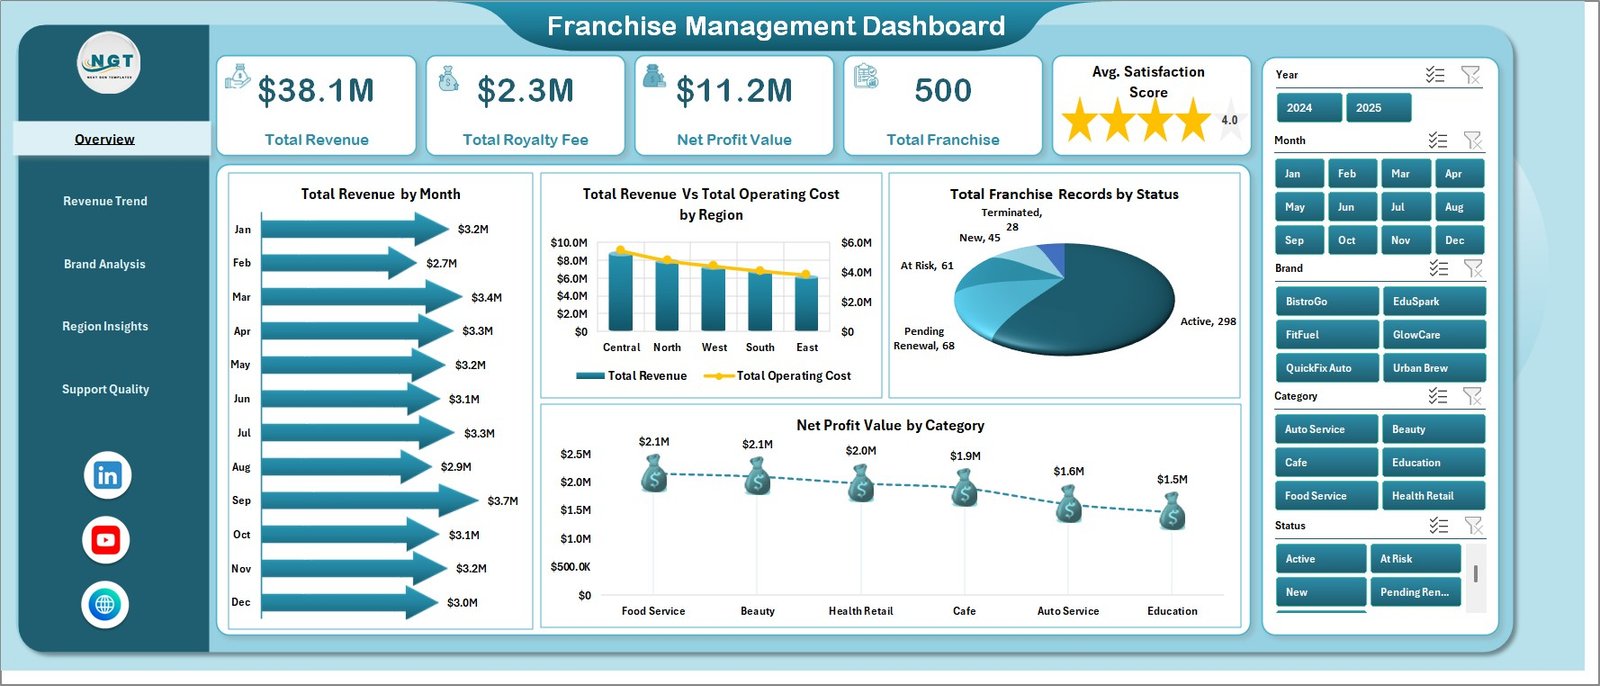
The Revenue Trend sheet focuses on time-based and brand-level financial movement. It includes Total Revenue by Quarter, Total Customer Visits by Month, Net Profit Value by Brand, and Total Revenue Vs Total Operating Cost by Brand.
Total Revenue by Quarter: Review quarterly revenue performance and compare high-level movement across the year.
Total Customer Visits by Month: Track monthly visit volume and connect customer activity with revenue changes.
Net Profit Value by Brand: Compare brand-level profitability to identify stronger and weaker franchise brands.
Total Revenue Vs Total Operating Cost by Brand: See where brand revenue is outpacing cost and where margins may need attention.
3. Brand Analysis
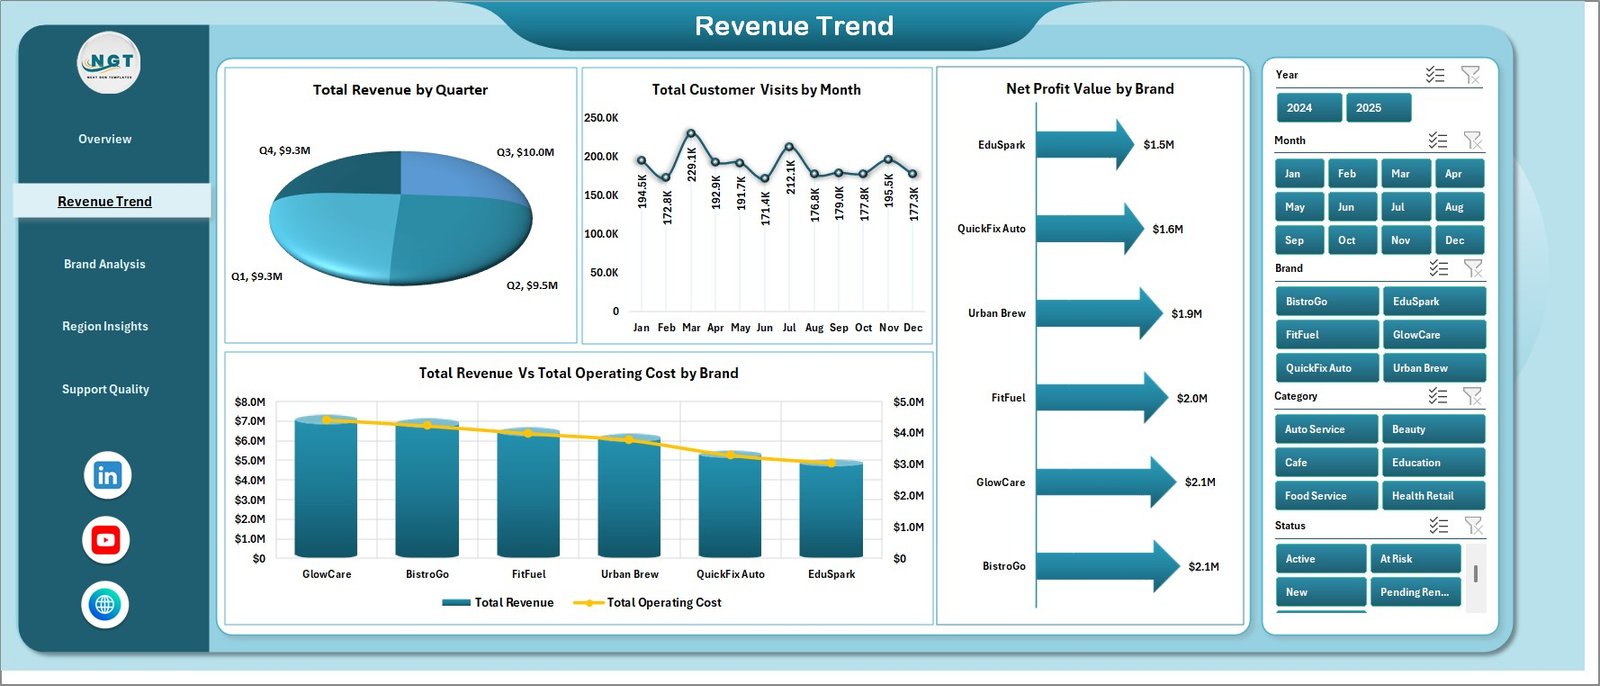
The Brand Analysis sheet compares financial and margin performance across categories, ownership tiers, regions, and franchisees.
Total Revenue Vs Total Operating Cost by Category: Compare income and cost side by side for each category to find strong and weak operating areas.
Profit Margin % by Ownership Tier: Review whether ownership tiers are producing different margin patterns.
Profit Margin % by Region: Compare regional profitability and identify locations that need cost or revenue action.
Total Revenue by Franchisee: Rank franchisees by revenue contribution for performance reviews and coaching.
4. Region Insights
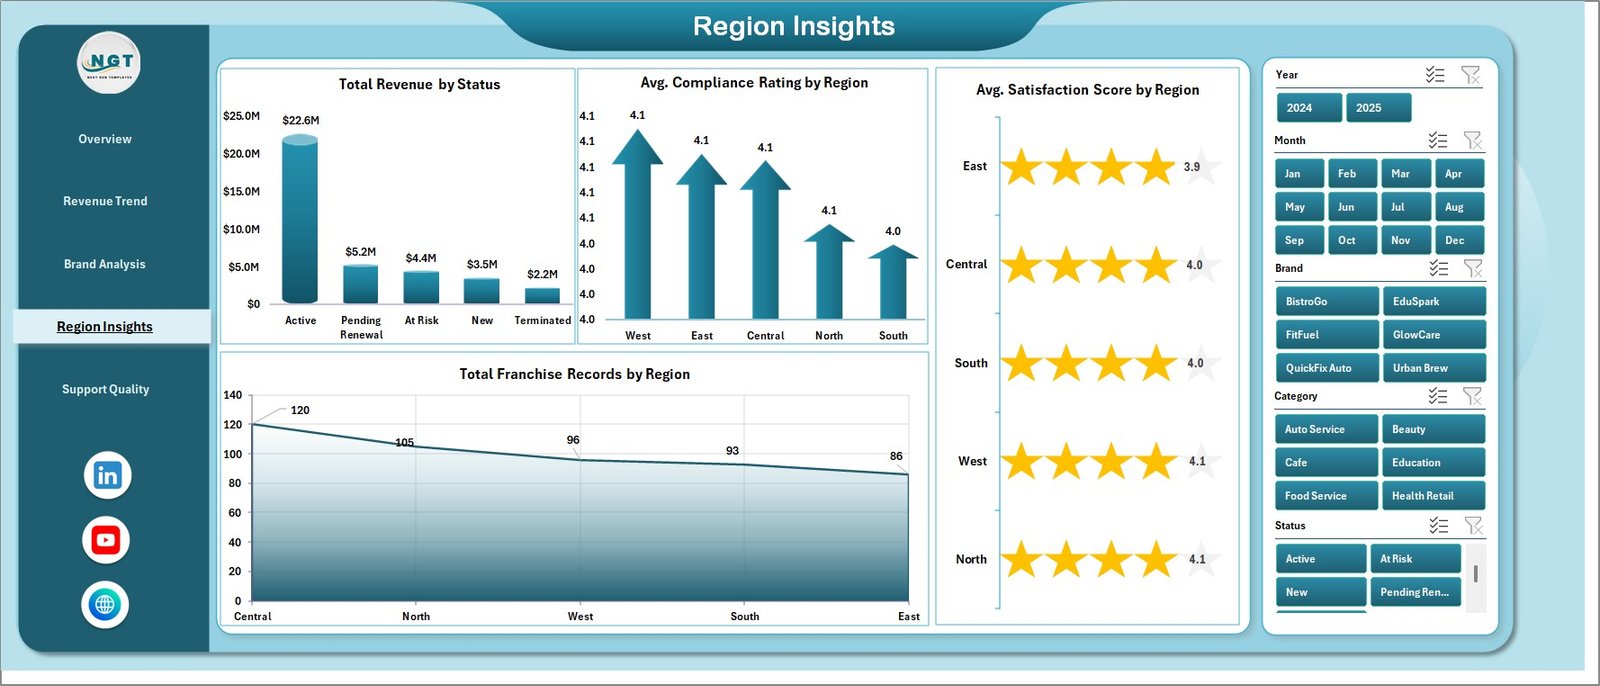
The Region Insights sheet helps teams understand geographic performance and service quality.
Total Revenue by Status: See how revenue is distributed across franchise status groups.
Avg. Compliance Rating by Region: Compare compliance quality between regions and prioritize follow-up where ratings fall.
Avg. Satisfaction Score by Region: Review customer or franchisee satisfaction by geography to detect experience gaps.
Total Franchise Records by Region: Understand the size and distribution of the franchise network across regions.
5. Support Quality
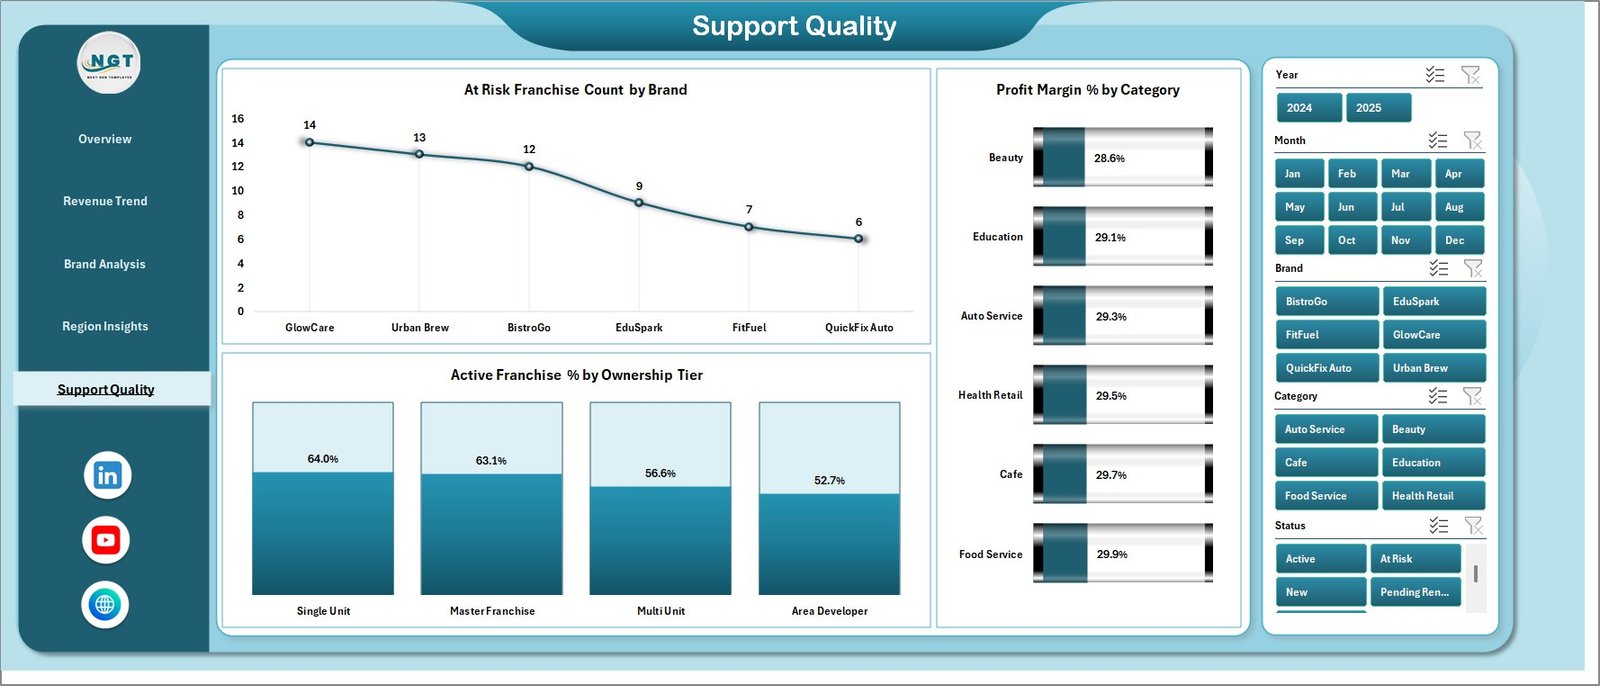
The Support Quality sheet focuses on risk, margin, and active franchise rate. It includes At Risk Franchise Count by Brand, Profit Margin % by Category, and Active Franchise % by Ownership Tier.
At Risk Franchise Count by Brand: Identify brands with more at-risk franchise locations so support teams can prioritize intervention.
Profit Margin % by Category: Compare category profitability and find areas where cost, pricing, or operations may need review.
Active Franchise % by Ownership Tier: Check whether ownership tiers differ in active franchise rate and network health.
6. Data Sheet Tab
The Data sheet is where users add or replace franchise records in the same structured format. Keep the column layout unchanged so slicers, pivot tables, cards, and charts continue working correctly.

7. Support Sheet Tab
The Support sheet contains multiple pivot tables used to build the entire dashboard dynamically. After updating the Data sheet, go to the Data tab in the Excel Ribbon and click Refresh All. All pivots and charts refresh, and the Support sheet can stay hidden for end users.

Franchise Management Dashboard in Excel vs. Google Sheets vs. Paid CRM/SaaS – Where This Fits
| Feature | This Excel Dashboard | Google Sheets Alternative | Paid Franchise SaaS |
|---|---|---|---|
| Cost | $17.99 one-time | Low one-time or monthly workspace cost | Monthly subscription |
| Platform | Microsoft Excel | Browser-based Google Sheets | Vendor cloud platform |
| Setup time | Open workbook, replace data, refresh | Copy sheet and replace data | Implementation and onboarding |
| Real-time team collaboration | Possible with OneDrive or SharePoint | Native Google sharing | Usually built in |
| Mobile access | Excel mobile or browser viewer | Google Sheets app | Vendor app or browser |
| Customizable fields | High for Excel users | High for spreadsheet users | Limited by plan and permissions |
| Share with link | Possible with OneDrive | Native sharing | Role-based access |
| Year-1 cost at 5 users | $17.99 total | Low one-time cost or workspace cost | Often hundreds or thousands of dollars |
| Best use case | Franchise reporting, review meetings, and Excel-based analysis | Collaborative lightweight reporting | Full franchise operations workflow |
Who This Template Is For – and Who It’s Not For
This template is for franchisors, multi-unit franchise owners, regional managers, operations teams, finance analysts, franchise consultants, and business owners who need clear Excel reporting for revenue, royalty fees, profit, operating cost, status, compliance, satisfaction, brand, region, and ownership tier.
It is not a replacement for POS software, franchise CRM, live API integrations, contract management, payroll, or full franchisee onboarding software. It works best when your franchise records can be entered or exported into the Data sheet.
How to Use the Franchise Management Dashboard in Excel
- Download and unzip the Excel dashboard package.
- Open the workbook in Microsoft Excel.
- Go to the Data sheet and replace the sample records with your own franchise data.
- Keep the same column structure so pivots and slicers continue working.
- Go to the Excel Ribbon Data tab and click Refresh All.
- Use slicers to review Overview, Revenue Trend, Brand Analysis, Region Insights, and Support Quality pages.
- Hide the Support sheet if you want a cleaner workbook for end users.
Real-World Use Cases
Priya, Franchise Operations Manager: reviews total revenue, royalty fee, net profit, and satisfaction before every monthly franchise review meeting.
Marcus, Multi-Unit Franchise Owner: filters the dashboard by region and brand to compare operating cost and net profit across locations.
Elena, Franchise Consultant: uses the Brand Analysis and Region Insights pages to prepare improvement recommendations for clients.
Frequently Asked Questions
Does this dashboard work in Microsoft Excel?
Yes. It is built for Microsoft Excel and uses worksheets, charts, slicers, and pivot tables.
What pages are included?
The workbook includes Overview, Revenue Trend, Brand Analysis, Region Insights, Support Quality, Data, and Support sheets.
Can I replace the sample data?
Yes. Replace or append rows in the Data sheet, keep the same format, and click Refresh All from the Data tab.
Can I hide the Support sheet?
Yes. The Support sheet powers the dashboard with pivot tables and can be hidden after setup.
Is this a full franchise CRM?
No. It is an analytics dashboard for reporting and performance review, not a CRM or operations management platform.
Can I customize the dashboard?
Yes. Excel users can edit charts, slicers, colors, fields, labels, and pivot tables as needed.
About the Author
Built by PK – Microsoft Certified Professional with 15+ years of Excel, Google Sheets, and Power BI experience. Founder of NextGenTemplates, reaching 300K+ subscribers across YouTube channels. Every template is hand-built and tested before release.
Explore Related Templates
You may also like the Franchise Performance Dashboard in Excel, Franchise Performance Dashboard in Power BI, and Franchise Management KPI Dashboard in Excel. Browse more Excel Dashboard templates and MS Excel templates.
Click here to read the detailed blog post.
Download the Franchise Management Dashboard in Excel today and turn franchise data into clear revenue, profit, royalty, brand, region, and quality insights.
Last updated: June 15, 2026.
Watch the step-by-step video tutorial:
Compatibility and Requirements
- Works in Microsoft Excel desktop (Excel 2016 or later, or Microsoft 365).
- The dashboard uses slicers to filter every page. Microsoft explains them in Use slicers to filter data.
- Charts are driven by pivot tables on the Support sheet, so run Refresh All from the Data tab after you change the Data sheet.
More Questions About This Template
How many charts and KPI cards does it have?
It has 5 KPI cards (Total Revenue, Total Royalty Fee, Net Profit Value, Total Franchise and Avg. Satisfaction Score) and 18 analysis charts across the Overview, Revenue Trend, Brand Analysis, Region Insights and Support Quality sheets.
Do the charts update when I add my own data?
Yes. Replace the sample records on the Data sheet, keep the same columns, then go to the Data tab and click Refresh All. The pivot tables, cards and charts update.
Can I compare regions and brands?
Yes. The Region Insights sheet compares compliance rating, satisfaction score and franchise count by region. The Brand Analysis and Revenue Trend sheets compare revenue, operating cost and net profit by brand and category.
Is there a Power BI version?
Yes. See the Franchise Management Dashboard in Power BI.
Is there a Google Sheets version for franchise performance?
Yes. See the Regional Franchise Performance Dashboard in Google Sheets.










Reviews
There are no reviews yet.