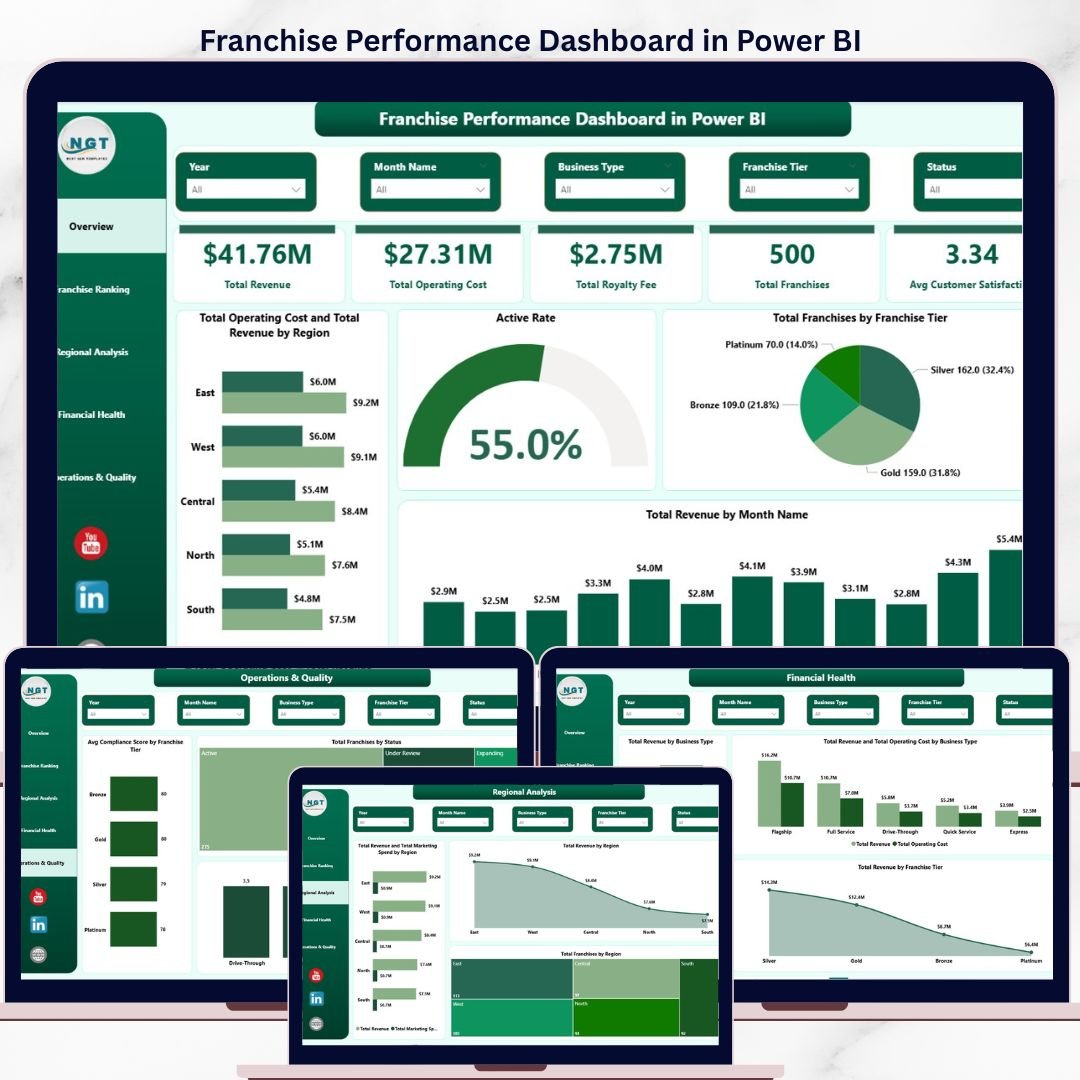


The Franchise Performance Dashboard in Power BI monitors 5 headline KPIs across 5 interactive report pages, with 14 pre-built visuals covering Total Revenue, Total Operating Cost, Total Royalty Fee, Total Franchises, and Avg Customer Satisfaction. Connect your data source once and every chart, card, and ranking rebuilds automatically — no manual pivot refresh required.
🌍 Join 8,400+ teams in 40+ countries using Nextgen Templates to replace paid SaaS tools with one-time-purchase Power BI Dashboard Templates.
✅ Instant download · One-time payment · No subscription · No per-user fees · Lifetime access
🔑 Key Features of Franchise Performance Dashboard in Power BI
🔹 5 dedicated analysis pages — Overview, Franchise Ranking, Regional Analysis, Financial Health, and Operations & Quality give franchise operators a 360° view of network performance without switching tools.
🔹 Active Rate visual — The Active Rate gauge on the Overview page gives an instant read on franchise activation health across the entire network — a metric most generic business dashboards omit entirely.
🔹 Franchise Ranking by Revenue, Compliance, and Profit Margin — The Ranking page surfaces which franchise names sit in the top five across three independent performance dimensions simultaneously, enabling targeted support and coaching decisions.
🔹 Regional Revenue vs. Marketing Spend analysis — The Regional Analysis page compares Total Revenue against Total Marketing Spend by region to reveal which territories deliver the highest return on marketing investment.
🔹 Compliance and Satisfaction scoring — Avg Compliance Score by Franchise Tier and Avg Customer Satisfaction by Business Type identify underperforming units before audit escalations occur.
🔹 Power BI Desktop compatible — The .pbix file runs on the free version of Power BI Desktop (Windows & Mac). Replace the sample Excel data with your own and every visual updates automatically via Close & Apply.
🔹 Franchise Tier segmentation across all pages — Every analysis page includes Franchise Tier as a breakdown dimension, allowing franchisors to benchmark Gold, Silver, and Bronze (or equivalent) tier performance on revenue, compliance, and customer experience.
📦 What’s Inside the Franchise Performance Dashboard in Power BI
The template ships as a single .pixy file with 5 report pages:
1 — Overview Page
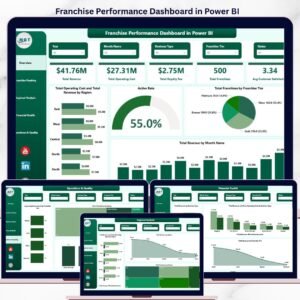
Five KPI cards at the top: Total Revenue, Total Operating Cost, Total Royalty Fee, Total Franchises, and Avg Customer Satisfaction. Four visuals below: Total Operating Cost and Total Revenue by Region (grouped bar), Active Rate (gauge), Total Franchises by Franchise Tier (bar chart), and Total Revenue by Month Name (line chart).
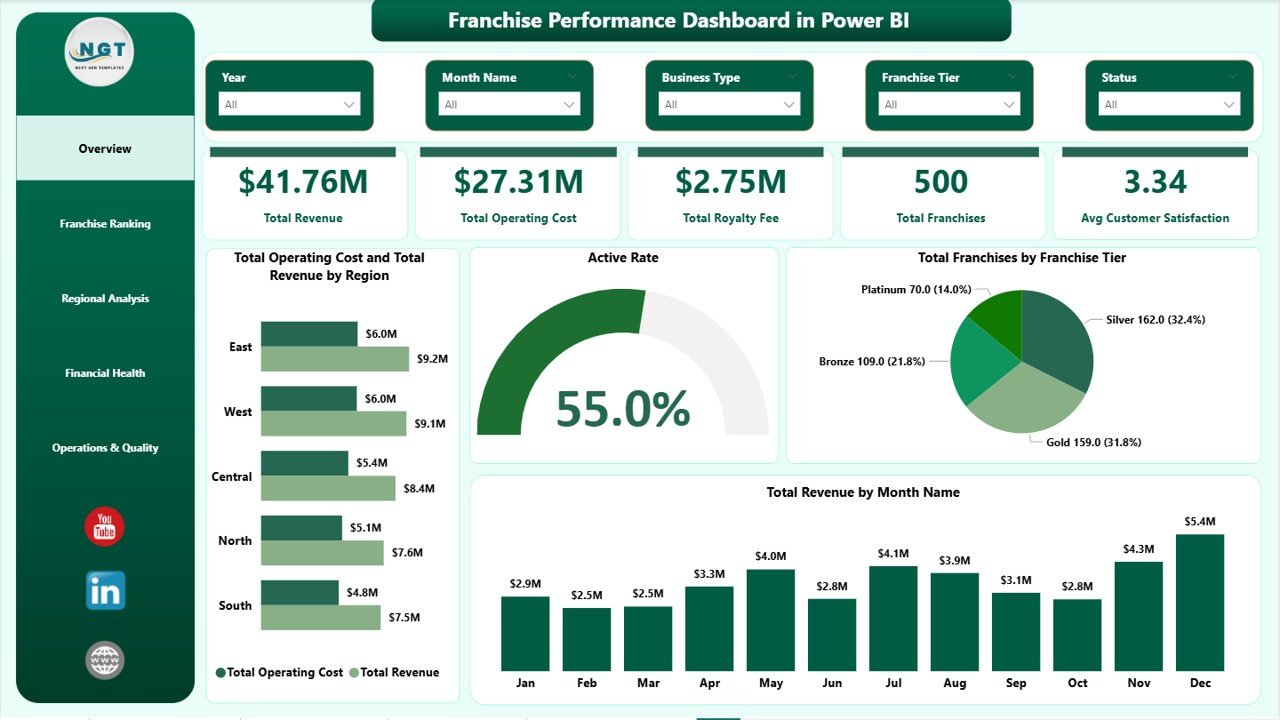
Franchise Performance Dashboard in Power BI — Overview Page
2 — Franchise Ranking
Ranks individual franchises across four metrics: Total Revenue by Top Five Franchise Name, Active Franchise Count by Franchise Tier, Avg Compliance Score by Top Five Franchise Name, and Profit Margin by Top Five Franchise Name.
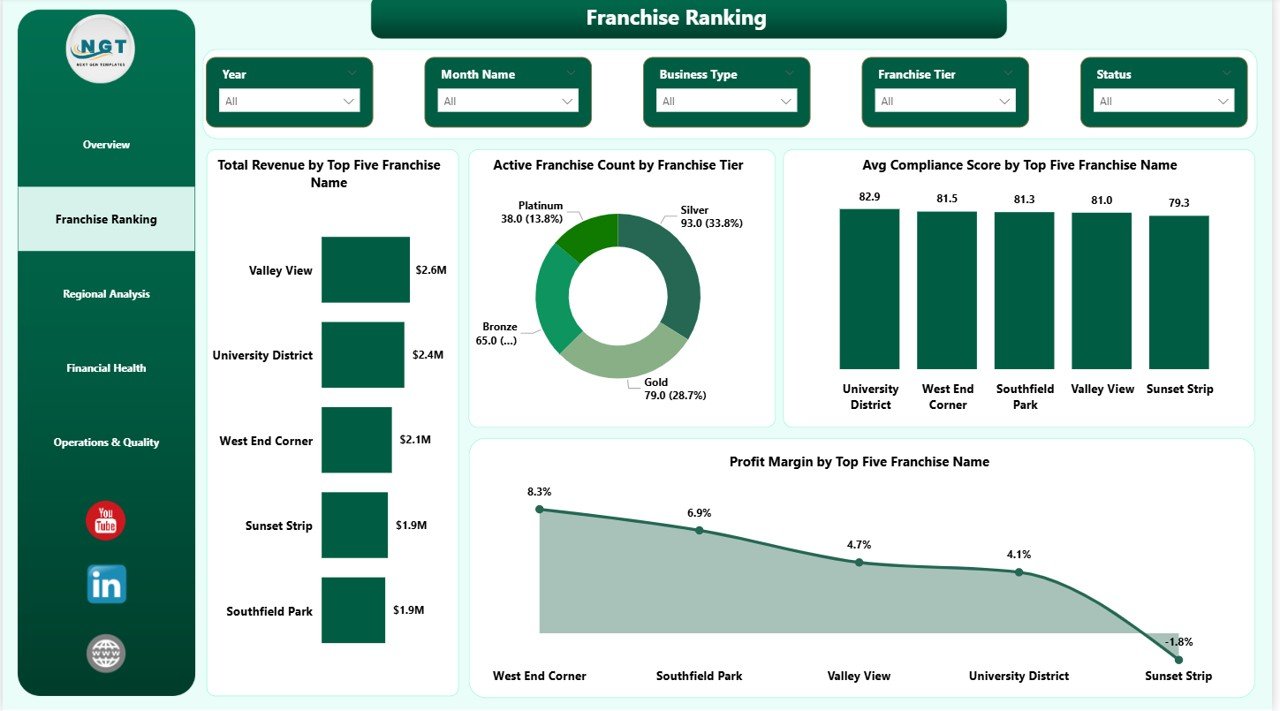
Franchise Ranking
3 — Regional Analysis
Geographic breakdown: Total Revenue and Total Marketing Spend by Region (side-by-side bar), Total Revenue by Region (bar chart), and Total Franchises by Region (bar chart). Shows which territories drive the most revenue and where marketing budgets are concentrated.
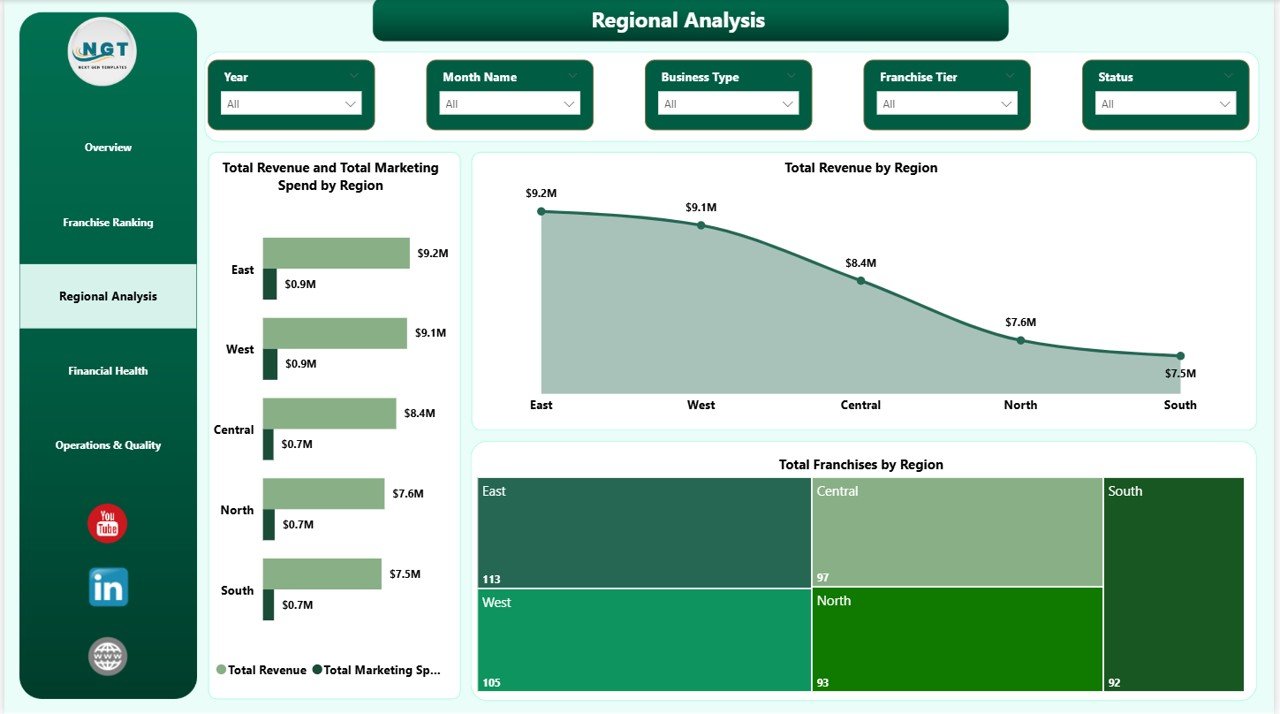
Regional Analysis
4 — Financial Health
Revenue and cost by business dimension: Total Revenue by Business Type, Total Revenue and Total Operating Cost by Business Type, and Total Revenue by Franchise Tier. Pinpoints which business models and tiers generate the widest margins.
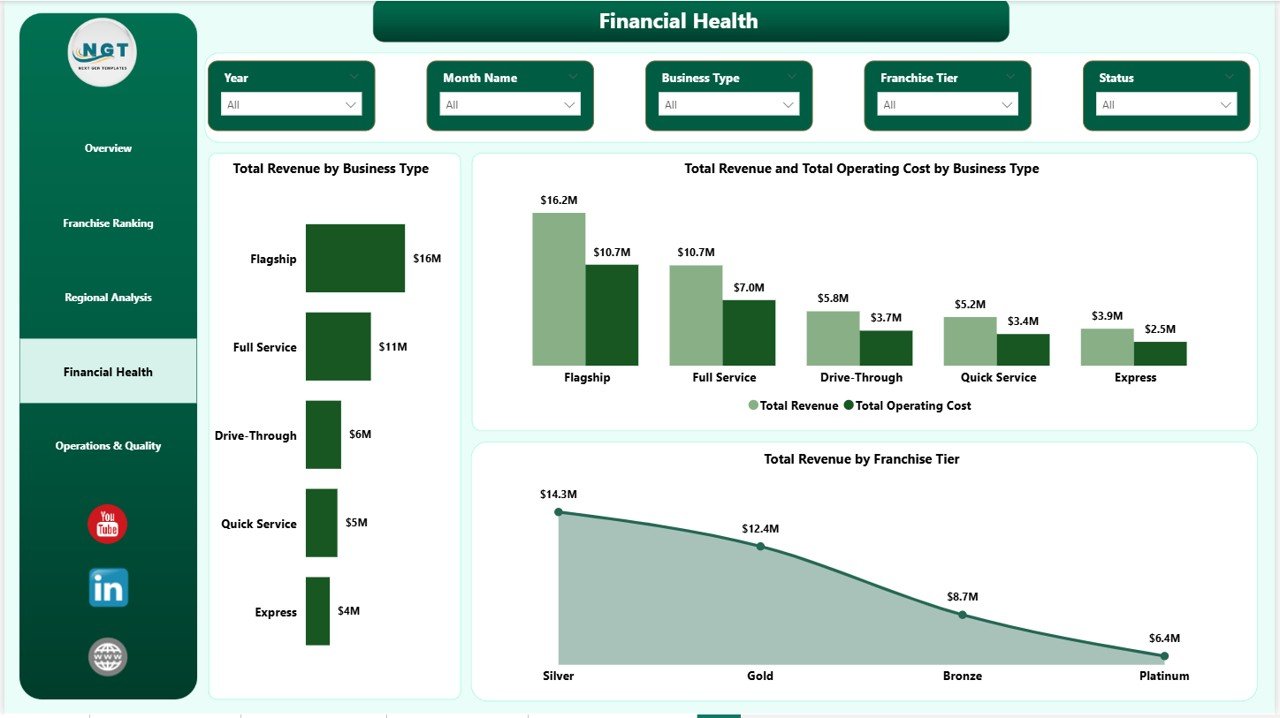
Financial Health
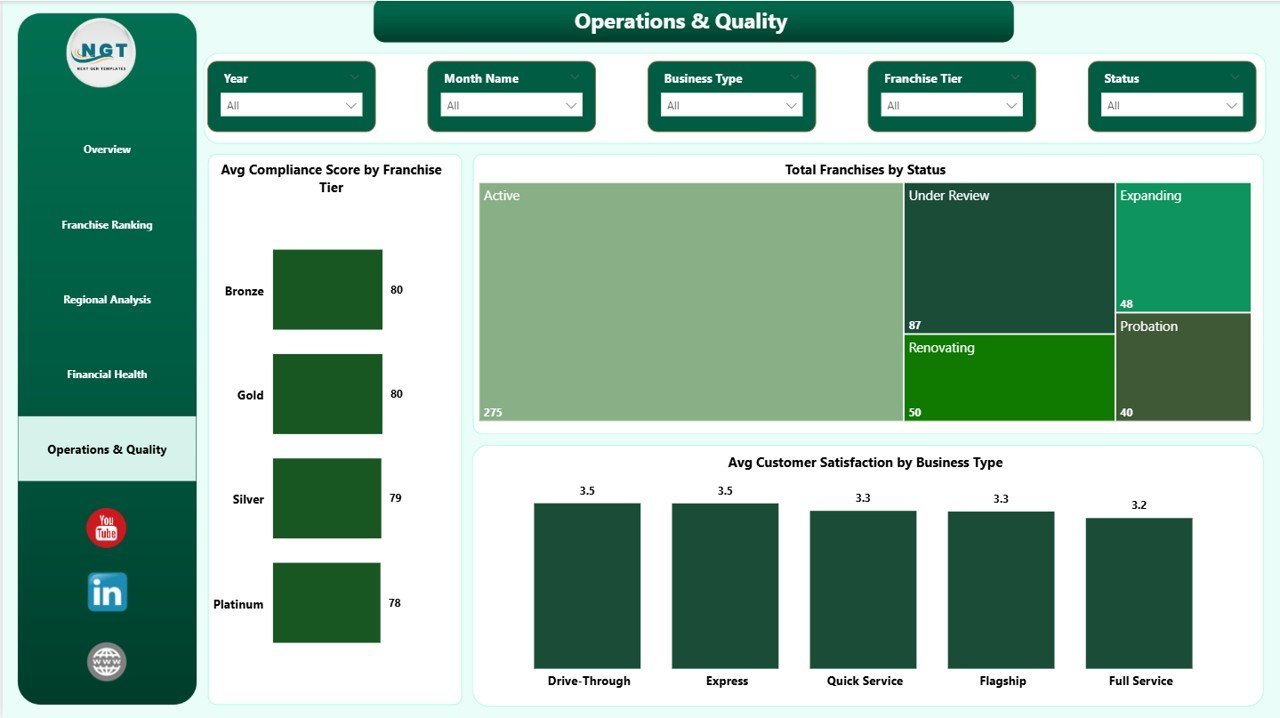
5 — Operations & Quality
Operational metrics: Avg Compliance Score by Franchise Tier, Total Franchises by Status (Active, Inactive, Probation), and Avg Customer Satisfaction by Business Type.

Operations & Quality
📊 Franchise Performance Dashboard in Power BI vs. Tableau / Qlik vs. Paid Franchise SaaS — Where This Fits
| Feature | Franchise Performance Dashboard in Power BI | Tableau / Qlik Equivalent | FranchiseConnect / Naranga |
|---|---|---|---|
| Cost | $17.99 one-time ✅ | $70–$150 / user / month | $200–$500 / month |
| Platform | Power BI Desktop (free) ✅ | Tableau Desktop / Qlik Sense | Cloud SaaS |
| Setup time | Under 15 min ✅ | 2–8 hrs custom build | 1–4 weeks onboarding |
| Real-time collaboration | Via Power BI Service (free tier) | ✅ Built-in | ✅ Cloud native |
| Works offline | ✅ Power BI Desktop offline | Limited | ❌ Internet required |
| Customizable fields | ✅ Full DAX & data model edit | ✅ High skill bar | Limited (locked templates) |
| Royalty fee tracking | ✅ Built-in | Build it yourself | Premium tier only |
| Compliance scoring by tier | ✅ Built-in | Build it yourself | Premium tier only |
| Year-1 cost (5 users) | $17.99 total ✅ | $4,200–$9,000 | $2,400–$6,000 |
For franchise operators who want Power BI-quality analytics without a Tableau license or SaaS subscription, the Franchise Performance Dashboard in Power BI sits in the sweet spot.
👥 Who This Template Is For — and Who It’s Not For
✅ This template is built for:
- Franchise owners and network operators managing 2–100 locations who need consolidated revenue, compliance, and satisfaction reporting
- Franchise development managers presenting quarterly performance reviews to franchisors or board-level stakeholders
- Finance teams at franchisors already using Power BI who need a ready-built franchise reporting layer
- Business analysts and consultants delivering Power BI performance insights to multi-location franchise clients
❌ This template is NOT for:
- Enterprise franchisors with 500+ locations needing real-time POS API feeds, SOC 2-compliant cloud storage, or enterprise SSO
- Teams that don’t use Power BI — see the Franchise Performance Dashboard in Excel for the Excel version
- Operators who need built-in CRM, contract management, or franchisee onboarding workflows beyond analytics reporting
⚙️ How to Use the Franchise Performance Dashboard in Power BI
- Download and unzip the file; open the .pbix file in Power BI Desktop (free from Microsoft).
- In the Home ribbon, click Transform Data → Edit Queries and point the data source to your own Excel or CSV file using the same column structure as the sample data.
- Click Close & Apply to load your data — all 5 report pages, KPI cards, and visuals refresh automatically.
- Use the slicers on each page to filter by Region, Franchise Tier, or Business Type.
- Publish to Power BI Service (free tier) to share with your team via browser — no desktop install needed for viewers.
💼 Real-World Use Cases
Jessica manages operations across 18 franchise locations for a national coffee brand. She connects the Franchise Performance Dashboard in Power BI to her monthly Excel export, publishes it to Power BI Service, and sends her franchisor a single report link every quarter — no slide deck assembly, no manual chart updates.
Rahul is a franchise consultant advising three clients in the food and retail sector. He keeps one .pbix file per client, swaps in each client’s data source, and delivers the same professional Franchise Ranking and Regional Analysis view across all engagements without rebuilding reports from scratch each time.
Maria heads finance at a 40-location fitness franchise group. The Financial Health page lets her compare Total Revenue vs. Total Operating Cost by Business Type month over month, tracking where royalty fees are compressing margins — and presenting those findings to her franchisor brand partner quarterly.
❓ Frequently Asked Questions
What KPIs does the Franchise Performance Dashboard in Power BI track?
The Franchise Performance Dashboard in Power BI tracks 5 headline KPIs: Total Revenue, Total Operating Cost, Total Royalty Fee, Total Franchises, and Avg Customer Satisfaction. Deeper metrics include Active Rate, Avg Compliance Score by Franchise Tier, Profit Margin by Franchise Name, and Revenue vs. Marketing Spend by Region across 14 pre-built visuals.
Do I need a paid Power BI license to use this dashboard?
No. The Franchise Performance Dashboard in Power BI runs on Power BI Desktop, which is free to download from Microsoft. A paid Power BI Pro or Premium license is only needed if you want to publish and share the report with multiple viewers via Power BI Service.
How do I connect my own franchise data?
Open the .pbix file in Power BI Desktop, go to Home → Transform Data → Edit Queries, and replace the sample file path with your own Excel or CSV data source. Keep the same column names as the sample data, click Close & Apply, and all 14 visuals across the 5 report pages refresh with your real franchise data.
How does this compare to Franchise Connect or Naranga?
Franchise Connect and Naranga are cloud franchise management platforms costing $200–$500 per month. The Franchise Performance Dashboard in Power BI delivers the same revenue, royalty, compliance, and satisfaction analytics at a one-time cost of $17.99 — no per-location fees, no subscription, no internet dependency for the desktop version.
Is there an Excel version of this dashboard?
Yes. The Franchise Performance Dashboard in Excel covers the same 5 analysis pages using pivot tables and slicers — ideal for teams that prefer Excel without installing Power BI Desktop.
Can I customize franchise tiers, regions, or business type labels?
Yes. Update the values in your connected data source, refresh the model in Power BI Desktop via Close & Apply, and all charts and KPI cards reflect your custom labels automatically. Power BI’s data model also supports full DAX measure editing for teams that want to add or modify metrics.
Is this a one-time purchase?
Yes — pay $17.99 once, download instantly, and use the Franchise Performance Dashboard in Power BI forever. No monthly fees, no subscription renewal, no per-user charges.
👤 About the Author
Built by PK — Microsoft Certified Professional with 15+ years of Excel, Google Sheets, and Power BI experience. Founder of Nextgen Templates, reaching 300K+ subscribers across YouTube channels (@PK-AnExcelExpert, @NextGenTemplates, @NeoTechNavigators). Every template is hand-built and tested before release.
🔗 Explore Related Templates
🔹 Franchise Performance Dashboard in Excel — same 5-page franchise analytics in a pivot-table-powered Excel format
🔹 Driving School Dashboard in Power BI — multi-location service business analytics in Power BI
🔹 Gym Retention Dashboard in Power BI — member retention, revenue, and operational KPIs in Power BI
Browse all Power BI Dashboard Templates →
📖 Click here to read the Detailed Blog Post
🎥 Visit our YouTube channel for step-by-step video tutorials
👉 YouTube.com/@NextGenTemplates
Watch the step-by-step video tutorial:
YouTube


Reviews
There are no reviews yet.