

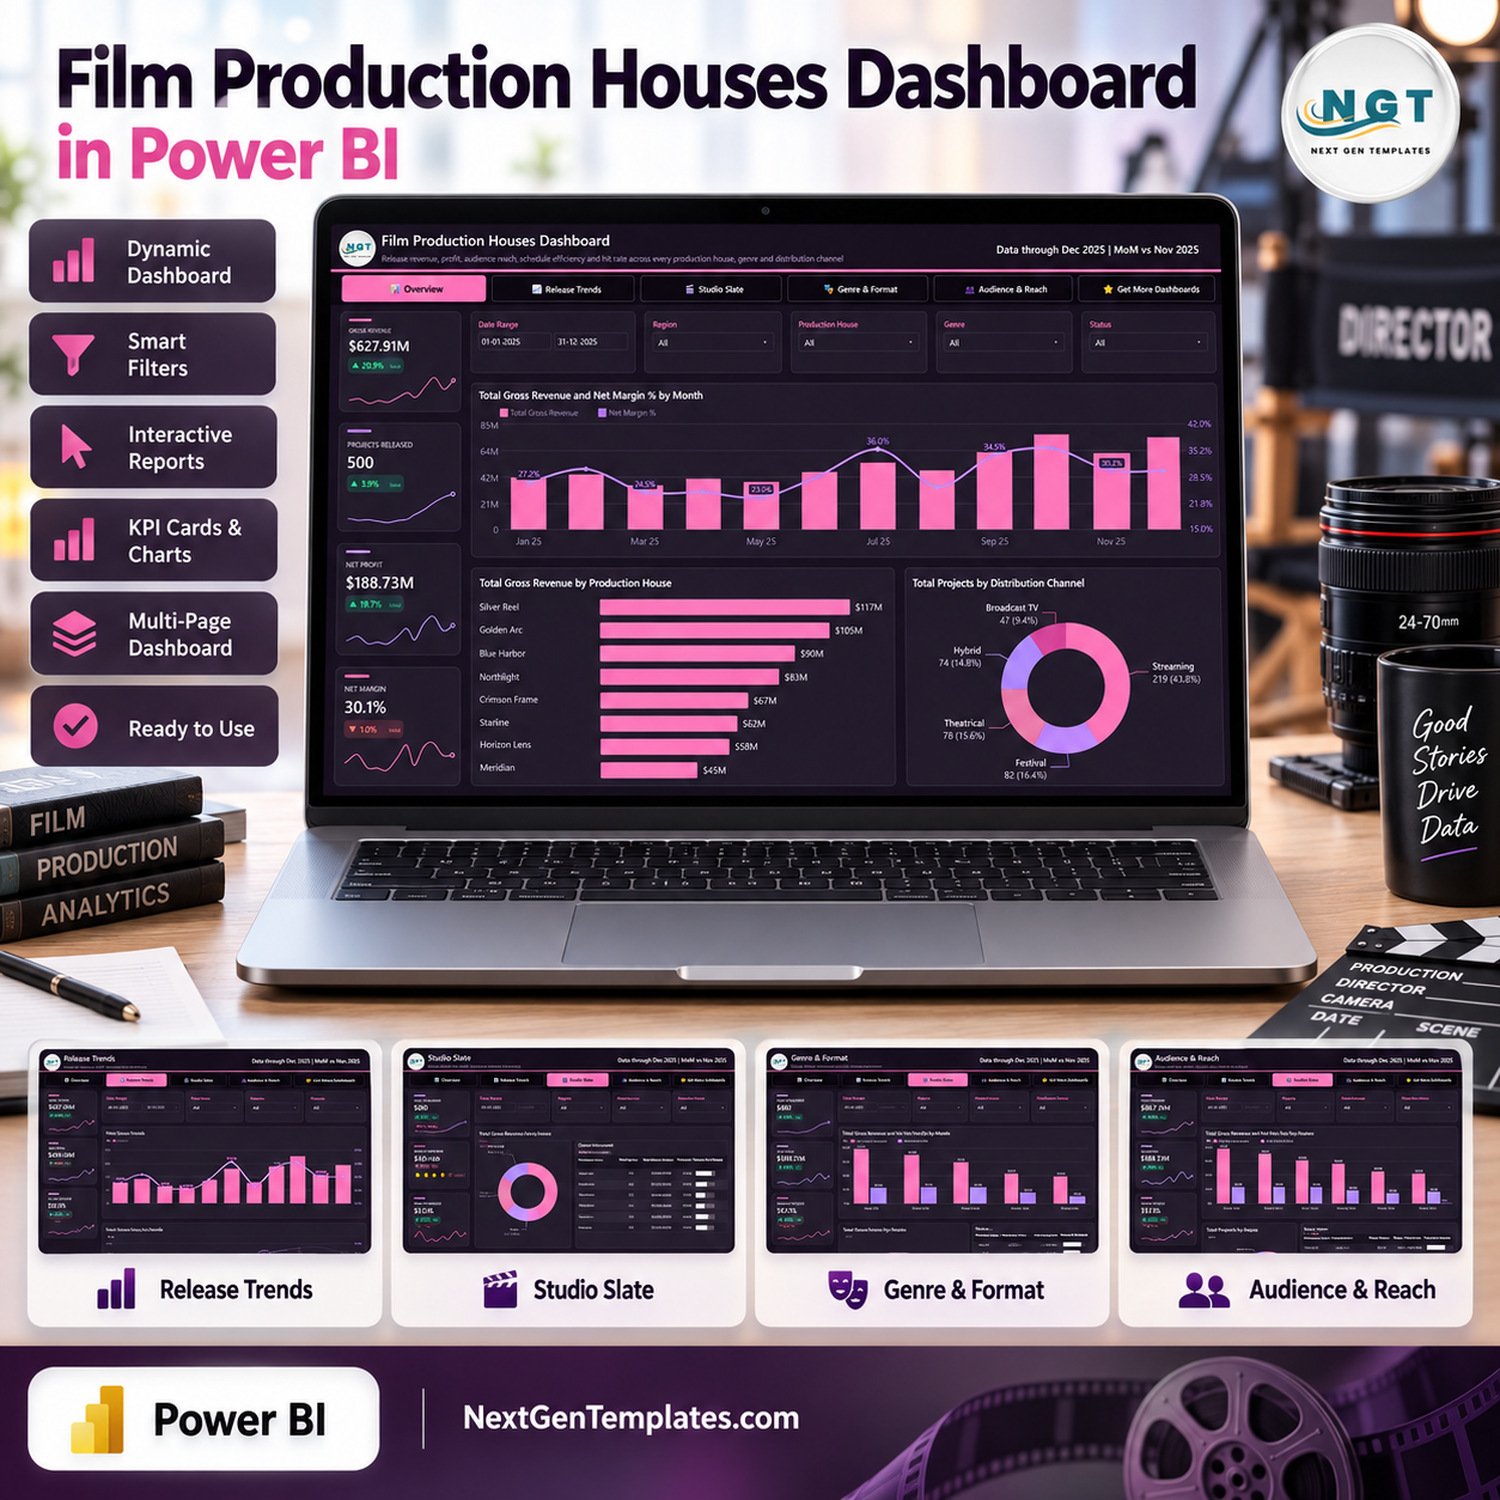
Film Production Houses Dashboard in Power BI turns a structured film-project dataset into five focused report pages for release, revenue, profit, audience, studio and genre analysis. The included sample view covers 500 projects and demonstrates filters for date, region, production house, genre, status, format and distribution channel. Download the editable PBIX, replace the sample source with your own compatible data, and review performance without committing to recurring analytics software fees. This is a ready-to-use reporting template, not a production-management, budgeting or scheduling application.
Key Features of Film Production Houses Dashboard in Power BI
- Five report pages: Overview, Release Trends, Studio Slate, Genre & Format, and Audience & Reach.
- Business filters: slice the report by date, region, production house, genre, status, format and distribution channel where shown.
- Financial analysis: compare gross revenue, net profit, net margin, total spend, ROI and revenue per project.
- Release analysis: monitor project volume, status mix, schedule efficiency and production-house contribution.
- Audience analysis: explore audience reach, audience rating, reach per project and revenue per viewer.
- Editable Power BI file: the customer download includes the PBIX plus the accompanying Excel data source.
This film production dashboard also works as a practical power bi dashboard template for analysts who want a polished report structure they can adapt. Its pages support film production analytics without claiming to replace accounting systems, rights-management software or production planning tools.
What’s Inside the Film Production Houses Dashboard in Power BI
Overview
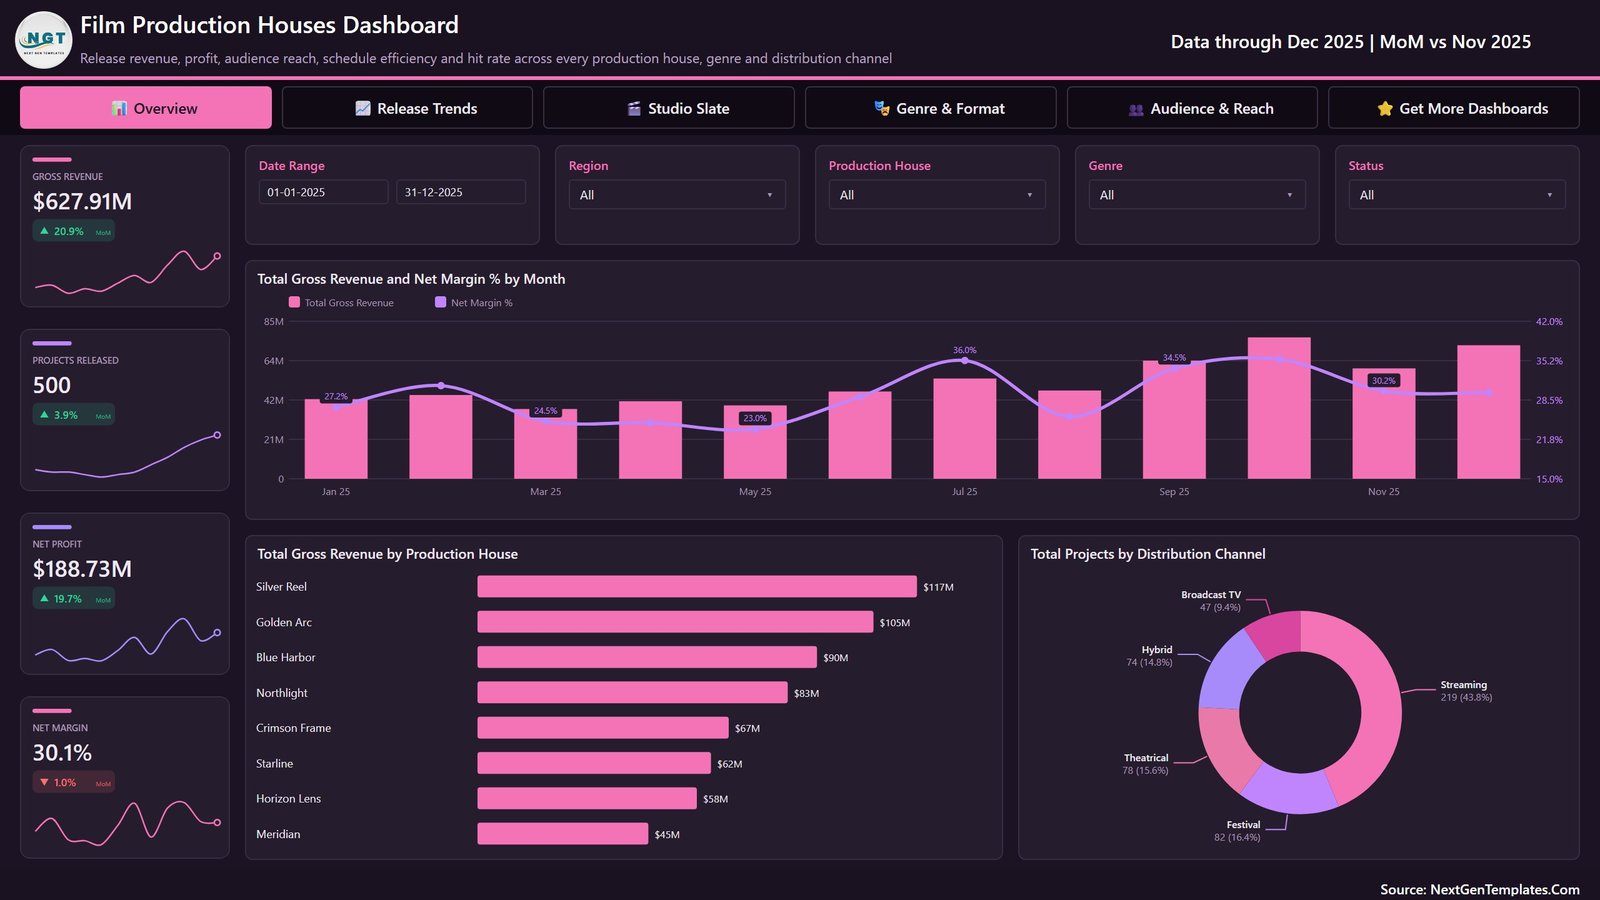
The Overview page brings gross revenue, projects released, net profit and net margin into one screen. It combines monthly revenue and margin, production-house revenue rankings and project distribution across streaming, theatrical, festival, broadcast and hybrid channels.
Release Trends
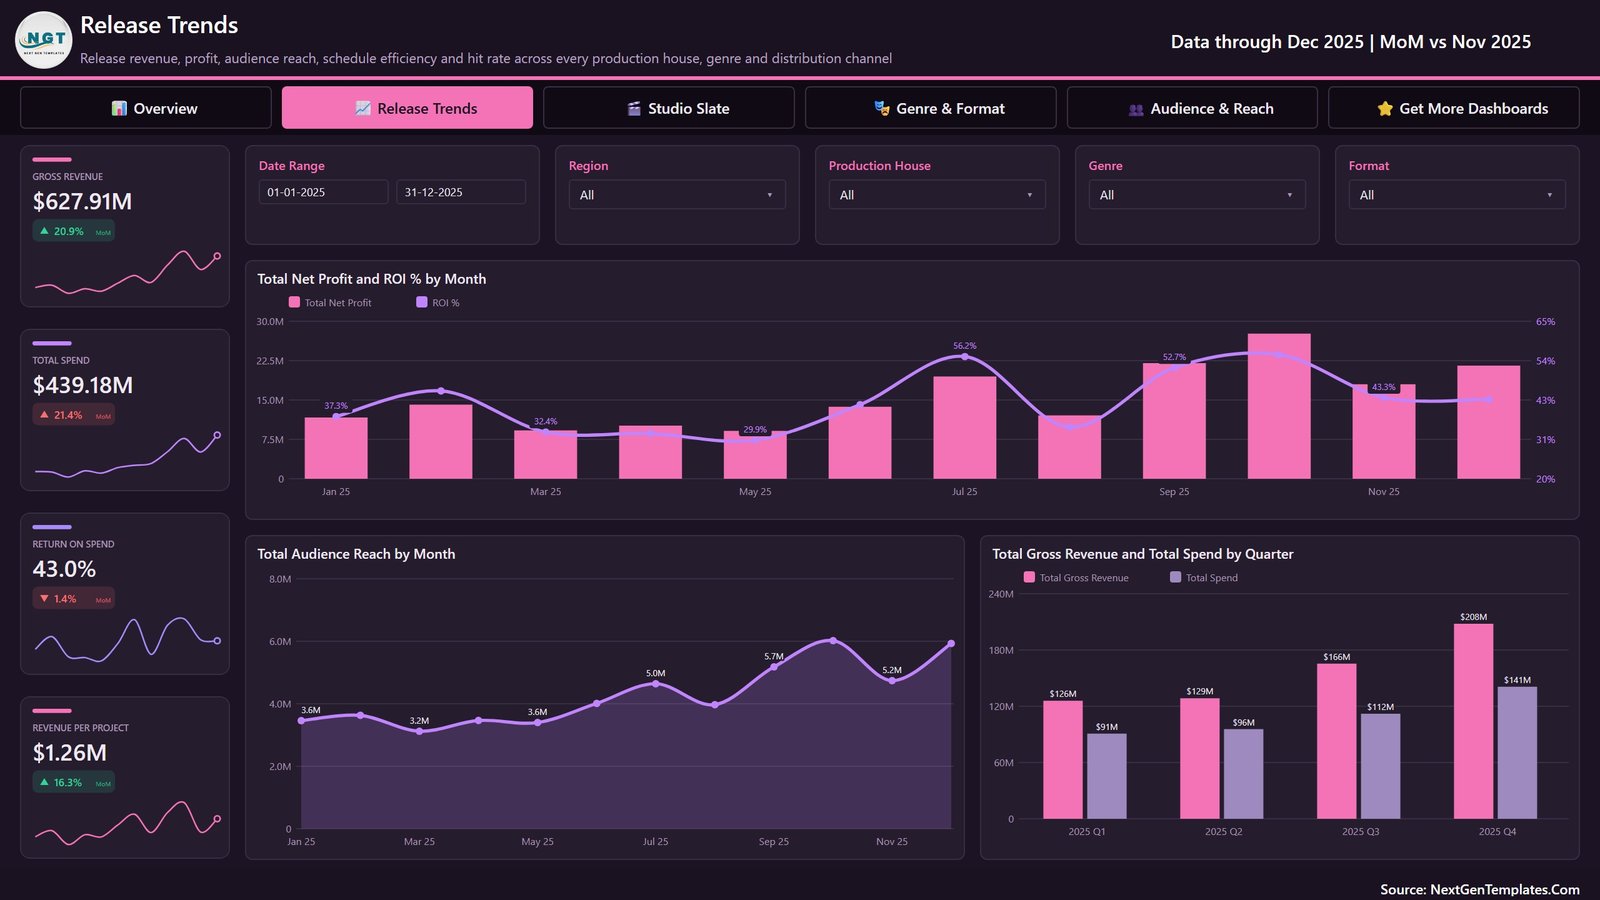
Release Trends focuses on total spend, return on spend, revenue per project, monthly net profit and ROI, monthly audience reach, and quarterly revenue versus spend. Filters include date, region, production house, genre and format.
Studio Slate
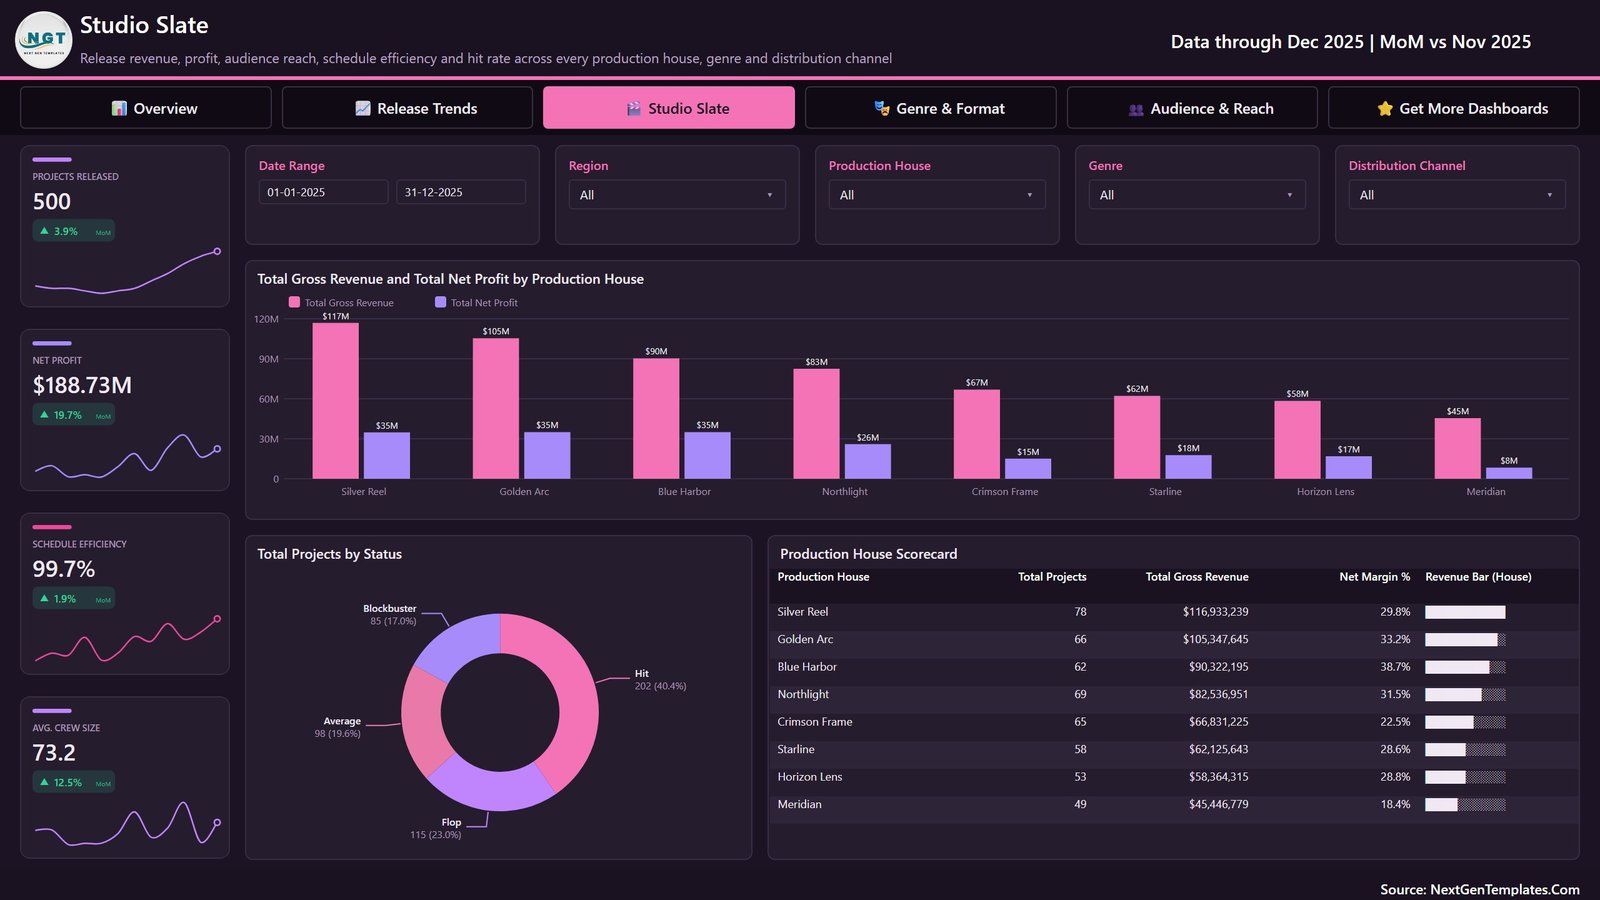
Studio Slate compares projects, net profit, schedule efficiency and average crew size. The page includes revenue and profit by production house, project-status distribution, and a detailed production-house scorecard.
Genre & Format
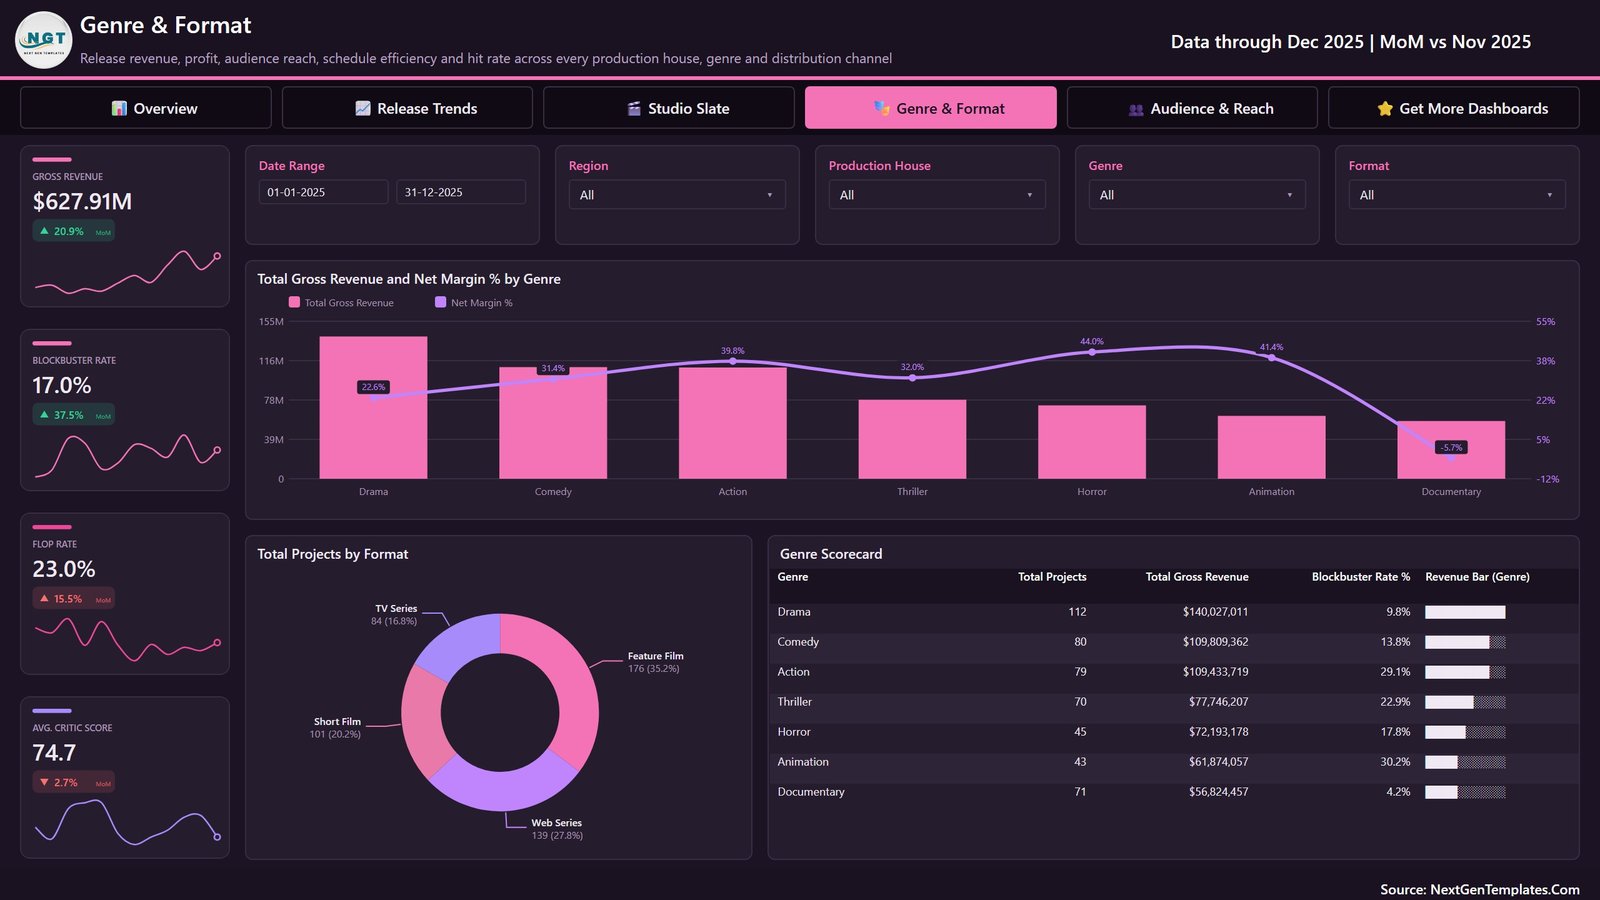
Genre & Format examines gross revenue, blockbuster rate, flop rate and average critic score. It also compares genre revenue and margin, project mix by format, and a genre scorecard.
Audience & Reach
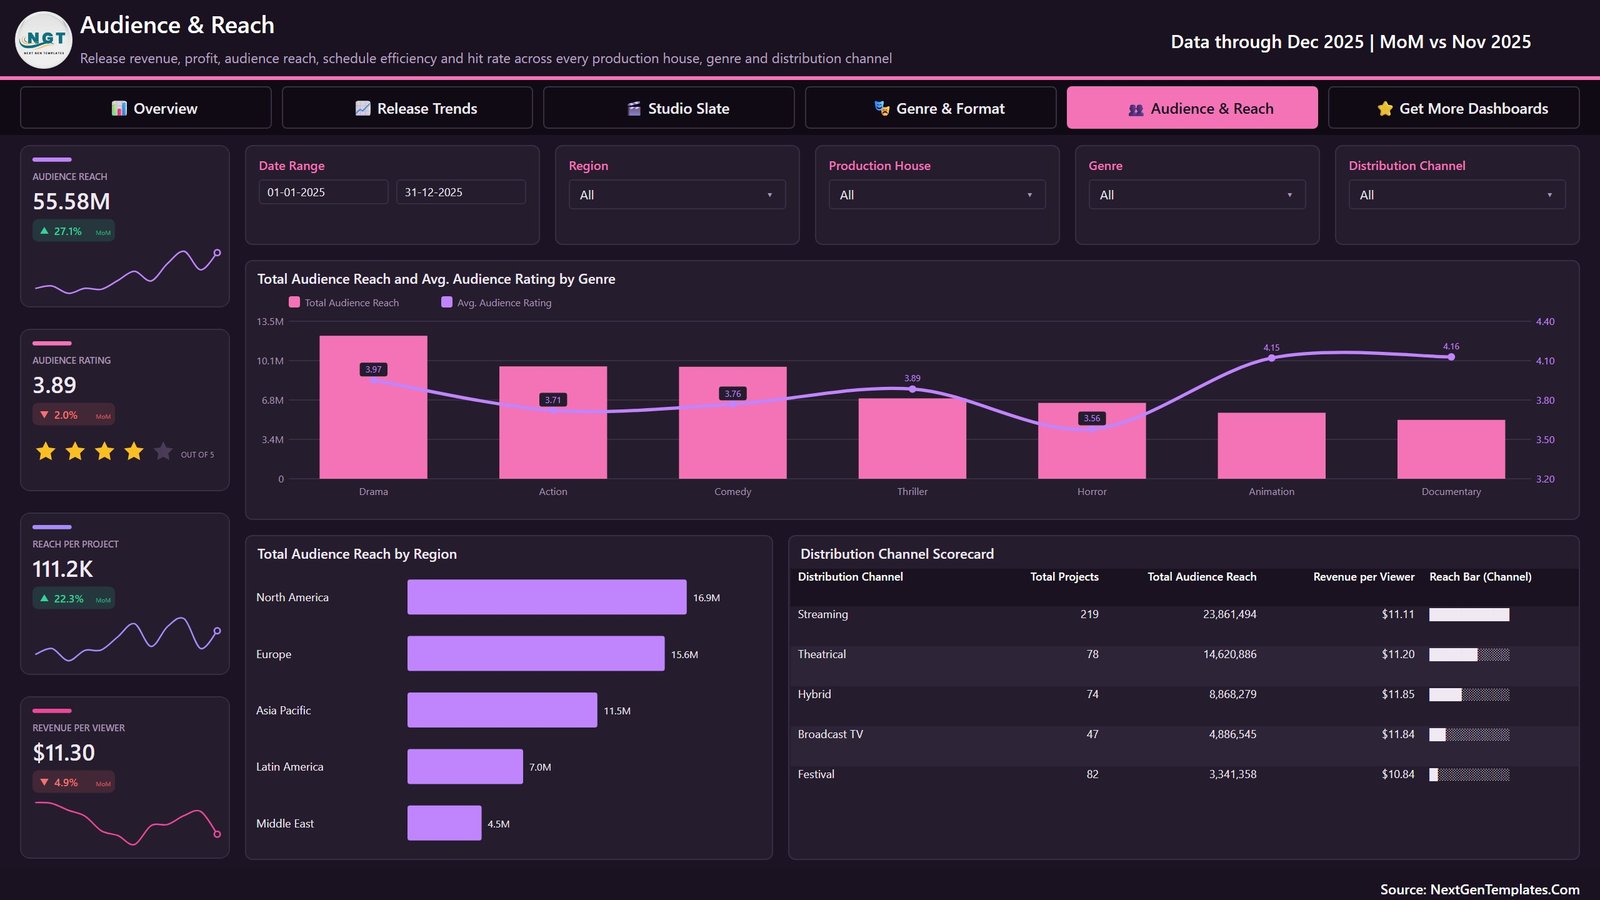
Audience & Reach reviews total reach, average rating, reach per project and revenue per viewer, supported by genre, region and distribution-channel comparisons.
Film Production Houses Dashboard in Power BI vs. Excel vs. Paid SaaS – Where This Fits
| Area | This Power BI template | Excel dashboard | Paid production SaaS |
|---|---|---|---|
| Purchase model | One-time template purchase | One-time template purchase | Usually subscription-based |
| Best fit | Interactive multi-page analysis | Spreadsheet-led analysis | Operational workflow management |
| Filters and drill-down | Native Power BI slicers and interactions | Workbook controls vary | Varies by platform |
| Data preparation | Compatible structured source required | Direct worksheet editing | Configuration or integrations may be required |
| Collaboration | Desktop file; sharing may require Microsoft services | File-based | Often cloud-based |
| Film-specific views | Five included analytical pages | Depends on workbook | May include broader operational modules |
Who This Template Is For – and Who It’s Not For
This production house performance dashboard is designed for film-studio analysts, independent producers, finance teams, portfolio reviewers and media consultants who already maintain structured project data. It is useful when management wants a consistent view of commercial results, release patterns, slate performance, genres and audience reach.
It is not a call sheet, shooting schedule, crew-booking tool, accounting ledger, rights-management system or forecasting engine. It does not provide live box-office feeds or automatic integrations. Power BI Desktop knowledge is helpful when replacing the sample source or changing the model.
How to Use the Film Production Houses Dashboard in Power BI
- Download and unzip the customer package.
- Open the PBIX in Microsoft Power BI Desktop.
- Review the five pages and the sample data definitions.
- Replace or refresh the included Excel source with compatible columns and data types.
- Check relationships, calculations and refresh results before relying on the report.
- Use the page filters and navigation buttons to explore releases, studios, genres, formats and audience outcomes.
Real-World Use Cases
Studio portfolio review
A strategy analyst can compare production houses, status mix, gross revenue and net profit before a slate-review meeting.
Release performance review
A finance partner can review monthly revenue, spend, ROI and audience reach to identify periods that need a closer source-data investigation.
Genre and distribution discussion
A producer can use genre, format and channel breakdowns to structure a discussion about historical patterns. The dashboard is descriptive; it does not predict a future hit.
Frequently Asked Questions
What is included in the download?
The ZIP contains the Film Production Houses Dashboard PBIX and its Excel data source.
Do I need Power BI Desktop?
Yes. The PBIX is intended for Microsoft Power BI Desktop.
Can I replace the sample data?
Yes, provided your source follows compatible column names, data types and relationships. Validate all refreshed measures afterwards.
Does it connect to live industry databases?
No. No live box-office, streaming or rights-data connection is included.
Can it manage productions?
No. It is an analytical report, not production-management software.
Are the displayed figures real company results?
No. The supplied report contains demonstration data for learning and customization.
About the Author
Built by PK – Microsoft Certified Professional with 15+ years of Excel, Google Sheets, and Power BI experience. Founder of NextGenTemplates, reaching 300K+ subscribers across YouTube channels. Every template is hand-built and tested before release.
Explore Related Templates
- Independent Filmmaking Dashboard in Power BI
- Media and Entertainment Dashboard in Power BI
- Film Production KPI Dashboard in Power BI
Browse more Power BI templates and Power BI dashboards.
Ready to analyse your film portfolio? Download the Film Production Houses Dashboard in Power BI, connect a compatible source and turn project records into a structured management review.
Last updated: September 2026.
































Reviews
There are no reviews yet.