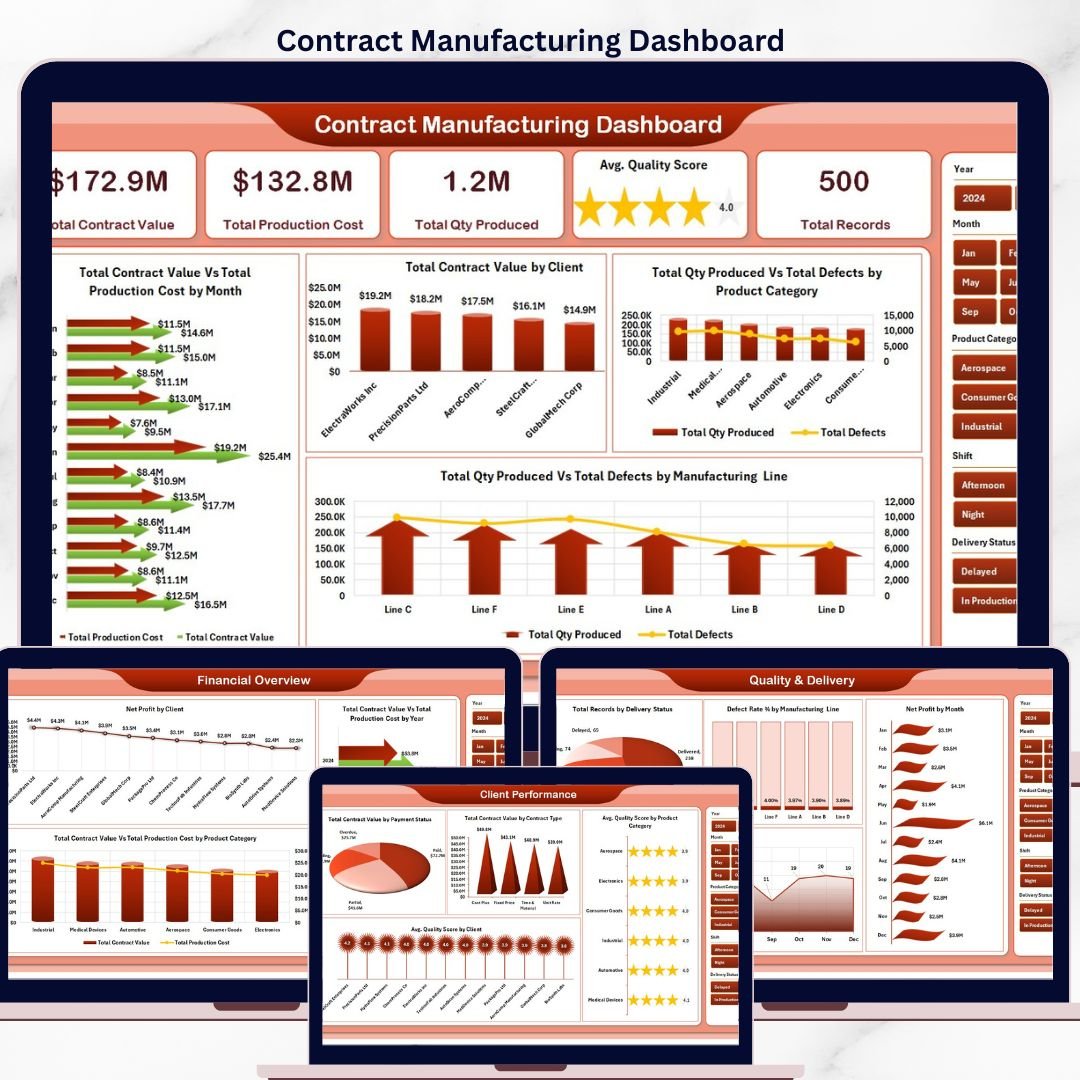
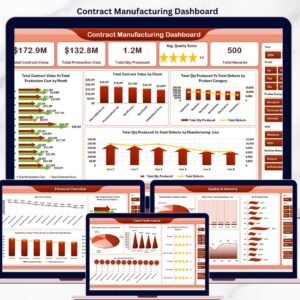
The Contract Manufacturing Dashboard in Excel tracks 5 executive KPIs across 5 interactive analysis pages, with 15+ pre-built charts and multiple slicers driving every view. Setup takes under 10 minutes — just replace the sample data in the Data sheet and refresh pivots, and every page updates automatically.
🌍 Join 8,400+ teams in 40+ countries using NextGenTemplates to replace paid SaaS manufacturing tools with one-time-purchase Excel, Google Sheets, Power BI, and HTML templates.
✅ Instant download · One-time payment · No subscription · No per-user fees · Lifetime access
 Contract Manufacturing Dashboard
🔑 Key Features of Contract Manufacturing Dashboard in Excel
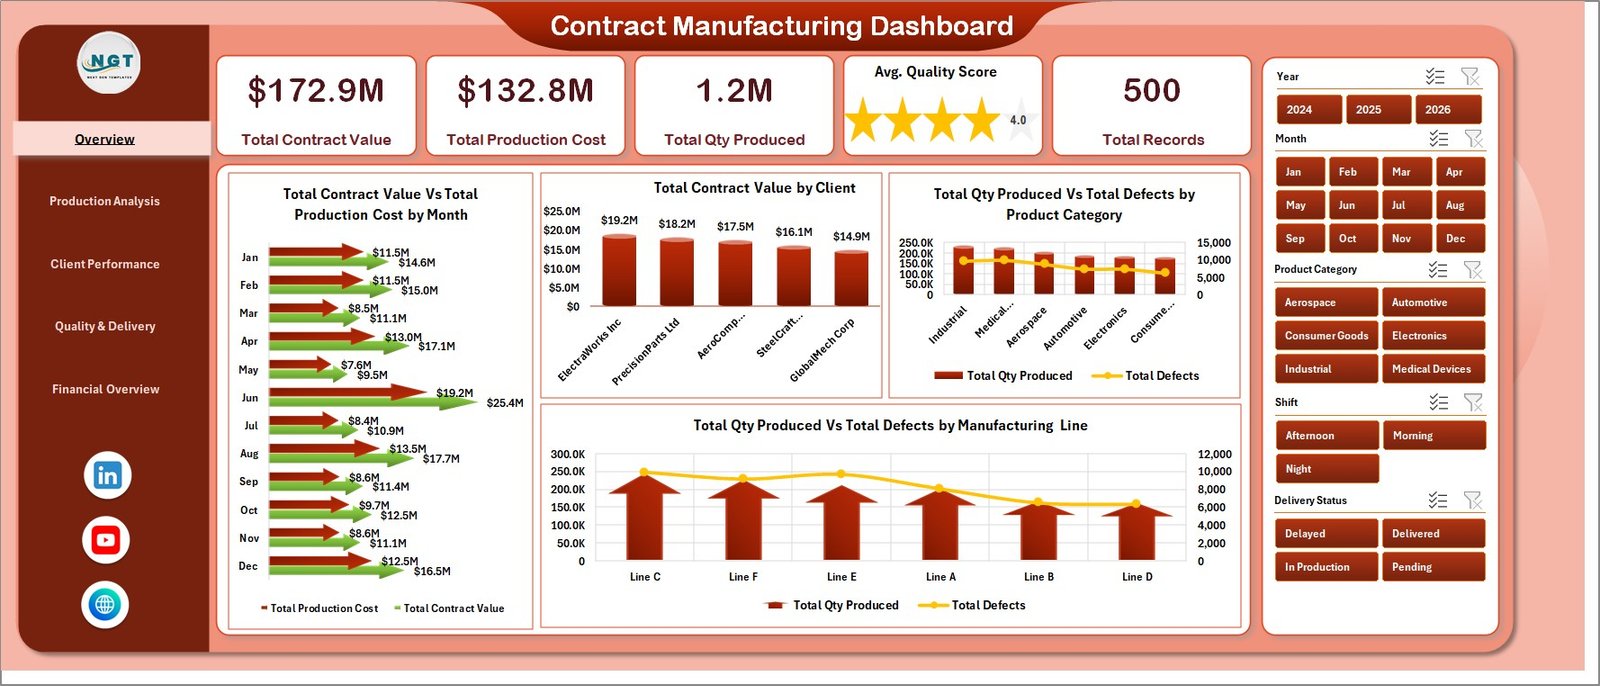
📊 5 Executive KPI Cards — The Overview page shows Total Contract Value, Total Production Cost, Total Qty Produced, Avg. Quality Score, and Total Records so plant leaders see the full picture in one glance.
🎛️ Multi-Slicer Filtering — Slicers on every page let you filter the entire dashboard by Client, Product Category, Manufacturing Line, Shift, and Payment Status without writing a single formula.
🏭 Manufacturing-Specific Metrics — Defect Rate %, Net Profit by Client, Contract Value vs. Production Cost, and Delivery Status tracking built specifically for contract manufacturers and OEM partners. This dashboard tracks 5 headline KPIs: Total Contract Value, Total Production Cost, Total Qty Produced, Avg. Quality Score, Total Records.
📦 What’s Inside the Contract Manufacturing Dashboard in Excel
1. Overview Page
The landing page shows 5 KPI cards — Total Contract Value, Total Production Cost, Total Qty Produced, Avg. Quality Score, Total Records — followed by four charts and multiple slicers. 📊 Total Contract Value Vs Total Production Cost by Month tracks revenue against cost. 🏢 Total Contract Value by Client ranks every OEM partner. 🔩 Total Qty Produced Vs Total Defects by Product Category highlights quality hotspots. ⚙️ Total Qty Produced Vs Total Defects by Manufacturing Line targets underperforming cells.
2. Production Analysis
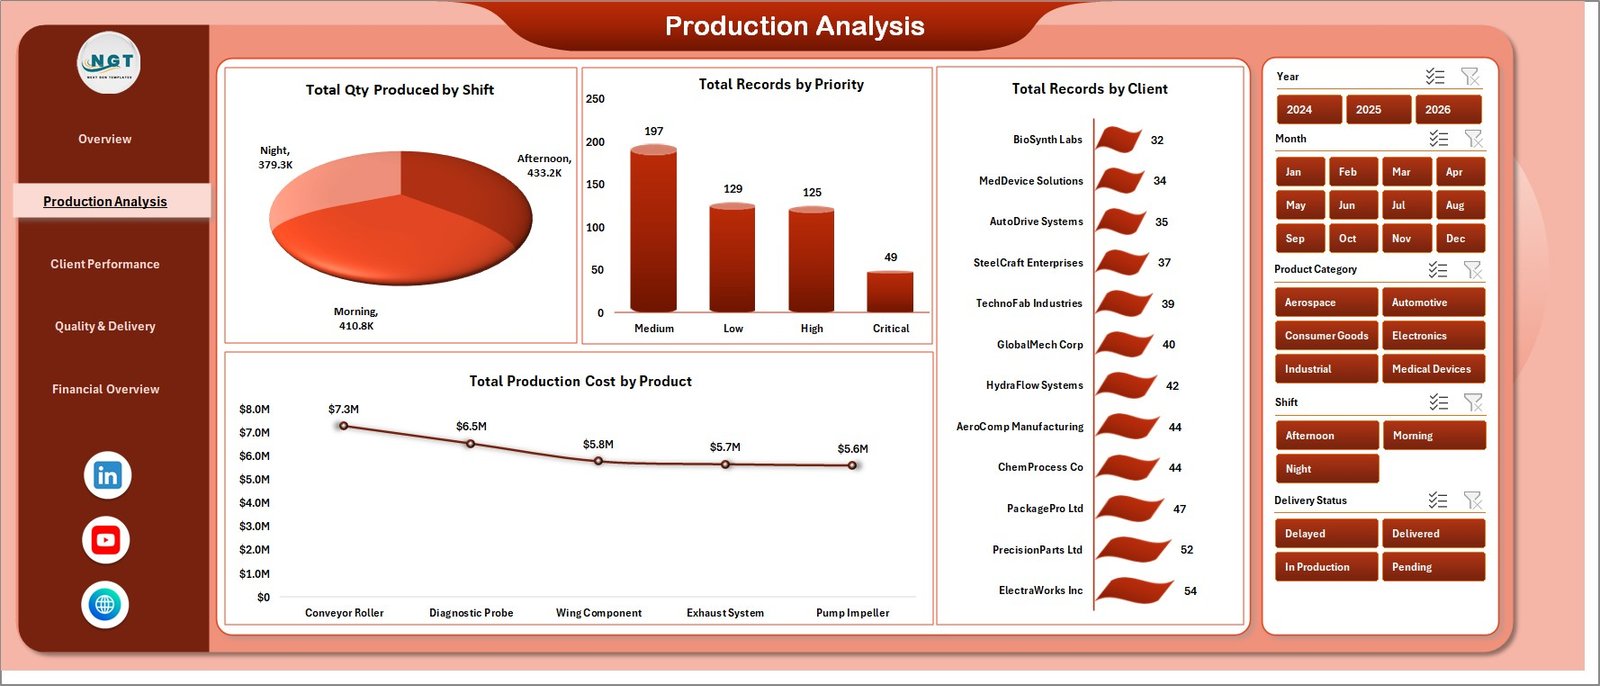
Production Analysis
🕐 Total Qty Produced by Shift · 🚦 Total Records by Priority · 🏭 Total Records by Client · 💵 Total Production Cost by Product.
3. Client Performance
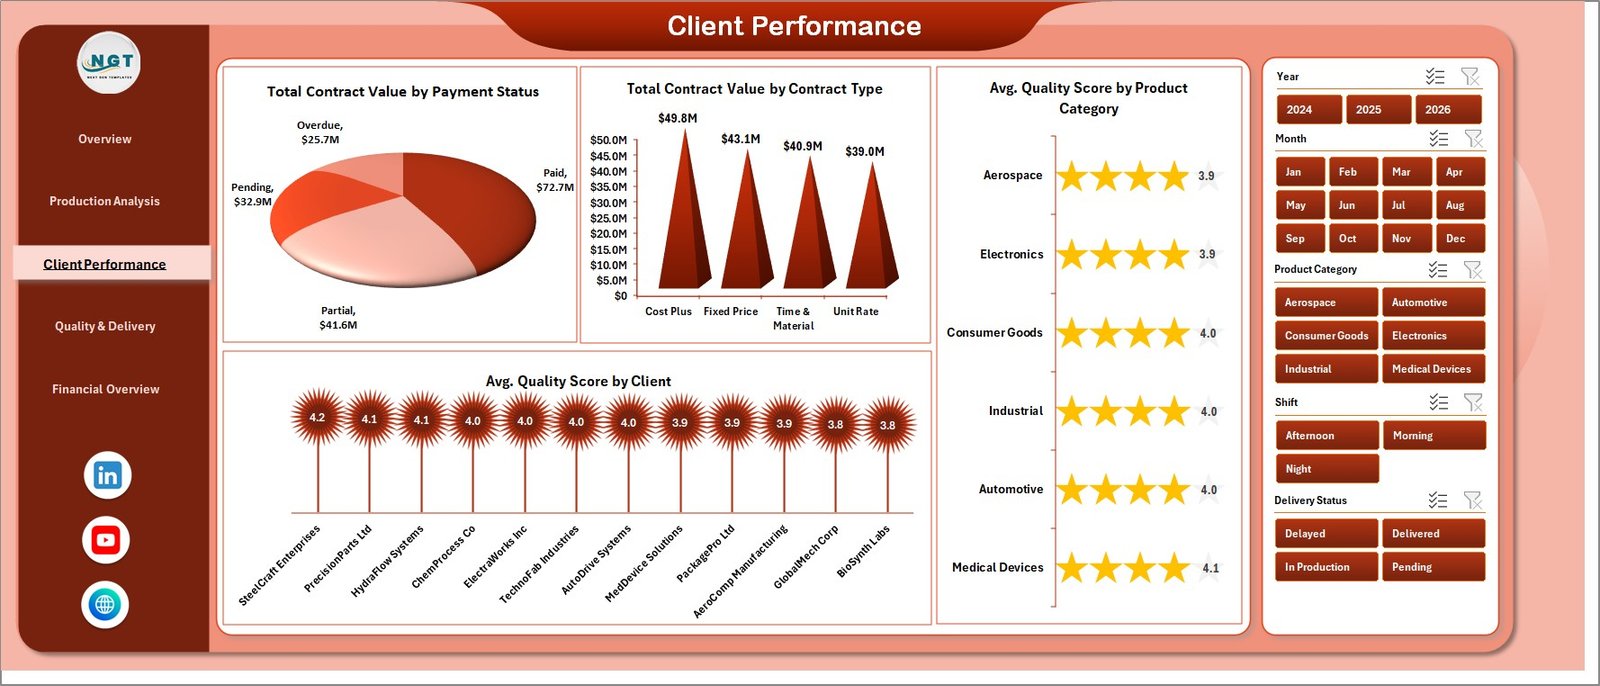
Client Performance
💳 Total Contract Value by Payment Status · 📝 Total Contract Value by Contract Type · 🎯 Avg. Quality Score by Product Category · ⭐ Avg. Quality Score by Client.
4. Quality & Delivery
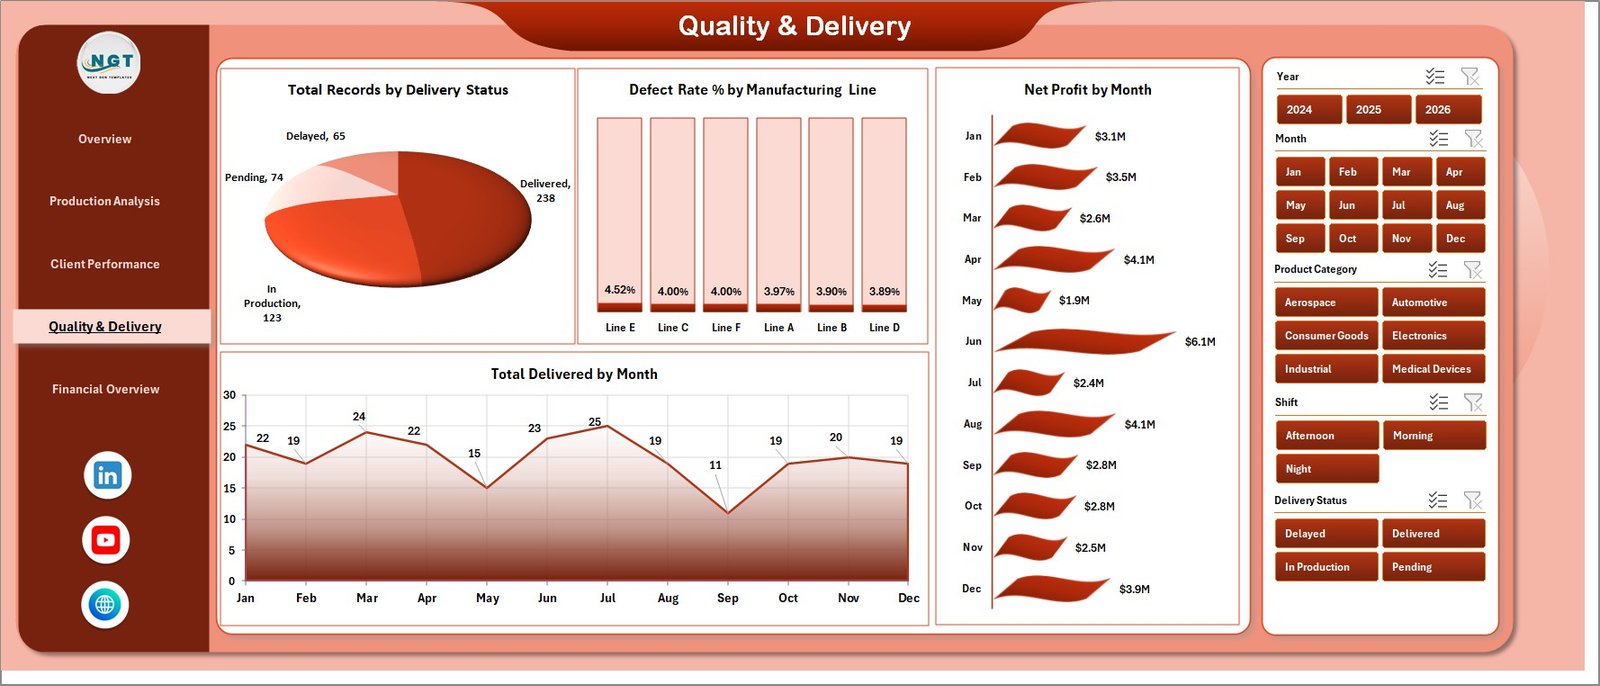
Quality & Delivery
🚚 Total Records by Delivery Status · ❌ Defect Rate % by Manufacturing Line · 📈 Net Profit by Month · ✅ Total Delivered by Month.
5. Financial Overview
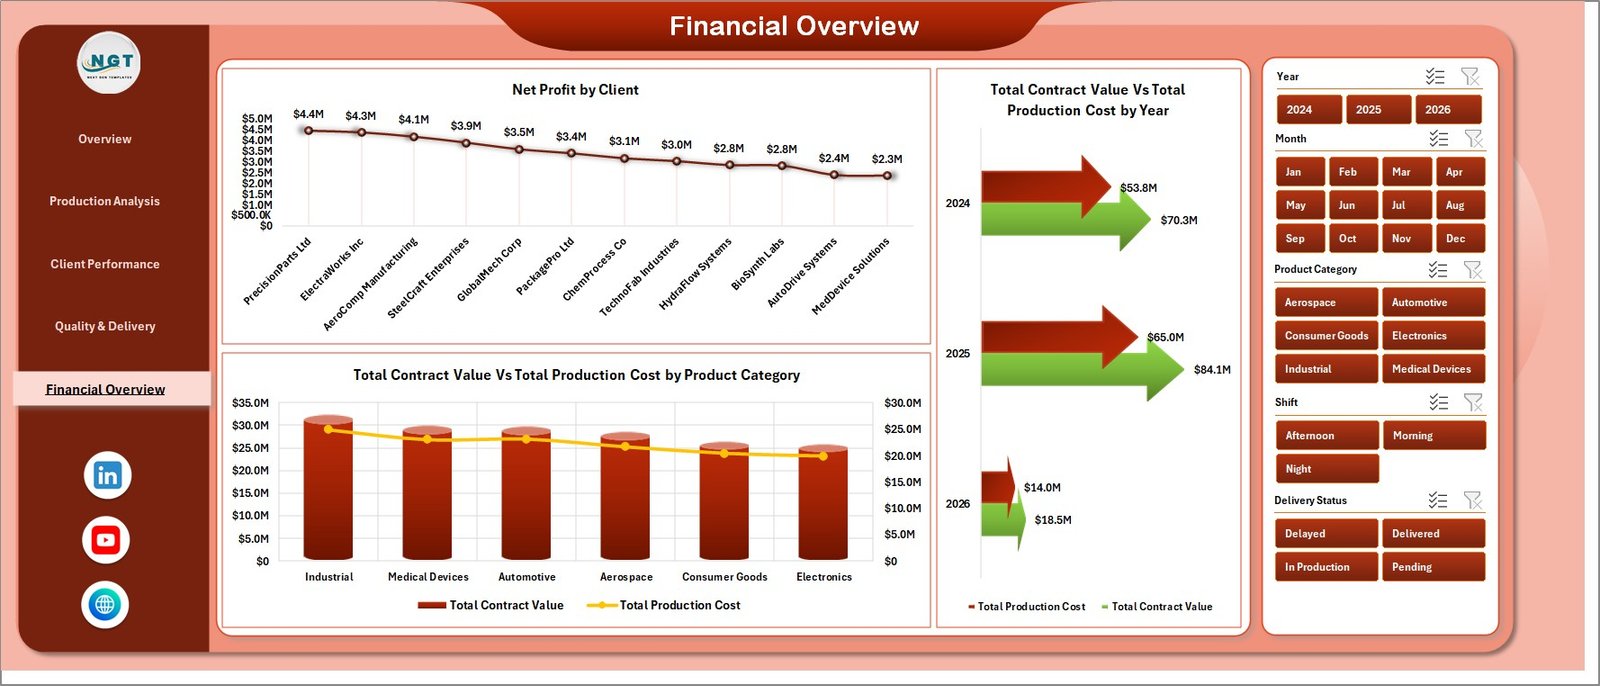
Financial Overview
💰 Net Profit by Client · 📊 Total Contract Value Vs Total Production Cost by Year · 🏷️ Total Contract Value Vs Total Production Cost by Product Category.
6. Data Sheet
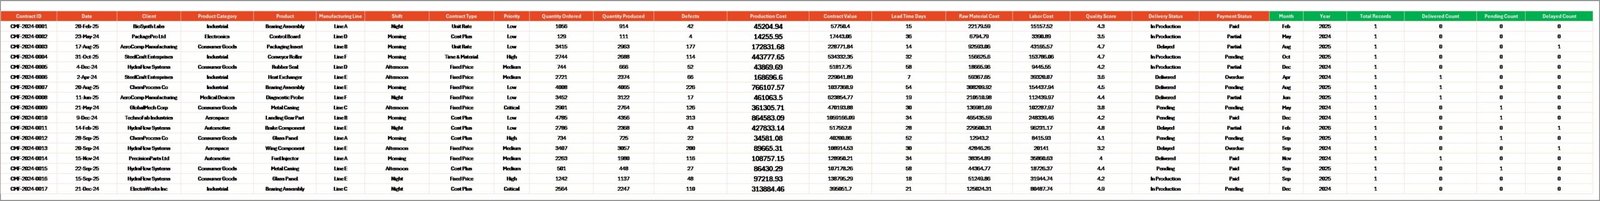
Data Sheet tab
This is the input layer. Replace sample records with your production orders in the same column structure — Contract Value, Production Cost, Qty Produced, Defects, Quality Score, Client, Shift, Line, Payment Status, and more.
7. Support Sheet
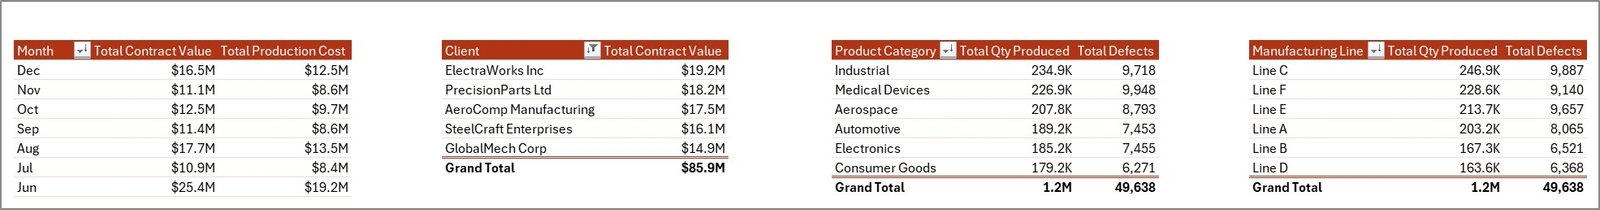
Support sheet tab
Hidden pivot engine. Every chart on every page pulls from the pivot tables here. Use Data → Refresh All after updating the Data sheet and the whole dashboard refreshes. Keep this sheet hidden in production.
📊 Contract Manufacturing Dashboard in Excel vs. Google Sheets Equivalent vs. Paid Manufacturing SaaS — Where This Fits
| Feature | Contract Manufacturing Dashboard in Excel | Google Sheets Equivalent | Katana / MRPeasy / Fishbowl |
|---|---|---|---|
| Cost | $17.99 one-time | $15-20 one-time | $99-450 / user / month |
| Platform | Microsoft Excel (offline) | Google Sheets (cloud) | Cloud SaaS |
| Setup time | Under 10 minutes | Under 10 minutes | 2-6 weeks onboarding |
| Multi-slicer filtering | ✅ Yes — every page | Limited (slicer only on pivot) | ✅ Yes |
| Offline access | ✅ Yes | ❌ No | ❌ No |
| Custom fields / columns | ✅ Fully editable | ✅ Fully editable | Limited by plan |
| Client / login restrictions | ✅ None | Google account needed | Per-user licensing |
| Year-1 cost at 5 users | $17.99 | $15-20 | $5,940 – $27,000 |
| Defect Rate & Quality tracking | ✅ Built-in | ✅ Built-in | ✅ Yes |
For contract manufacturers and OEM partners that want enterprise-grade KPI visibility without paying Katana or MRPeasy subscription fees, the Contract Manufacturing Dashboard in Excel sits in the sweet spot.
👥 Who This Template Is For — and Who It’s Not For
✅ This template is built for:
- Contract manufacturers and OEM partners producing for 3-50 client accounts
- Plant managers tracking daily production, quality, and client profitability
- Operations leaders who want one-time-purchase analytics instead of per-seat SaaS
- Finance teams in mid-size manufacturing firms reconciling contract value vs. production cost
- Consultants building monthly KPI reports for manufacturing clients
❌ This template is NOT for:
- Enterprise manufacturers needing real-time MES integration or SCADA feeds
- Teams requiring multi-user concurrent editing (use Google Sheets equivalent instead)
- Plants running millions of records per month — Excel’s row limit becomes a bottleneck
⚙️ How to Use the Contract Manufacturing Dashboard in Excel
- Download and open the file in Microsoft Excel 2016 or later.
- Go to the Data sheet and replace the sample records with your own production orders — keep the column structure intact.
- Click Data → Refresh All on the Excel ribbon. Every pivot table on the Support sheet refreshes, and all dashboard charts update automatically.
- Use the slicers on any page to filter by Client, Product Category, Shift, or Manufacturing Line — the entire page reflows.
- Keep the Support sheet hidden in production so end users only see the polished analysis pages.
💼 Real-World Use Cases
Raj runs a contract electronics assembly plant outside Pune with 12 OEM clients. He uses the Contract Manufacturing Dashboard in Excel to track monthly contract value per client, monitor defect rates by line, and flag clients whose production cost is creeping above contract value — all without paying ₹40,000/month for a Katana subscription.
Maria manages contract packaging for a food manufacturer in São Paulo. She updates the Data sheet weekly with production orders from SAP exports, refreshes the dashboard, and presents the Quality & Delivery page to leadership every Monday morning.
David is a fractional COO advising three mid-size contract manufacturers. He uses the same template across all three clients, customizing slicers per client portfolio — one Excel file replaces three separate paid MRP subscriptions.
❓ Frequently Asked Questions
What KPIs does the Contract Manufacturing Dashboard in Excel track?
The Contract Manufacturing Dashboard in Excel tracks 5 headline KPIs — Total Contract Value, Total Production Cost, Total Qty Produced, Avg. Quality Score, and Total Records — alongside Defect Rate %, Net Profit, and Delivery Status across 5 interactive analysis pages.
How long does setup take?
Setup takes under 10 minutes. Replace the sample rows in the Data sheet with your production records, click Data → Refresh All on the Excel ribbon, and every chart and slicer across the 5 dashboard pages updates automatically.
How does this compare to Katana or MRPeasy?
Katana and MRPeasy run $99-450 per user per month and require 2-6 weeks of onboarding. The Contract Manufacturing Dashboard in Excel is a $17.99 one-time purchase with no per-user licensing, no cloud dependency, and full offline access.
Can I customize the charts and add new clients or manufacturing lines?
Yes. All charts are driven by pivot tables on a hidden Support sheet. Add new clients, product categories, or manufacturing lines in the Data sheet, refresh the pivots, and slicers update automatically — no VBA or formula editing needed.
Does it work on Mac and Excel Online?
The Contract Manufacturing Dashboard in Excel runs on Excel 2016+ for Windows and Mac. Slicers and pivot tables also work in Excel Online, though refreshing large pivots is faster in the desktop version.
Is this a subscription or one-time purchase?
One-time purchase — $17.99 today, yours forever. No subscription, no per-user fees, no auto-renewal. Download the file, use it across unlimited projects, and pass it to your team.
👤 About the Author
Built by PK — Microsoft Certified Professional with 15+ years of Excel, Google Sheets, and Power BI experience. Founder of NextGenTemplates, reaching 300K+ subscribers across YouTube channels (@PK-AnExcelExpert, @NextGenTemplates, @NeoTechNavigators). Every template is hand-built and tested before release.
🔗 Explore Related Templates
💎 Save 40% — Get the Manufacturing Excellence Bundle — 8 premium Excel + Power BI manufacturing templates in one pack.
🔩 Automotive Parts Manufacturing Dashboard in Excel — tailored for tier-1 and tier-2 auto suppliers.
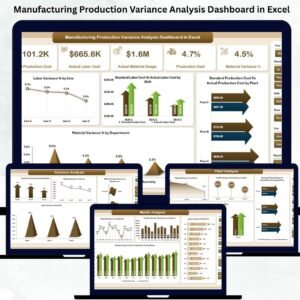
🏭 Manufacturing Production Variance Analysis Dashboard in Excel — drill into budget vs. actual production variance.
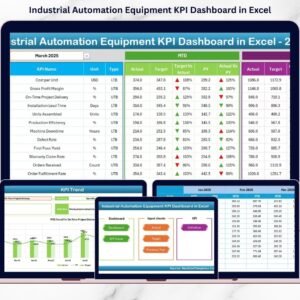
⚙️ Industrial Automation Equipment KPI Dashboard in Excel — for equipment and line-level monitoring.
Browse all Excel Dashboard Templates or the full Manufacturing Template Library.
📖 Click here to read the Detailed Blog Post
🎥 Visit our YouTube channel for step-by-step video tutorials
👉 YouTube.com/@NextGenTemplates
📅 Last updated: April 2026
Watch the step-by-step video tutorial:


Reviews
There are no reviews yet.