

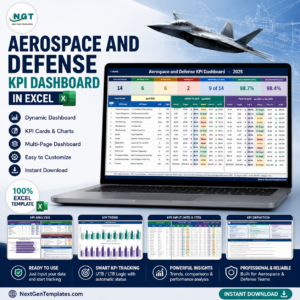
The Aerospace and Defense KPI Dashboard in Excel is a monthly KPI scorecard for programme, production, quality, supply chain and sustainment reporting. It ships with 14 KPIs across 7 groups, 10 worksheets, capacity for 22 KPIs before any formula edit, and 36 months of input cells (this year, target and prior year). Every figure is a plain worksheet formula – no macros, no Power Query, no data model, no add-in – so it opens in Excel 2013 and later and in Excel for the web. Instant download, lifetime access to the file you buy, and nothing in the workbook is locked or hidden. All numbers shipped inside are demo data you replace with your own.
This is the scorecard, not the analytics dashboard. NextGenTemplates sells two different aerospace and defense products and they are easy to confuse. This one is a month-picker scorecard: one row per KPI, actual against target, a traffic light, and a trend page. If you want slicer-driven charts over a transaction table instead, that is the Aerospace and Defence Dashboard in Excel or its Power BI version. Different template, different job.
Key Features of the Aerospace and Defense KPI Dashboard in Excel
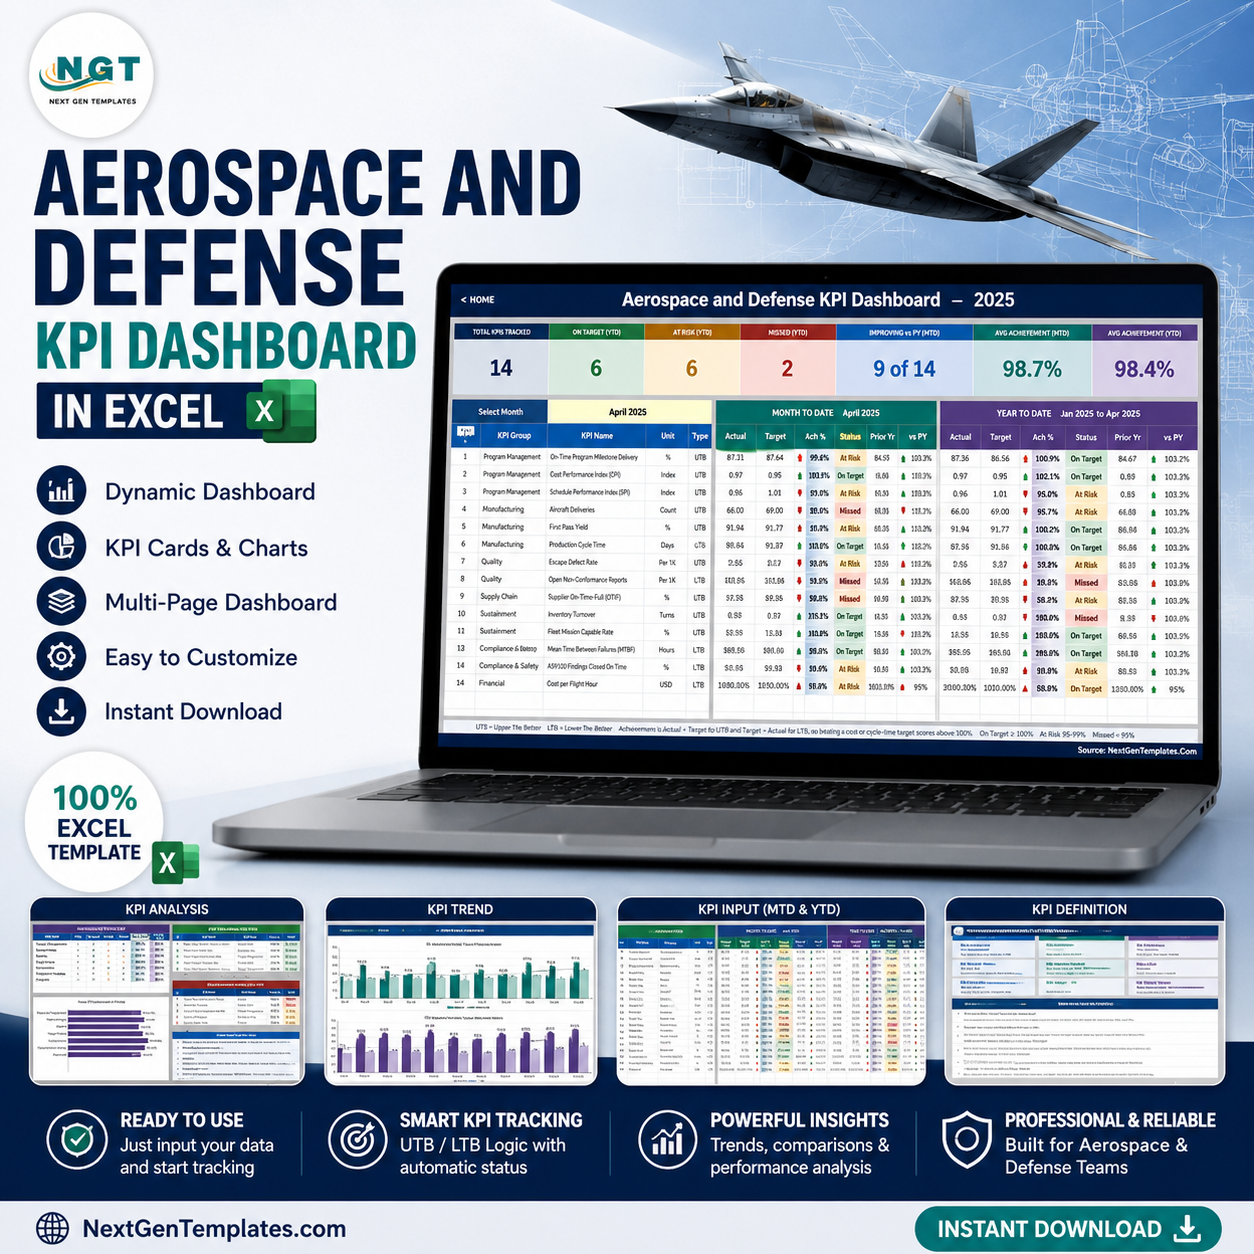
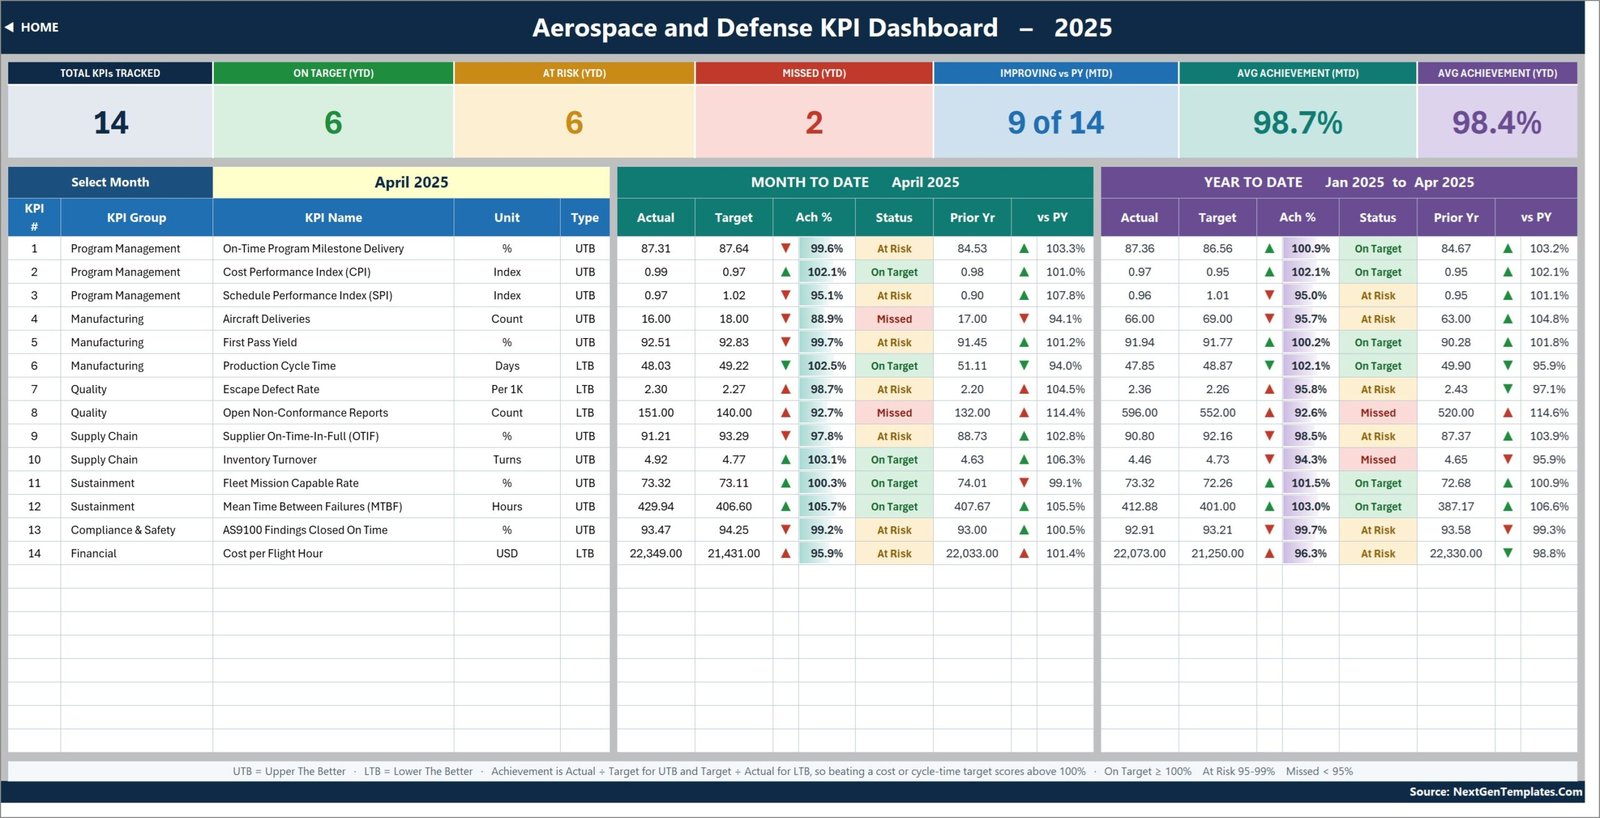
- One dropdown drives the whole scorecard. Cell D6 on KPI Dashboard lists the twelve months of the reporting year. Change it and the MTD block, the YTD block, all seven summary cards and the entire KPI Analysis page follow.
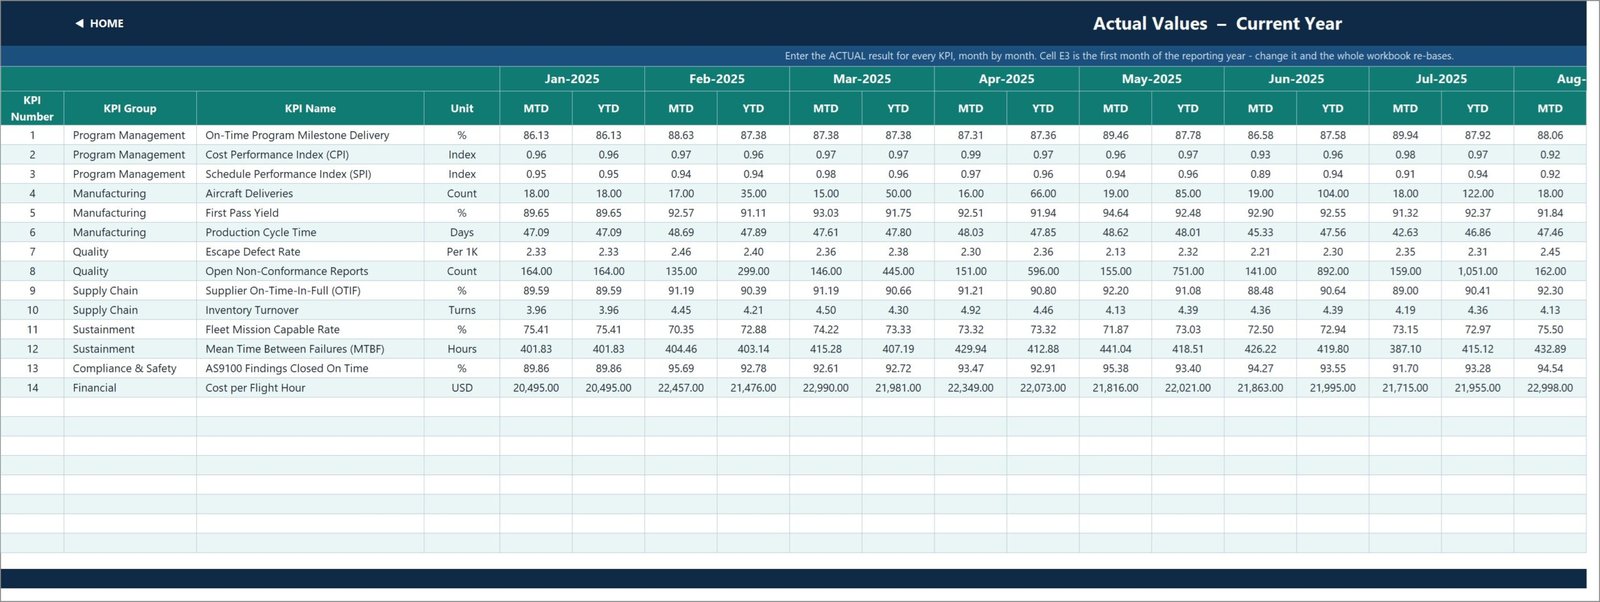
- MTD and YTD are both stored, not derived. Each input sheet holds a month-to-date and a year-to-date column per month, so you keep control of how your own YTD is defined – cumulative for counts, running average for rates.
- Direction-aware achievement. Each KPI is flagged UTB (upper the better) or LTB (lower the better). Achievement is Actual / Target for UTB and Target / Actual for LTB, so beating a cost or cycle-time target scores above 100% rather than looking like a miss.
- Editable traffic-light thresholds. On Target from 100%, At Risk 95% to 99%, Missed below 95%. The thresholds sit in the formulas in columns L and U on KPI Dashboard – change them to match your own governance.
- Colour-aware arrows. The arrow shows raw direction against the comparator; its colour shows whether that direction is good for that KPI, which is why a falling cost shows a green down-arrow.
- Seven summary cards across the top: Total KPIs Tracked, On Target (YTD), At Risk (YTD), Missed (YTD), Improving vs PY (MTD), Avg Achievement (MTD) and Avg Achievement (YTD).
- Add, rename or remove a KPI from one sheet. Type it on KPI Definition and it flows to the three input sheets, the scorecard, the trend page and the analysis page. No formula edits at all.
What’s Inside the Aerospace and Defense KPI Dashboard in Excel
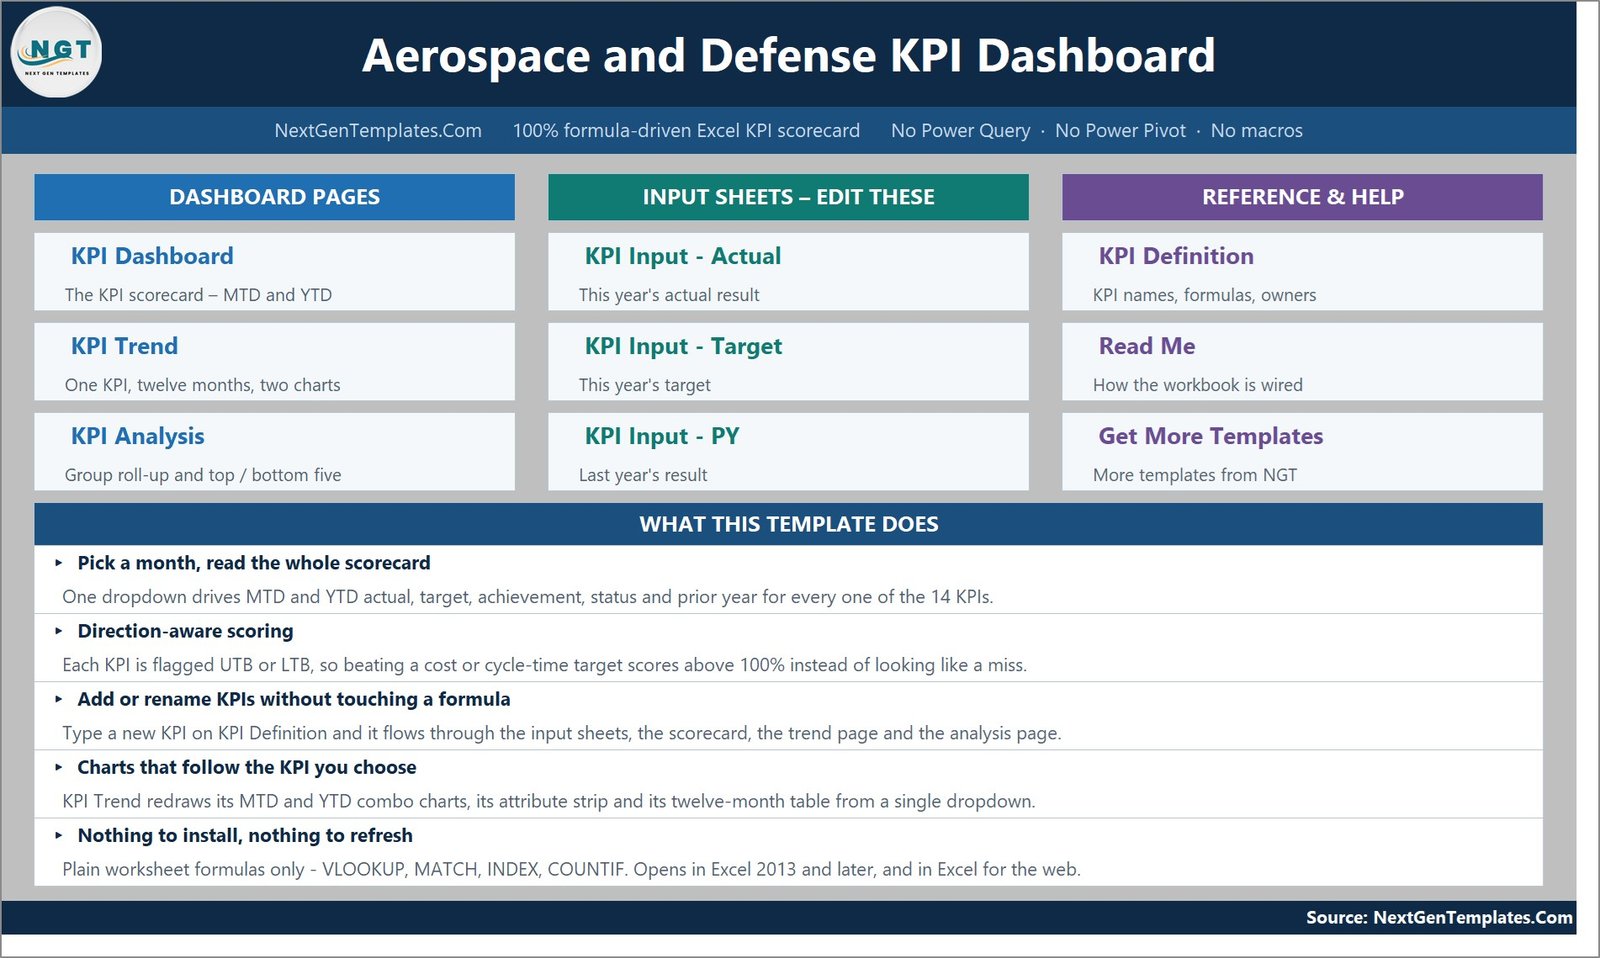
Ten worksheets, grouped into three dashboard pages, three input sheets you type into, and four reference sheets.
KPI Dashboard – the scorecard
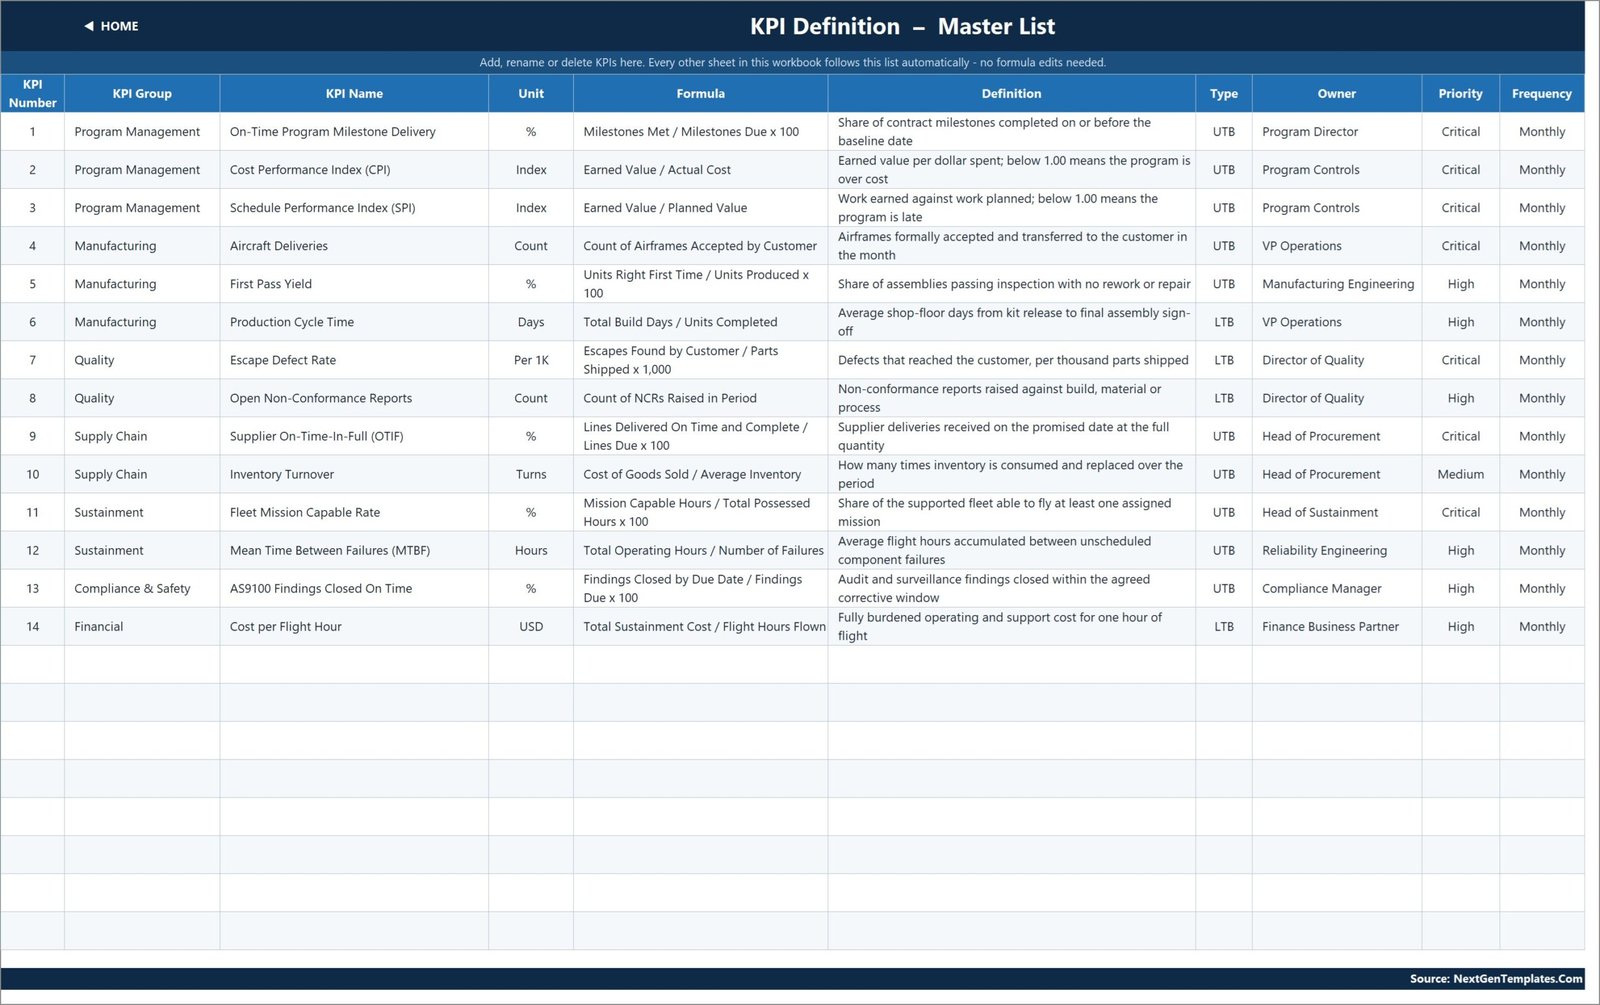
One row per KPI with MTD and YTD actual, target, achievement %, status, prior year and vs PY. The 14 KPIs shipped are On-Time Program Milestone Delivery, Cost Performance Index (CPI), Schedule Performance Index (SPI), Aircraft Deliveries, First Pass Yield, Production Cycle Time, Escape Defect Rate, Open Non-Conformance Reports, Supplier On-Time-In-Full (OTIF), Inventory Turnover, Fleet Mission Capable Rate, Mean Time Between Failures (MTBF), AS9100 Findings Closed On Time, and Cost per Flight Hour. Every one of them is a label and a number you own – rename any of them on KPI Definition.
KPI Trend – one KPI, twelve months
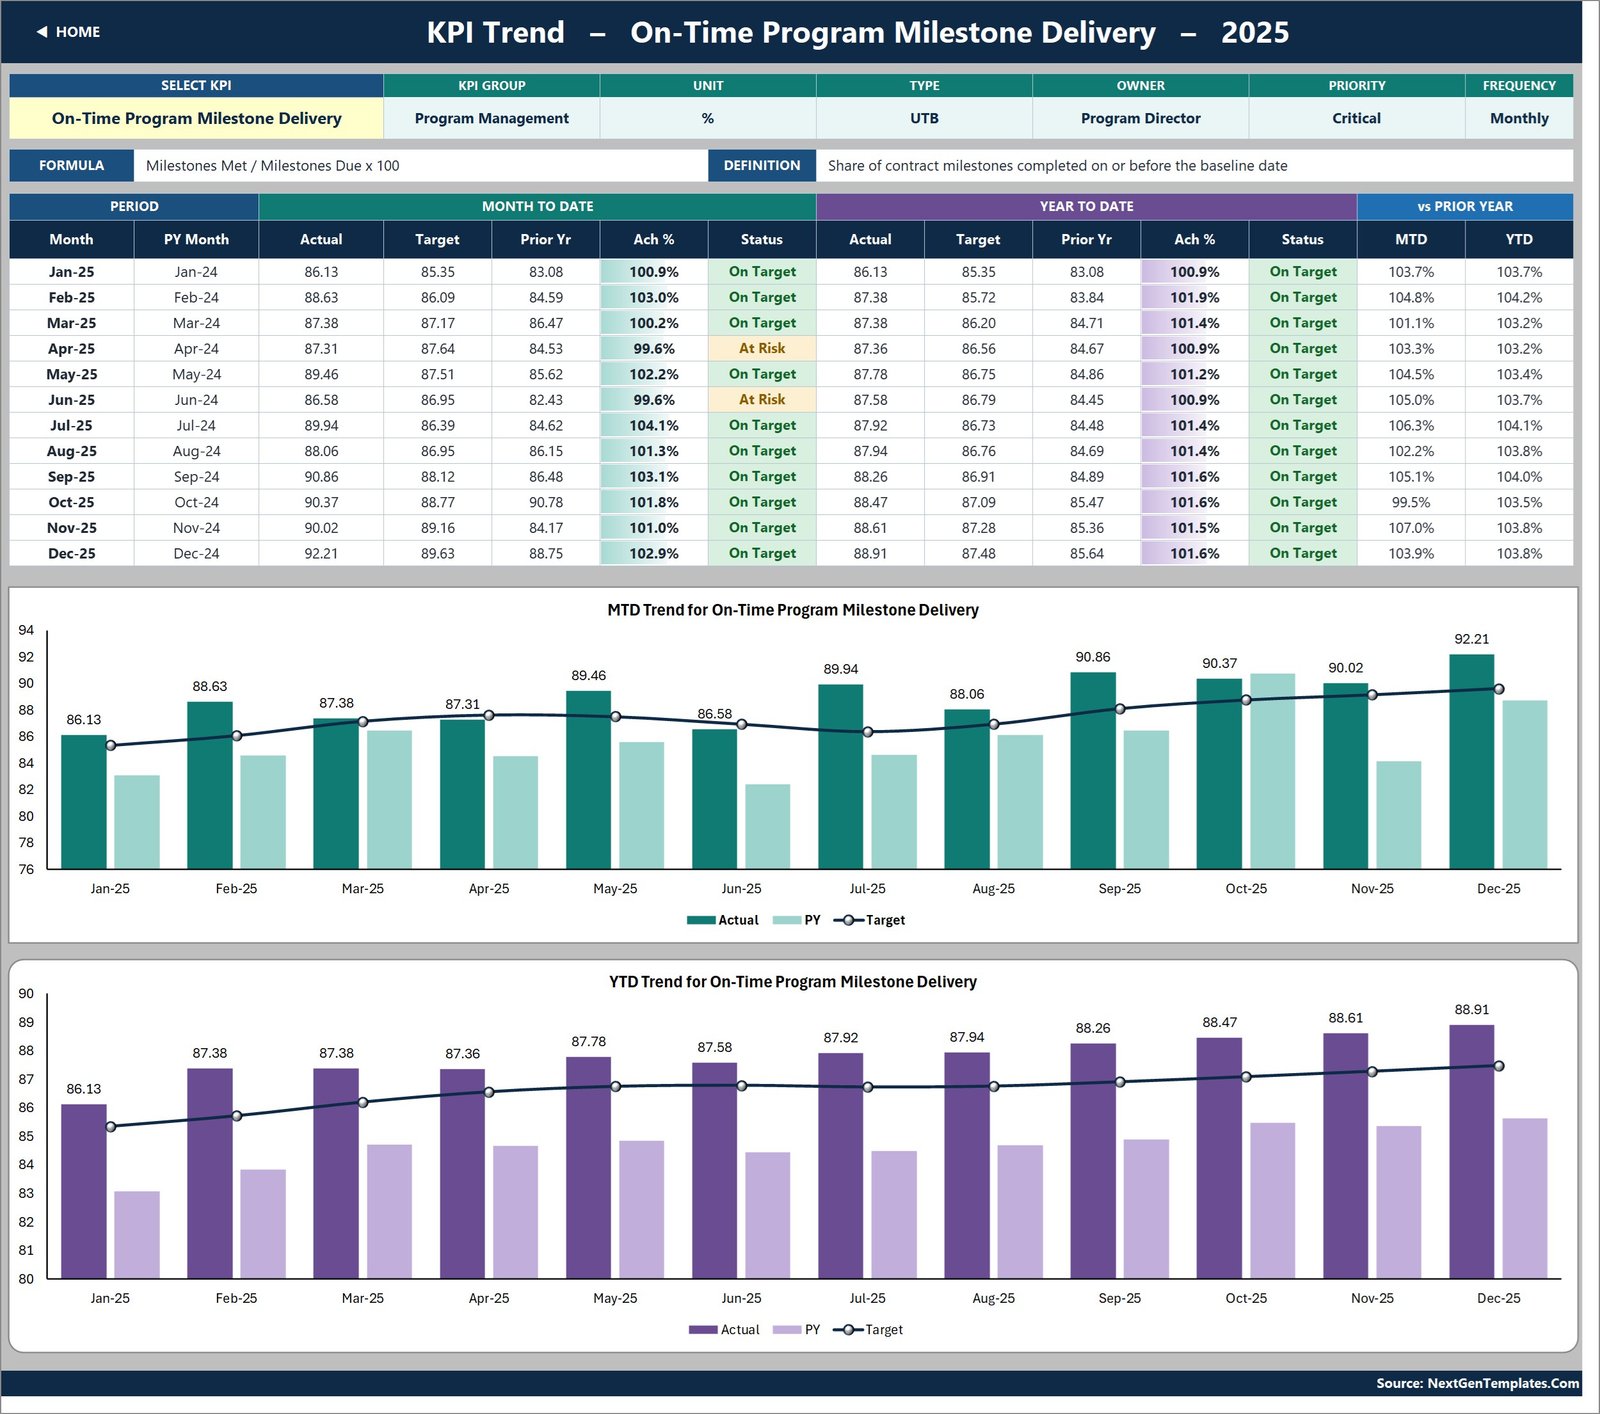
Pick any KPI in cell B4 and the attribute strip (group, unit, type, owner, priority, frequency), its formula and definition, a twelve-month table and two combo charts all redraw. The charts are titled MTD Trend for [selected KPI] and YTD Trend for [selected KPI], each plotting actual and prior-year columns against a target line.
KPI Analysis – group roll-up and rankings
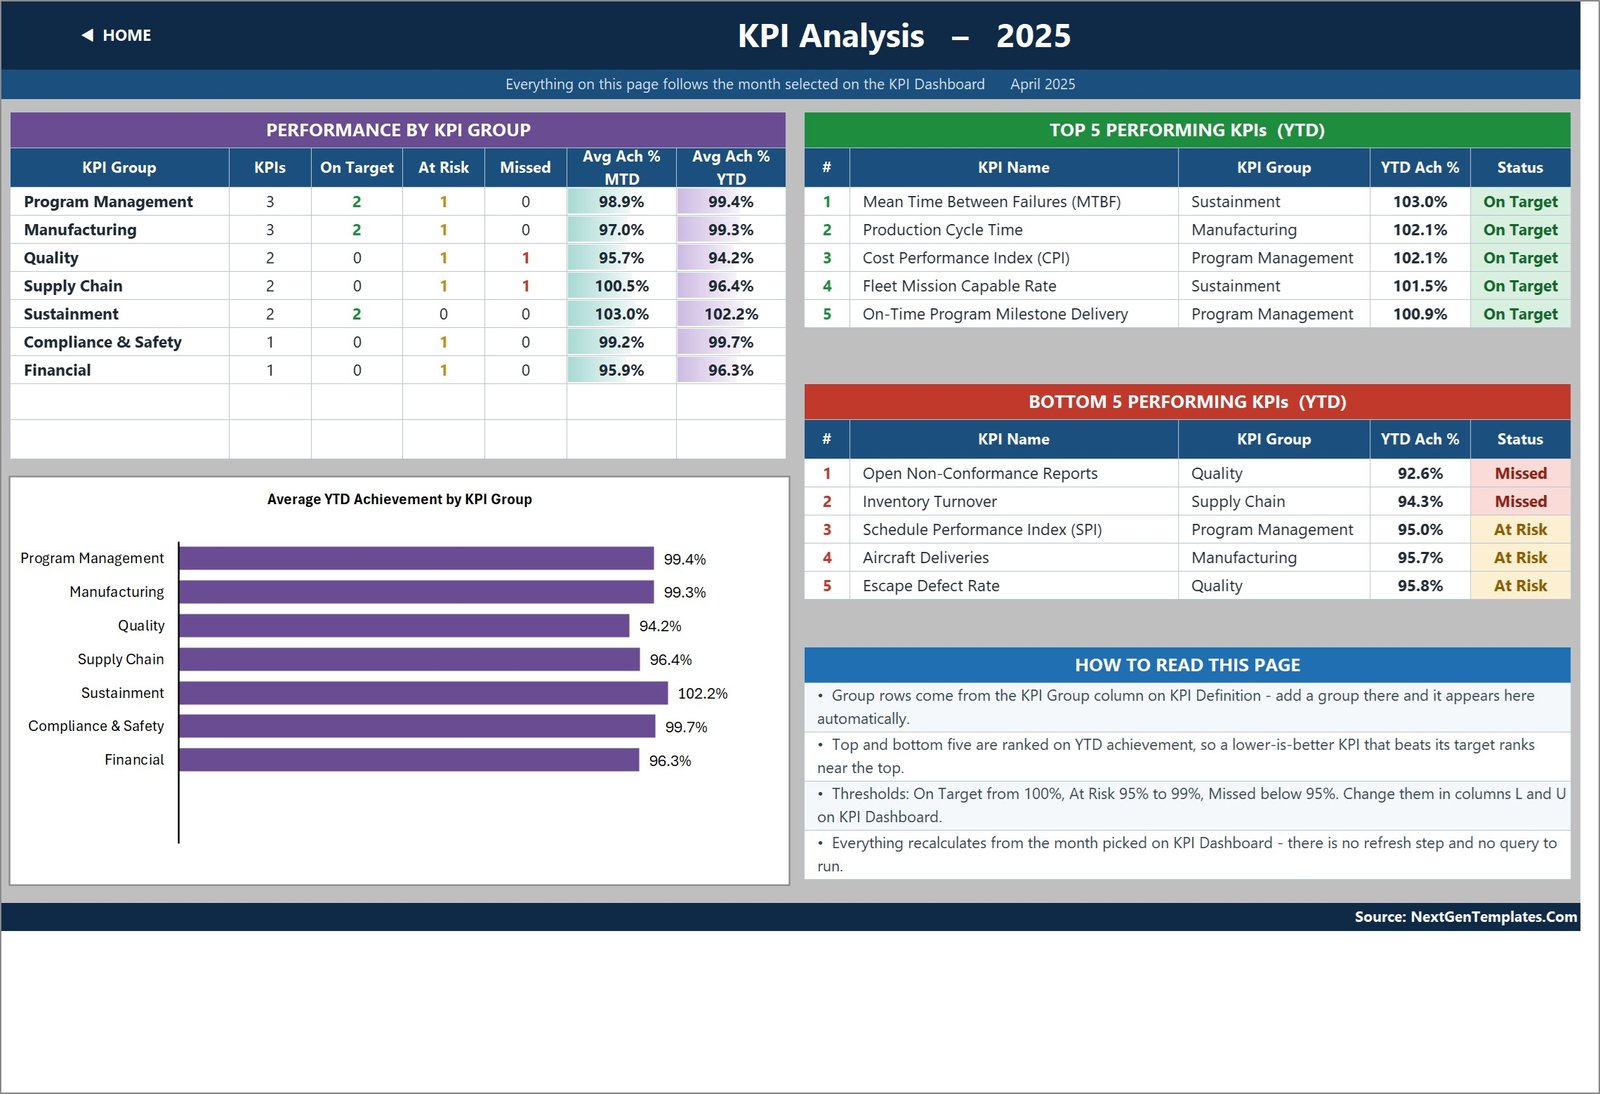
Performance by KPI Group counts how many KPIs in each group are On Target, At Risk and Missed and averages their MTD and YTD achievement. A bar chart of Average YTD Achievement by KPI Group sits below it, and two ranked tables list the Top 5 and Bottom 5 Performing KPIs for the year to date. Because ranking is on achievement, a lower-is-better KPI that beats its target ranks near the top.
The three input sheets and four reference sheets
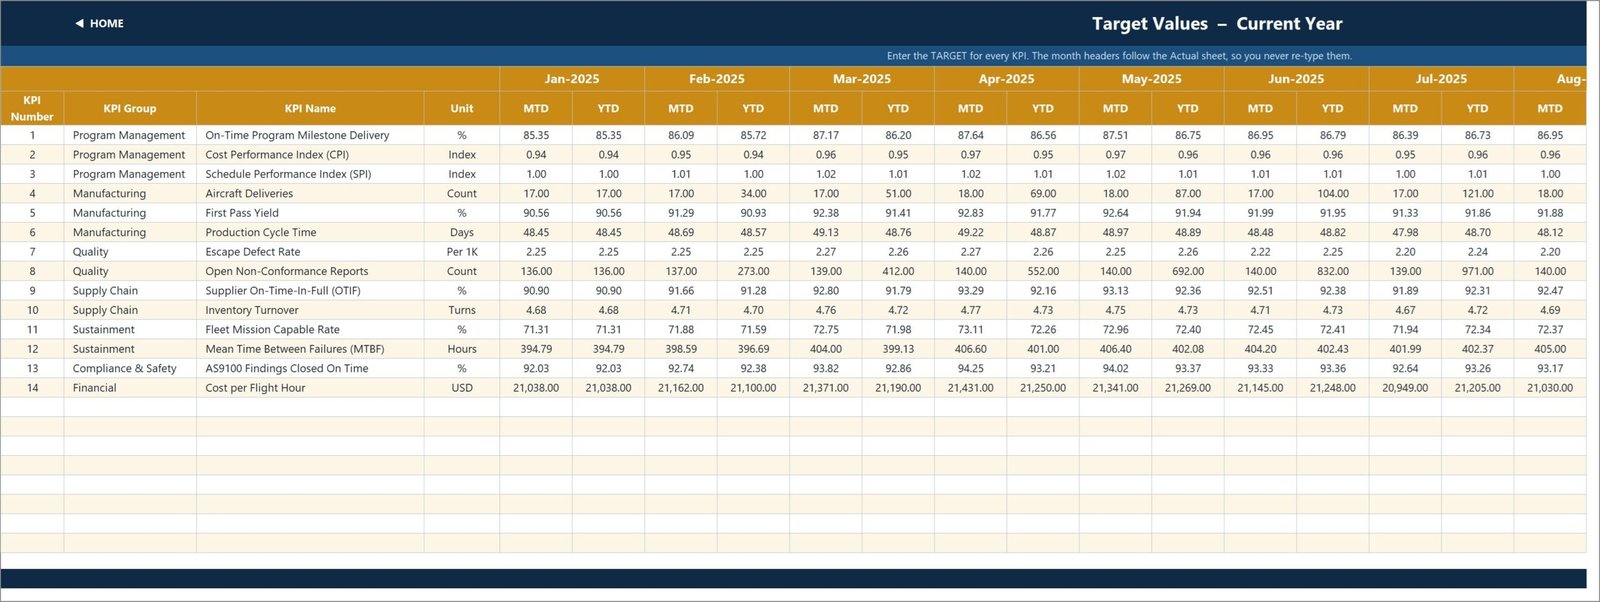
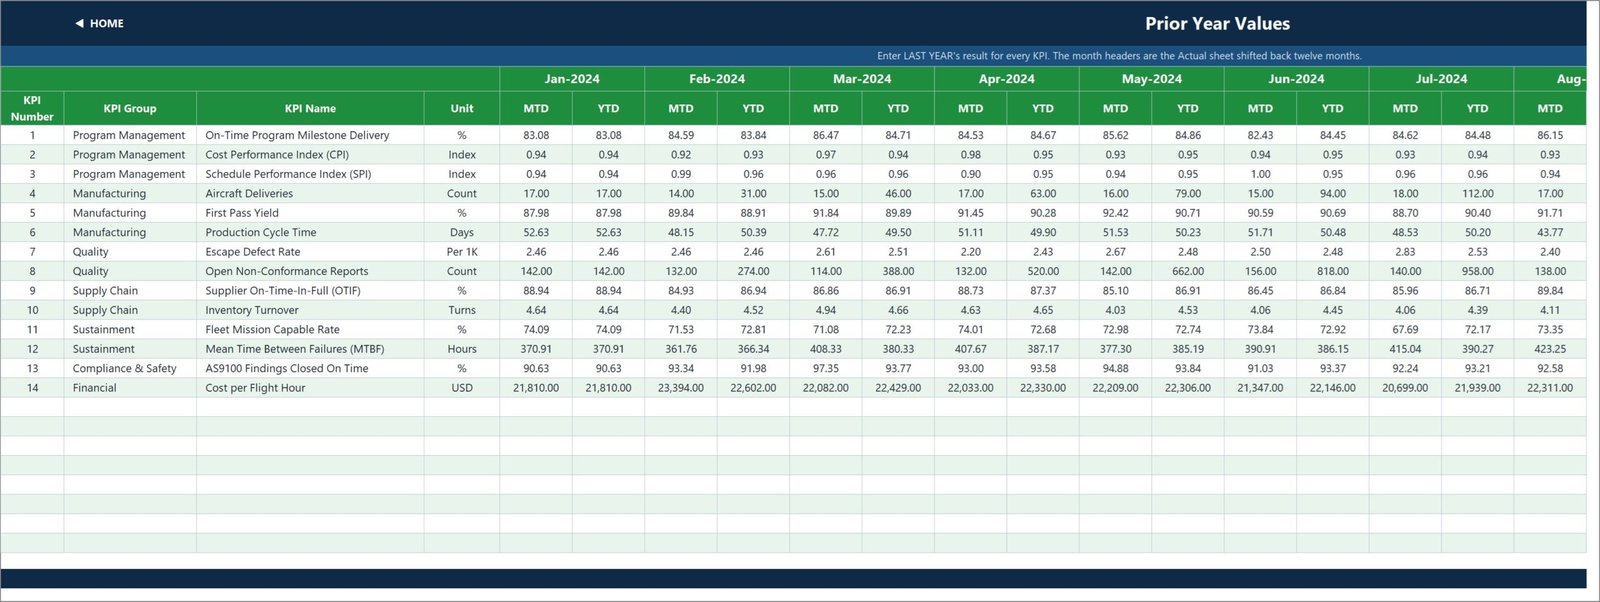
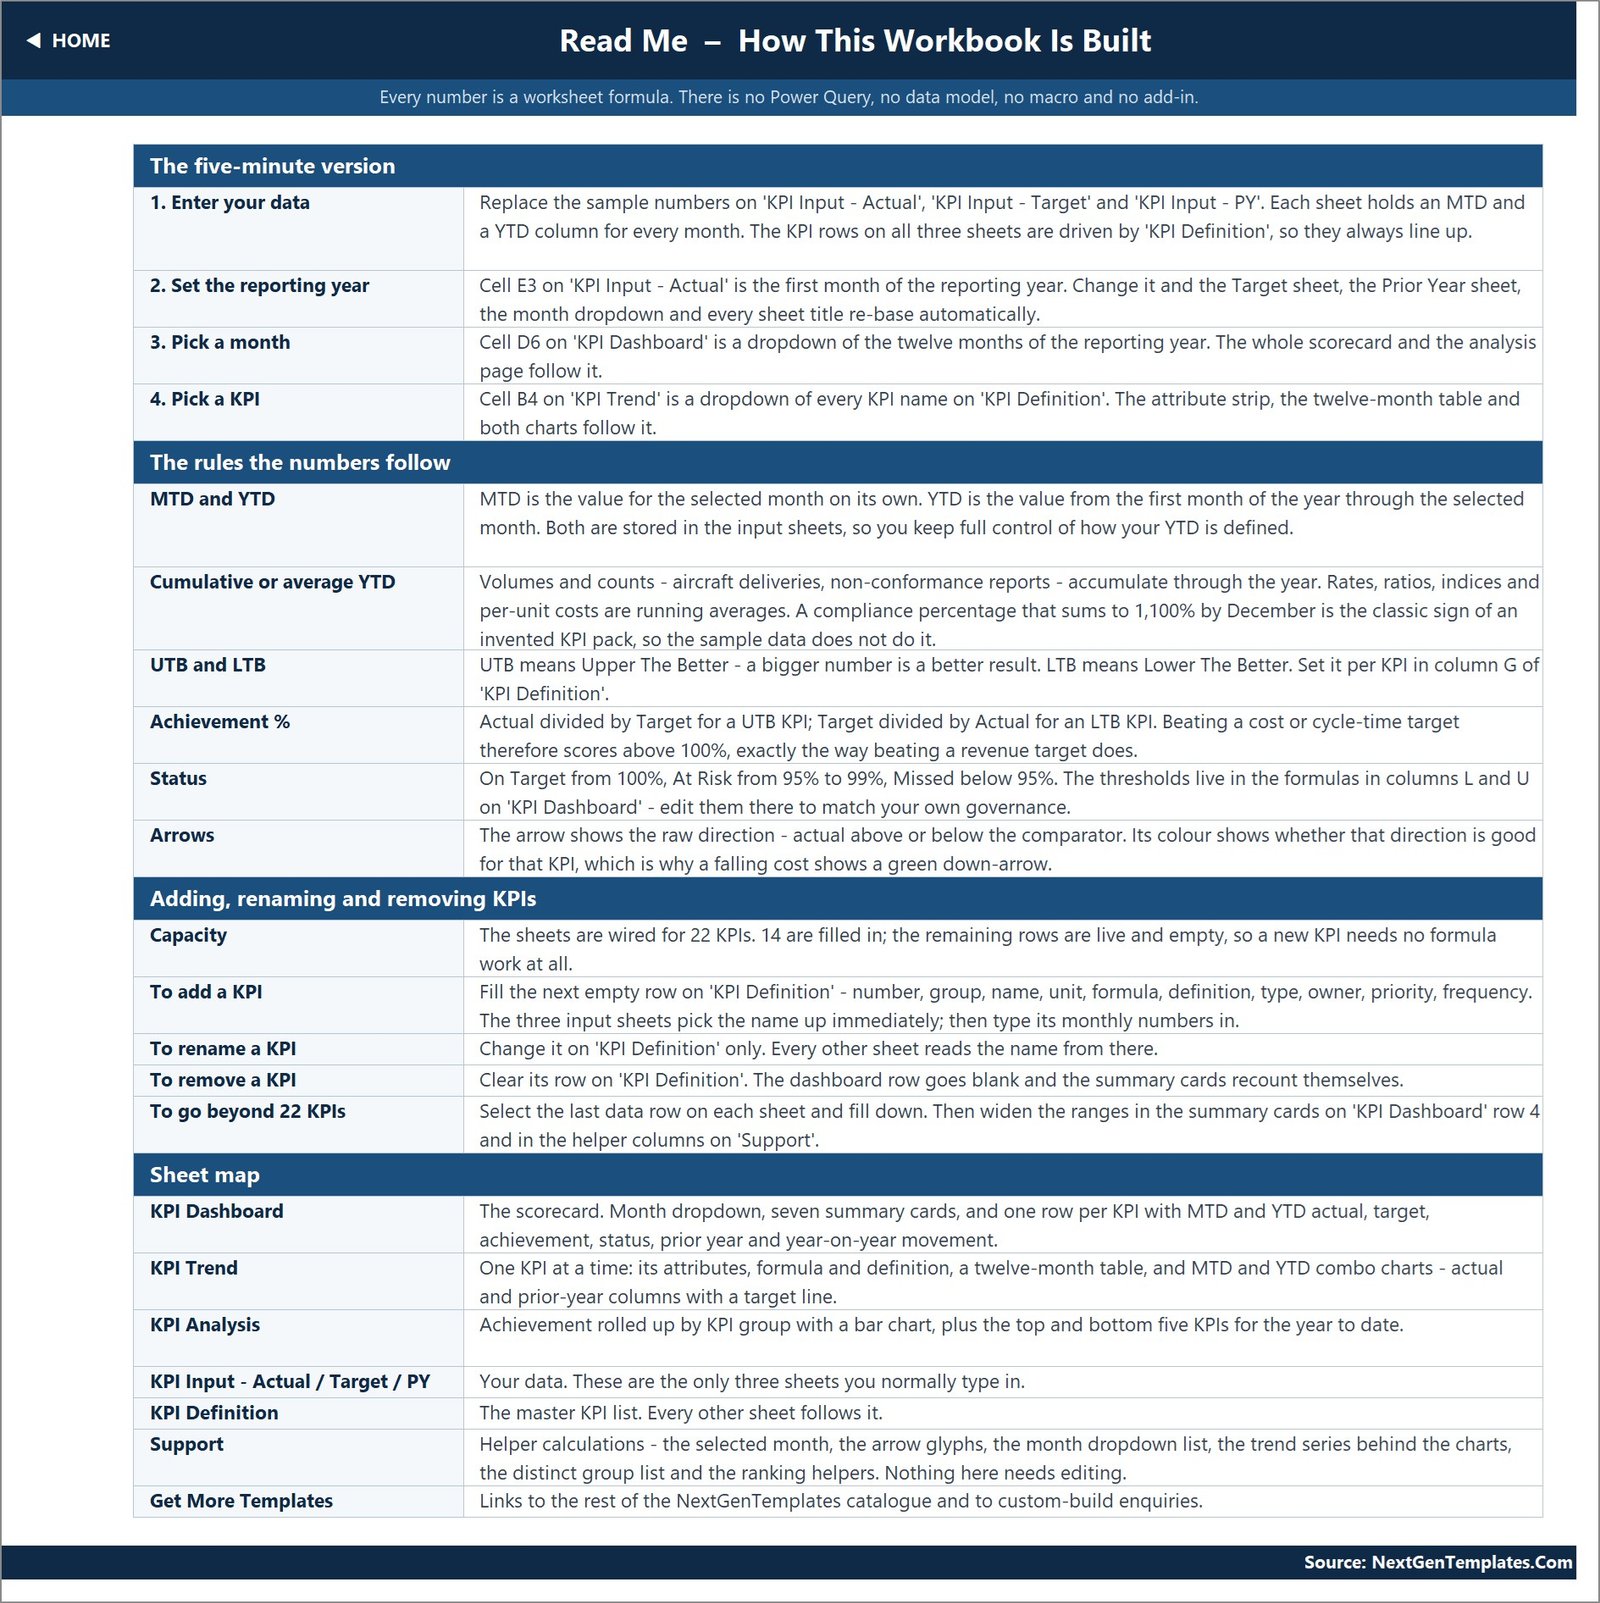
KPI Input – Actual, KPI Input – Target and KPI Input – PY are the only sheets you normally type in; cell E3 on the Actual sheet sets the first month of the reporting year and every other sheet re-bases from it. KPI Definition is the master list – number, group, name, unit, formula, definition, type, owner, priority, frequency. Read Me explains the wiring, Support holds the helper calculations, and Get More Templates links back to the catalogue.
Excel KPI Scorecard vs. Google Sheets vs. Paid Reporting SaaS – Where This Fits
| This template (Excel) | Google Sheets KPI scorecard | Paid reporting SaaS | |
|---|---|---|---|
| Cost | One-time 12.99 | One-time, similar | Typically 20-75 per user, per month |
| Platform | Excel 2013+, Excel for the web | Browser only | Browser plus connectors |
| Setup time | Under an hour – type numbers into three sheets | Similar | Days to weeks, usually with an implementation call |
| Real-time team collaboration | Via OneDrive or SharePoint co-authoring | Native | Native |
| Mobile access | Excel mobile app | Sheets mobile app | Native app |
| Customizable fields | Every cell – nothing locked or hidden | Every cell | Within the vendor’s data model |
| Share with link | Yes, via OneDrive | Yes | Yes, seat-based |
| Year-1 cost at 5 users | 12.99 total | Similar | 1,200 – 4,500 |
| Direction-aware (UTB / LTB) scoring | Built in, per KPI | Built in on the Sheets twin | Usually needs a custom calculation |
| Works offline | Yes | No | No |
Who This Template Is For – and Who It’s Not For
It is for programme managers, production and operations leads, quality managers, procurement and sustainment teams at aerospace or defense suppliers, MRO shops and component manufacturers who already hold their own numbers and want one monthly page that shows actual against target with a trend behind it. It suits a monthly management review, a supplier or programme review pack, and anyone replacing a hand-formatted status slide.
It is not for the following, and buying it will not help with any of them. It is not airworthiness, flight-safety, maintenance-record or configuration-management software. It is not a certification, accreditation, audit or quality-management system, and it does not produce evidence that any auditor, customer or authority will accept. It is not export-control or trade-compliance software – do not use it for ITAR, EAR or any other controlled-data workflow. It is not for classified, controlled-unclassified or otherwise restricted information, and it is not a tool for managing weapons, munitions or ordnance. It is also not a transaction-level analytics dashboard, not a live data connector, and not a substitute for your ERP or MES.
One shipped KPI is labelled AS9100 Findings Closed On Time. That is a sample row name, and the value under it is a percentage somebody types in. It records nothing, proves nothing and confers no standing under any standard – rename it on KPI Definition if the label is unhelpful in your organisation.
How to Use the Aerospace and Defense KPI Dashboard in Excel
- Unzip and open the .xlsx. Excel 2013 or later, or Excel for the web. Nothing to enable.
- Read Read Me first. It is a one-page map of how the workbook is wired, including which cells are the control cells.
- Set your reporting year. Cell E3 on KPI Input – Actual is the first month. Change it and the Target sheet, the PY sheet, the month dropdown and every sheet title re-base automatically.
- Edit the KPI list. On KPI Definition, rename, remove or add KPIs. Fill in group, unit, formula, definition, UTB/LTB type, owner, priority and frequency. The sheets are wired for 22 rows.
- Type your numbers. Fill the MTD and YTD columns for each month on KPI Input – Actual, – Target and – PY. Delete the demo figures as you go.
- Pick a month. Use the dropdown on KPI Dashboard. The scorecard and the analysis page follow it. Then pick a KPI on KPI Trend to see its twelve-month behaviour.
- Tune the thresholds. Edit the 100% / 95% cut-offs in the status formulas in columns L and U if your governance uses different bands.
Real-World Use Cases
Priya, programme controls lead at a tier-one structures supplier. She reports CPI and SPI to a monthly programme review. She keeps only the three index KPIs plus On-Time Program Milestone Delivery, types the earned-value outputs from her own system into the Actual and Target sheets, and prints the KPI Dashboard page as the review’s first slide.
Marcus, operations manager at a machined-components plant. He watches First Pass Yield, Production Cycle Time, Escape Defect Rate and Open Non-Conformance Reports. Because Cycle Time and Escape Defects are flagged LTB, a good month scores above 100% and the group roll-up on KPI Analysis reads correctly without him explaining it every time.
Elena, sustainment analyst at an MRO business. She tracks Fleet Mission Capable Rate, MTBF and Cost per Flight Hour for the fleets she supports. The KPI Trend page’s prior-year columns are what she uses to show whether this year’s cost per flight hour is genuinely improving or just seasonal.
Frequently Asked Questions
Does this template make my programme compliant, or is it airworthiness or export-control software?
No. To all of it. This is a spreadsheet that displays numbers you type into it. It is not airworthiness or flight-safety software, it does not create or evidence certification or accreditation of any kind, it is not an audit or quality-management system, it is not export-control or trade-compliance software, and nothing it produces is guaranteed to be accepted by any customer, auditor or authority. Use it as a management reporting view alongside the systems of record you already have to satisfy.
Are the numbers in the file real aerospace or defense data?
No. Every figure in the workbook is invented demo data, put there so you can see the scorecard working before you type anything. Overwrite it. No real company, programme, contract or fleet is represented anywhere in the file.
Do I need Power Query, Power Pivot or macros?
None of them. The workbook is 100% worksheet formulas – VLOOKUP, MATCH, INDEX and COUNTIF. There is no data model, no add-in and no refresh step. It opens in Excel 2013 and later and works in Excel for the web.
Can I change the KPIs to mine?
Yes, and that is the intended workflow. Everything reads from KPI Definition, so renaming a KPI there renames it on the scorecard, the trend page, the analysis page and all three input sheets. The sheets are wired for 22 KPIs and 14 are filled, so eight spare rows are live and empty already.
Why does a lower-is-better KPI show above 100%?
Because achievement is calculated in the direction the KPI actually runs. For a UTB KPI it is Actual / Target; for an LTB KPI such as Production Cycle Time or Cost per Flight Hour it is Target / Actual. Beating a cost target therefore scores above 100%, exactly the way beating a revenue target does.
How is this different from the Aerospace and Defence Dashboard in Excel?
They solve different problems. This is a KPI scorecard – you type in monthly totals and read actual against target with a status light and a trend. The Aerospace and Defence Dashboard in Excel is an analytical dashboard built over a transaction table with pivot-driven charts and slicers. Some teams buy both; most want one or the other.
What exactly do I download?
A ZIP containing the .xlsx workbook and a PDF user manual. There is no installer, no licence key and no account to create.
About the Author
Built by PK – Microsoft Certified Professional with 15+ years of Excel, Google Sheets, and Power BI experience. Founder of NextGenTemplates, reaching 300K+ subscribers across YouTube channels. Every template is hand-built and tested before release.
Explore Related Templates
- Aerospace and Defence KPI Dashboard in Excel – an earlier scorecard on the same subject, with a different KPI set and layout.
- Aerospace KPI Scorecard in Excel – narrower, aerospace only, no defense-programme KPIs.
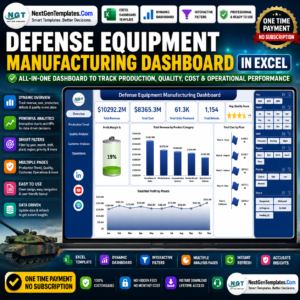
- Defense Equipment Manufacturing Dashboard in Excel – the analytical view of the production side.
- Aerospace and Defense Dashboard in Power BI – same subject, Power BI, transaction-level.
- Aerospace and Defense Dashboard in Google Sheets – browser-based alternative.
- Browse every Excel KPI Dashboard or the wider Excel Dashboard catalogue.
Get the Aerospace and Defense KPI Dashboard in Excel
Add it to your cart for instant download. You get the .xlsx workbook and a PDF user manual in one ZIP, lifetime access to the file, and a workbook with nothing locked, nothing hidden and nothing to install. Need a different KPI set, your own branding, or the same scorecard in Power BI or Google Sheets? Email [email protected] and we will build it around the KPIs you actually report.
Last updated: 17 August 2026.



























Reviews
There are no reviews yet.