

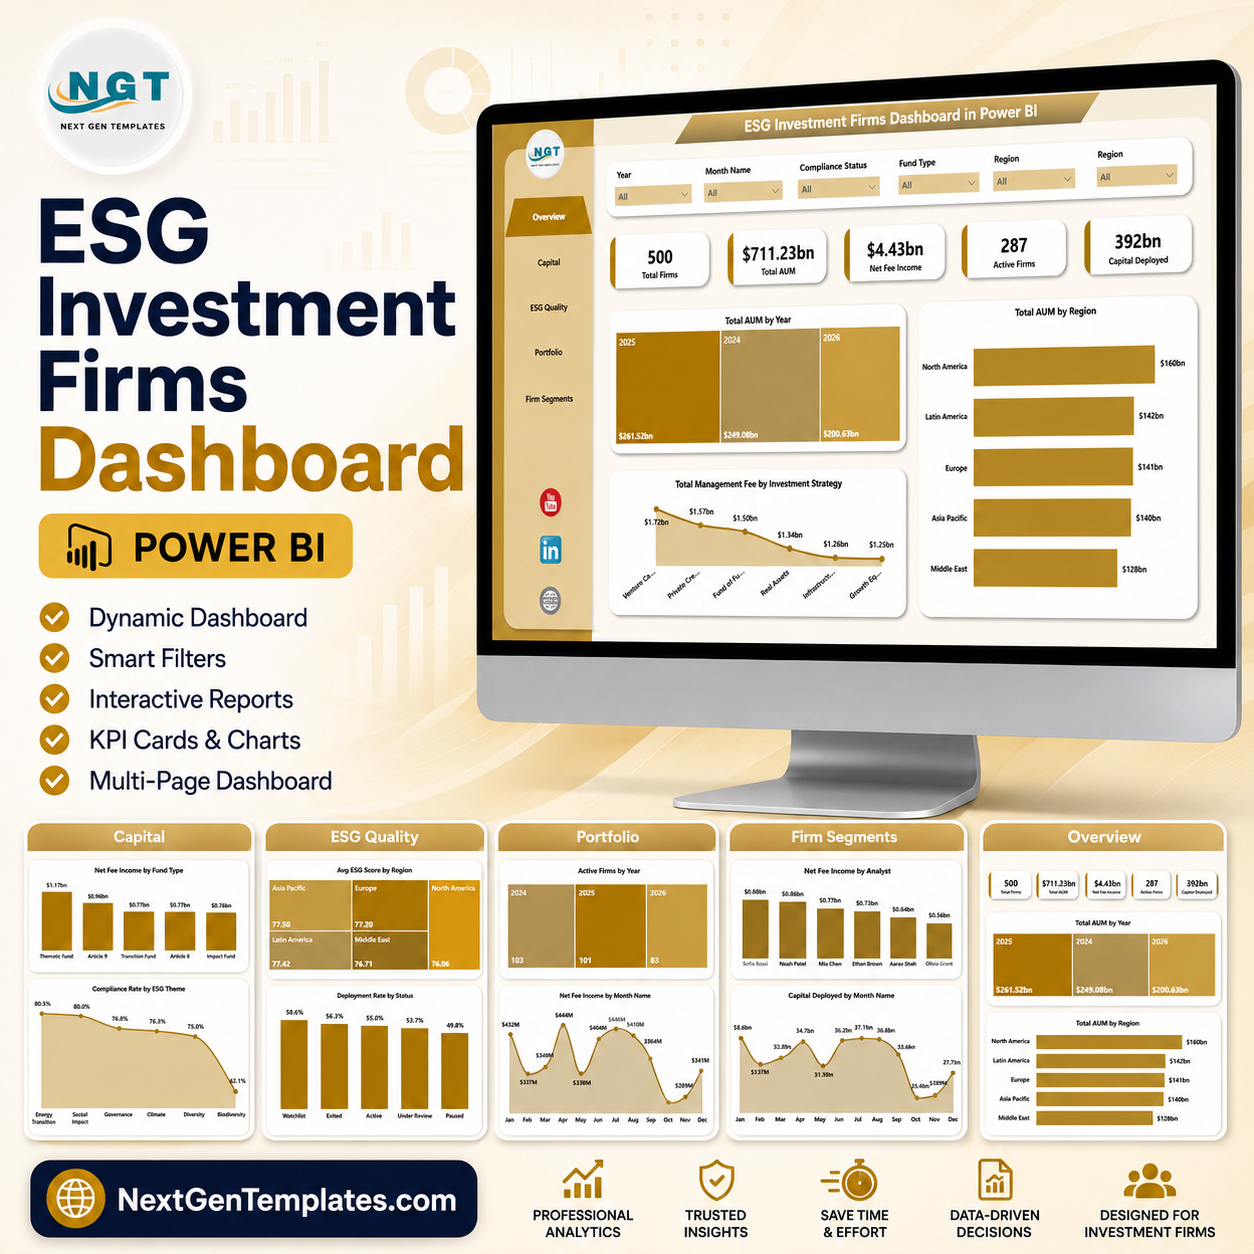
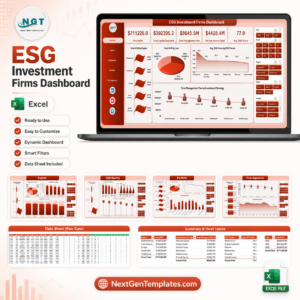
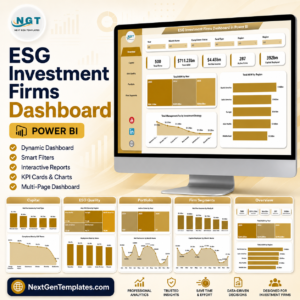
ESG Investment Firms Dashboard in Power BI helps ESG fund managers, investment analysts, portfolio operations teams, and sustainability reporting leads review firm count, AUM, capital deployed, net fee income, management fee, ESG score, compliance rate, investment strategy, region, fund type, analyst, asset class, and status in one editable PBIX report. For $17.99 one-time, you get 5 Power BI pages, 5 executive KPI cards, 15 chart views, and slicers for fast filtered analysis. Open the file in Power BI Desktop, replace or connect your data source, refresh the model, and use the report for investment committee reviews, ESG quality discussions, portfolio reporting, and management updates.
Key Features of ESG Investment Firms Dashboard in Power BI
- 5 Power BI report pages covering Overview, Capital, ESG Quality, Portfolio, and Firm Segments.
- 5 executive KPI cards for Total Firms, Total AUM, Net Fee Income, Active Firms, and Capital Deployed.
- AUM and capital reporting by year, region, month, and status.
- Fee analytics for net fee income and management fee across fund type, quarter, analyst, and investment strategy.
- ESG quality views covering ESG score, ESG theme compliance, deployment rate, and asset-class distribution.
- Interactive slicers help users filter the dashboard quickly during review meetings.
- Editable PBIX structure for users who want to adapt visuals, fields, measures, themes, and pages in Power BI Desktop.
What’s Inside the ESG Investment Firms Dashboard in Power BI
1. Overview Page
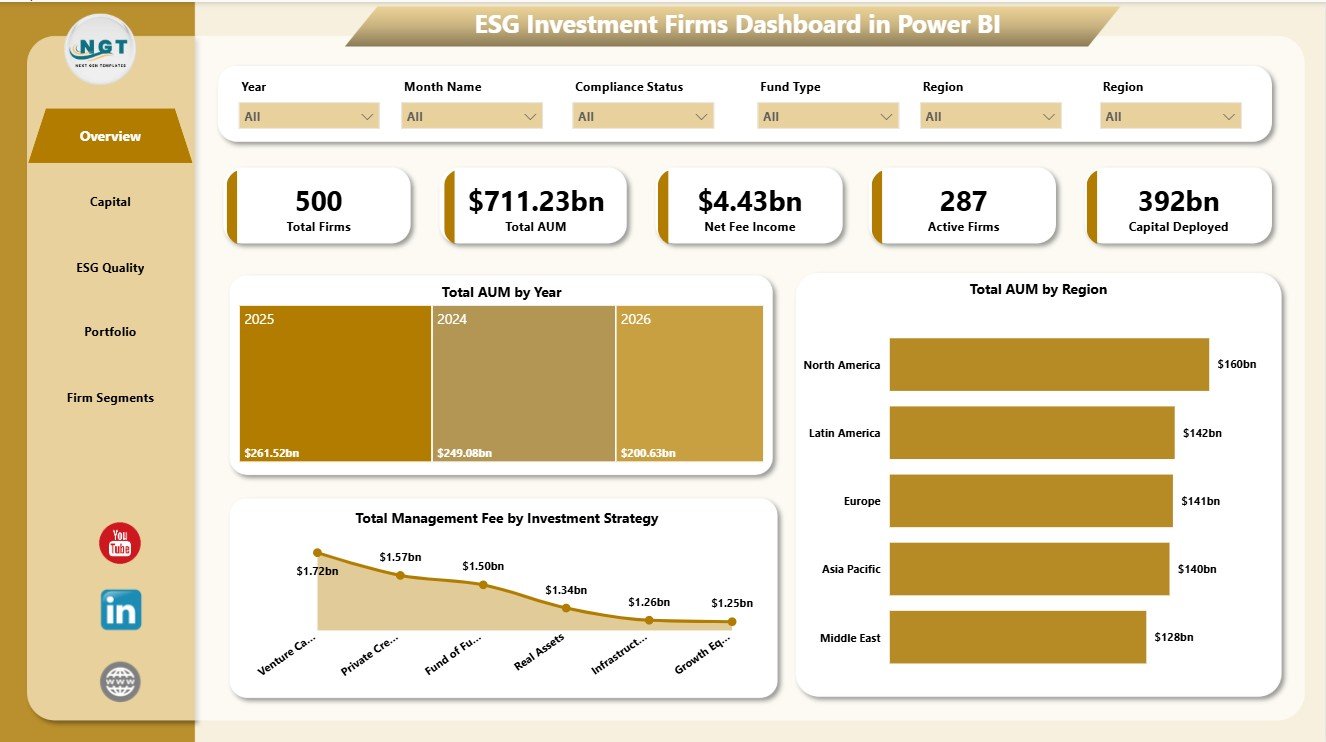
The Overview Page gives leaders a high-level view of ESG investment firm performance. The top cards show Total Firms, Total AUM, Net Fee Income, Active Firms, and Capital Deployed so users can understand operating scale, capital activity, and income position before drilling into detailed pages.
Total AUM by Year: This chart tracks assets under management over time. It helps users identify growth patterns, historical movement, and years that need deeper portfolio review.
Total AUM by Region: This chart compares AUM across regions. It helps investment teams see where exposure is concentrated and where expansion or rebalancing may be needed.
Total Management Fee by Investment Strategy: This visual shows fee contribution by strategy. It helps teams understand which strategies create stronger recurring management-fee income.
2. Capital
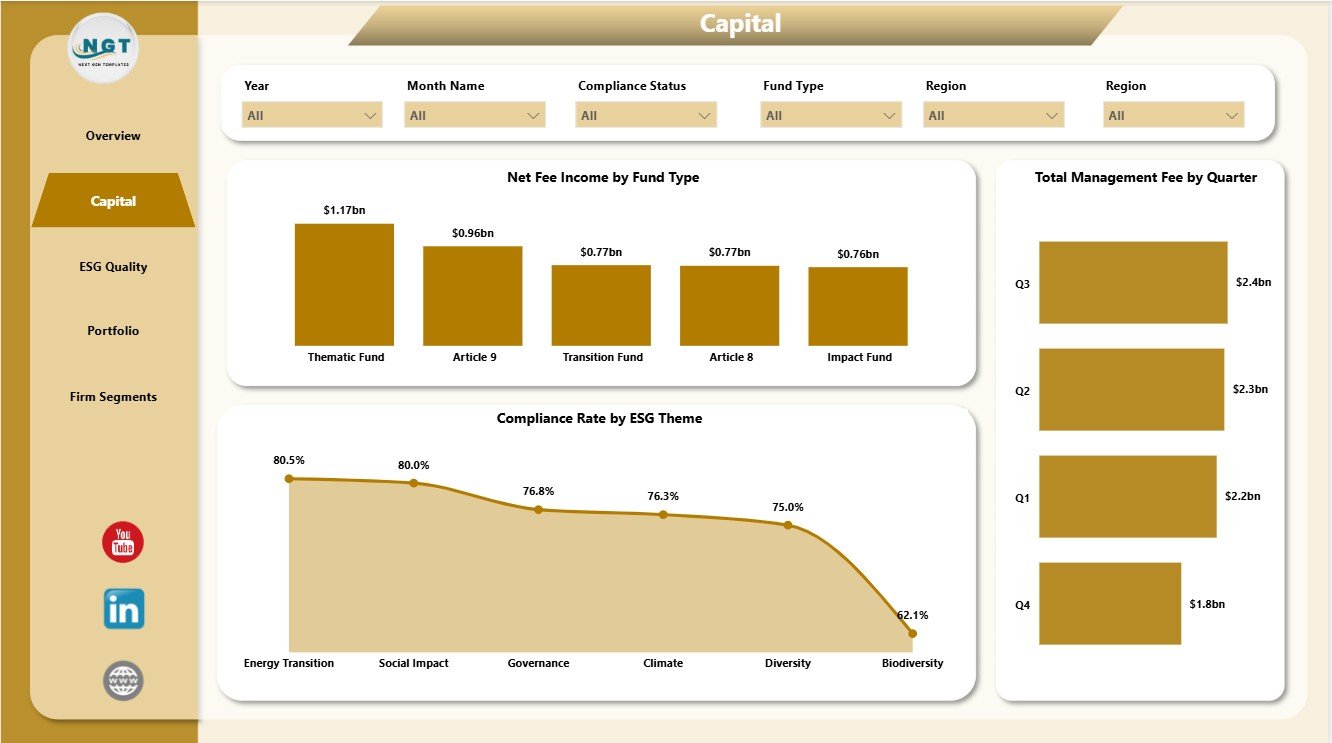
The Capital page focuses on fee behavior, ESG theme compliance, and quarter-level management fee movement. Net Fee Income by Fund Type compares income contribution across fund structures and helps users find high-performing fund types. Compliance Rate by ESG Theme highlights theme-level ESG compliance strength and risk areas. Total Management Fee by Quarter shows how fee income changes across reporting periods.
3. ESG Quality
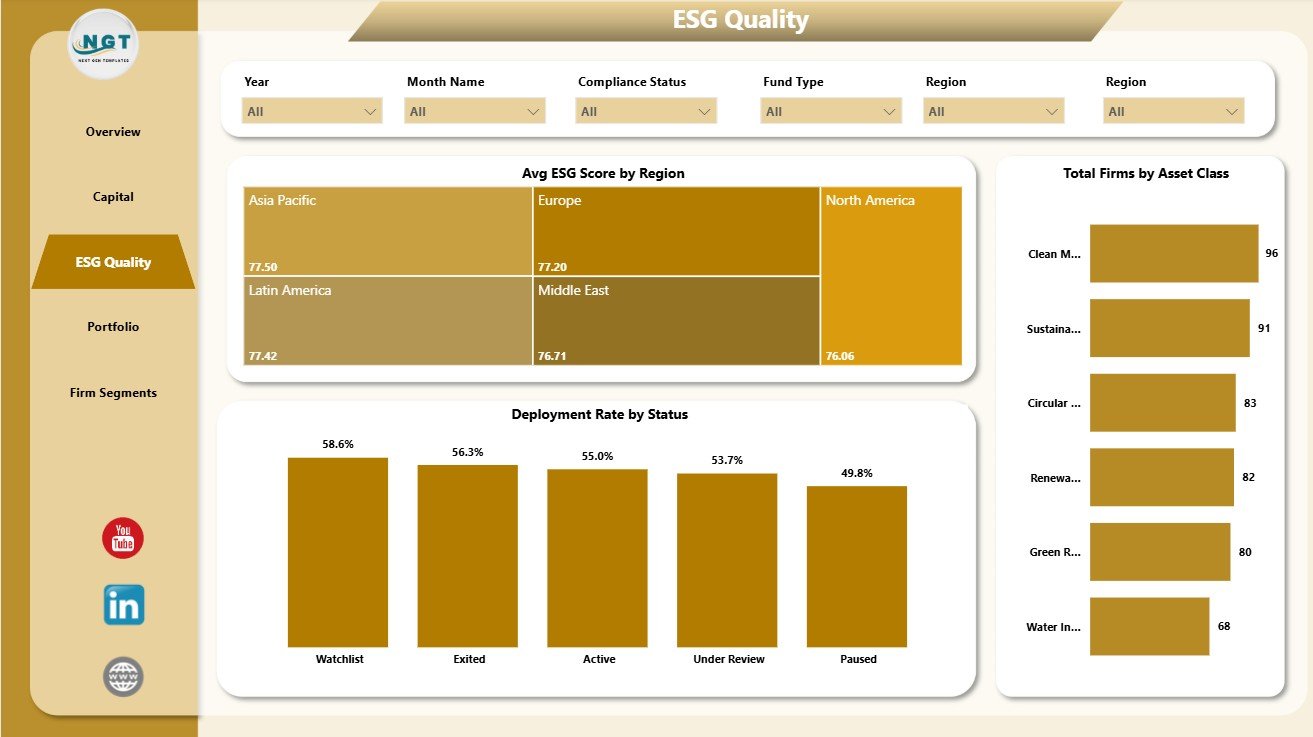
The ESG Quality page supports governance reviews and sustainability oversight. Avg ESG Score by Region compares ESG quality across geographies. Deployment Rate by Status shows how capital deployment behaves by firm or investment status. Total Firms by Asset Class helps users understand firm distribution across asset classes.
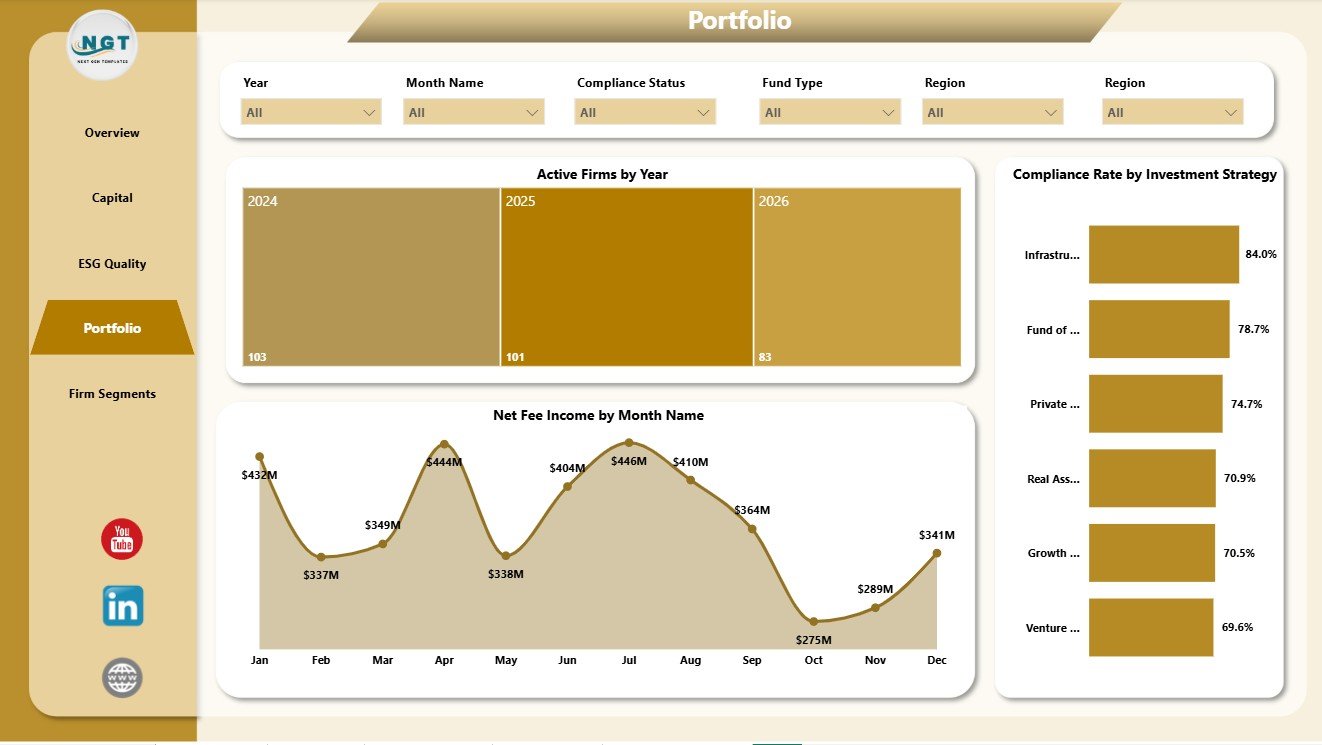
4. Portfolio
The Portfolio page connects year, month, strategy, and income performance. Active Firms by Year tracks active firm movement over time. Net Fee Income by Month Name shows monthly income patterns for finance reviews. Compliance Rate by Investment Strategy helps users compare ESG compliance by strategy.
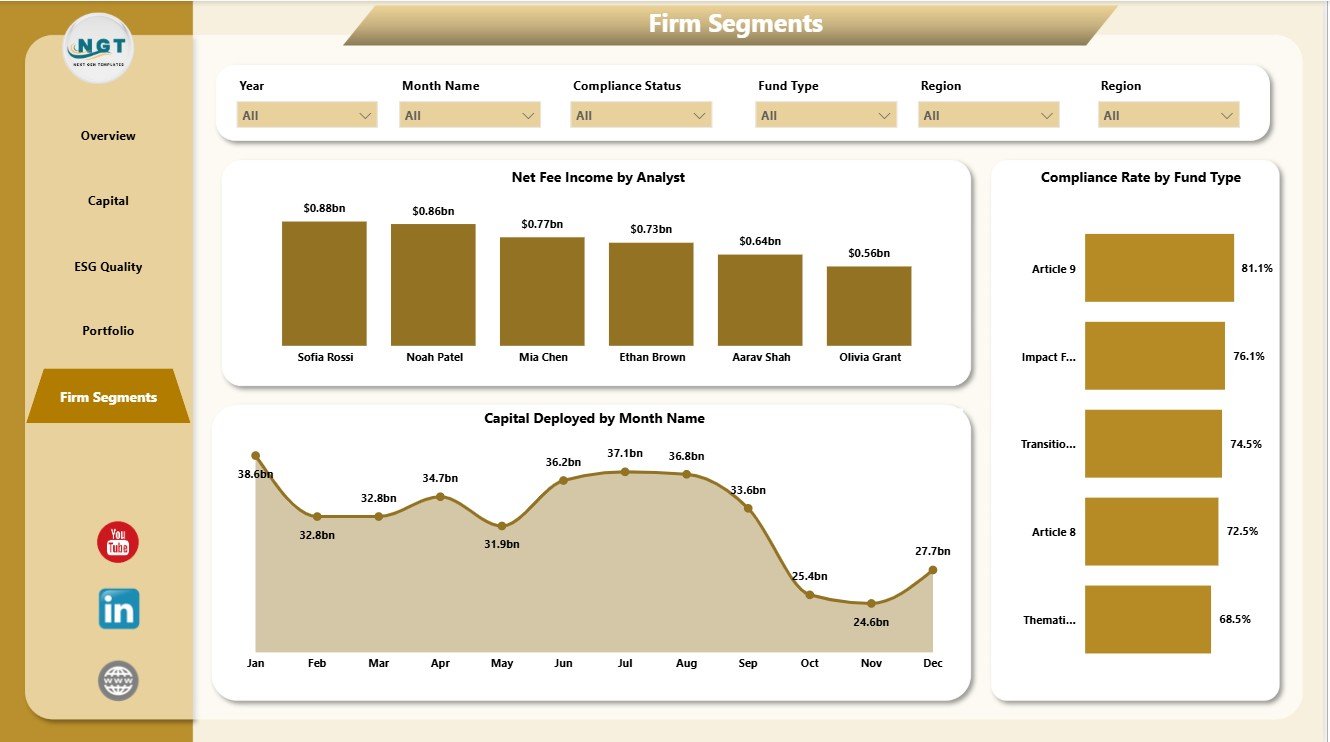
5. Firm Segments
The Firm Segments page compares analyst, month, and fund type performance. Net Fee Income by Analyst shows analyst-level contribution to income. Capital Deployed by Month Name highlights monthly deployment movement. Compliance Rate by Fund Type helps teams compare ESG compliance by fund structure.
ESG Investment Firms Dashboard in Power BI vs. Tableau vs. Paid CRM/SaaS – Where This Fits
| Feature | This Power BI Dashboard | Tableau Alternative | Paid ESG/Portfolio SaaS |
|---|---|---|---|
| Cost | $17.99 one-time | License plus dashboard build time | Monthly or annual subscription |
| Platform | Power BI Desktop / Power BI Service | Tableau Desktop / Cloud | Vendor cloud platform |
| Setup time | Open PBIX, replace or connect data, refresh | Build model and visuals manually | Onboarding and configuration |
| Real-time team collaboration | Available through Power BI Service licensing | Available through Tableau Cloud licensing | Usually included by plan |
| Mobile access | Power BI mobile app after publishing | Tableau mobile after publishing | Vendor app or browser |
| Customizable fields | Editable visuals, model, measures, and pages | Editable with Tableau skills | Limited by vendor settings |
| Share with link | Possible through Microsoft permissions | Possible through Tableau permissions | Usually login controlled |
| Year-1 cost at 5 users | $17.99 plus any Microsoft licensing | Usually much higher | Often hundreds or thousands |
| ESG investment analysis | Built across 5 pages | Must be designed | Depends on module and plan |
Who This Template Is For – and Who It’s Not For
This template is for ESG investment firms, asset managers, fund managers, sustainability analysts, investment operations teams, Power BI analysts, and consultants who need a clear view of AUM, capital deployed, fee income, ESG score, compliance rate, fund type, asset class, strategy, region, analyst, status, and month. It is not a full fund accounting system, ESG rating engine, investor portal, regulatory filing platform, CRM, or data warehouse. It works best when you already have structured ESG investment data and need a ready reporting layer.
How to Use the ESG Investment Firms Dashboard in Power BI
- Download and unzip the file.
- Open the PBIX file in Power BI Desktop.
- Replace the sample data source or connect your own structured table.
- Refresh the report and validate the KPI cards.
- Use slicers to filter pages by available dimensions.
- Customize visuals, colors, fields, and measures if needed.
Real-World Use Cases
Priya, ESG portfolio analyst: Priya uses the Overview and ESG Quality pages before committee meetings to explain AUM, ESG score, active firms, and regional quality.
Marcus, investment operations manager: Marcus reviews Capital and Portfolio pages to compare management fees, net fee income, deployment movement, and compliance by strategy.
Elena, impact investment consultant: Elena uses Firm Segments to compare analyst-level income, fund-type compliance, and monthly capital deployment across client reports.
Frequently Asked Questions
What does this Power BI dashboard track?
It tracks Total Firms, Total AUM, Net Fee Income, Active Firms, Capital Deployed, management fee, ESG score, compliance rate, fund type, asset class, region, year, quarter, month, analyst, investment strategy, and status.
Do I need Power BI Desktop?
Yes. Power BI Desktop is used to open, edit, and refresh the PBIX file. Publishing and sharing may require Microsoft licensing.
Can I use my own ESG investment data?
Yes. Replace or connect the source data, keep the expected fields consistent, and refresh the report.
Can I customize the dashboard?
Yes. You can edit visuals, slicers, fields, relationships, measures, colors, and report pages in Power BI Desktop.
Is this a replacement for ESG software?
No. It is an analytics dashboard for prepared data, not an ESG scoring engine, compliance filing workflow, investor portal, or fund accounting platform.
Who is this best for?
It is best for ESG investment firms, portfolio teams, sustainable finance analysts, impact investment consultants, and Power BI users who need structured ESG investment reporting.
About the Author
Built by PK – Microsoft Certified Professional with 15+ years of Excel, Google Sheets, and Power BI experience. Founder of NextGenTemplates, reaching 300K+ subscribers across YouTube channels. Every template is hand-built and tested before release.
Explore Related Templates
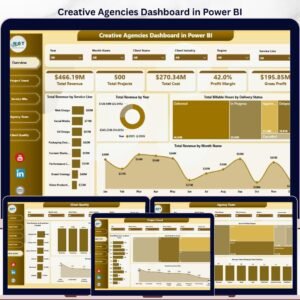
You may also like ESG Investment Firms Dashboard in Excel, Creative Agencies Dashboard in Power BI, and EV Fleet Dashboard in Power BI. Browse more Power BI Dashboard templates.
Download the ESG Investment Firms Dashboard in Power BI today and turn ESG investment, AUM, fee, compliance, and portfolio data into a ready Power BI report.
Last updated: June 9, 2026.


























Reviews
There are no reviews yet.