

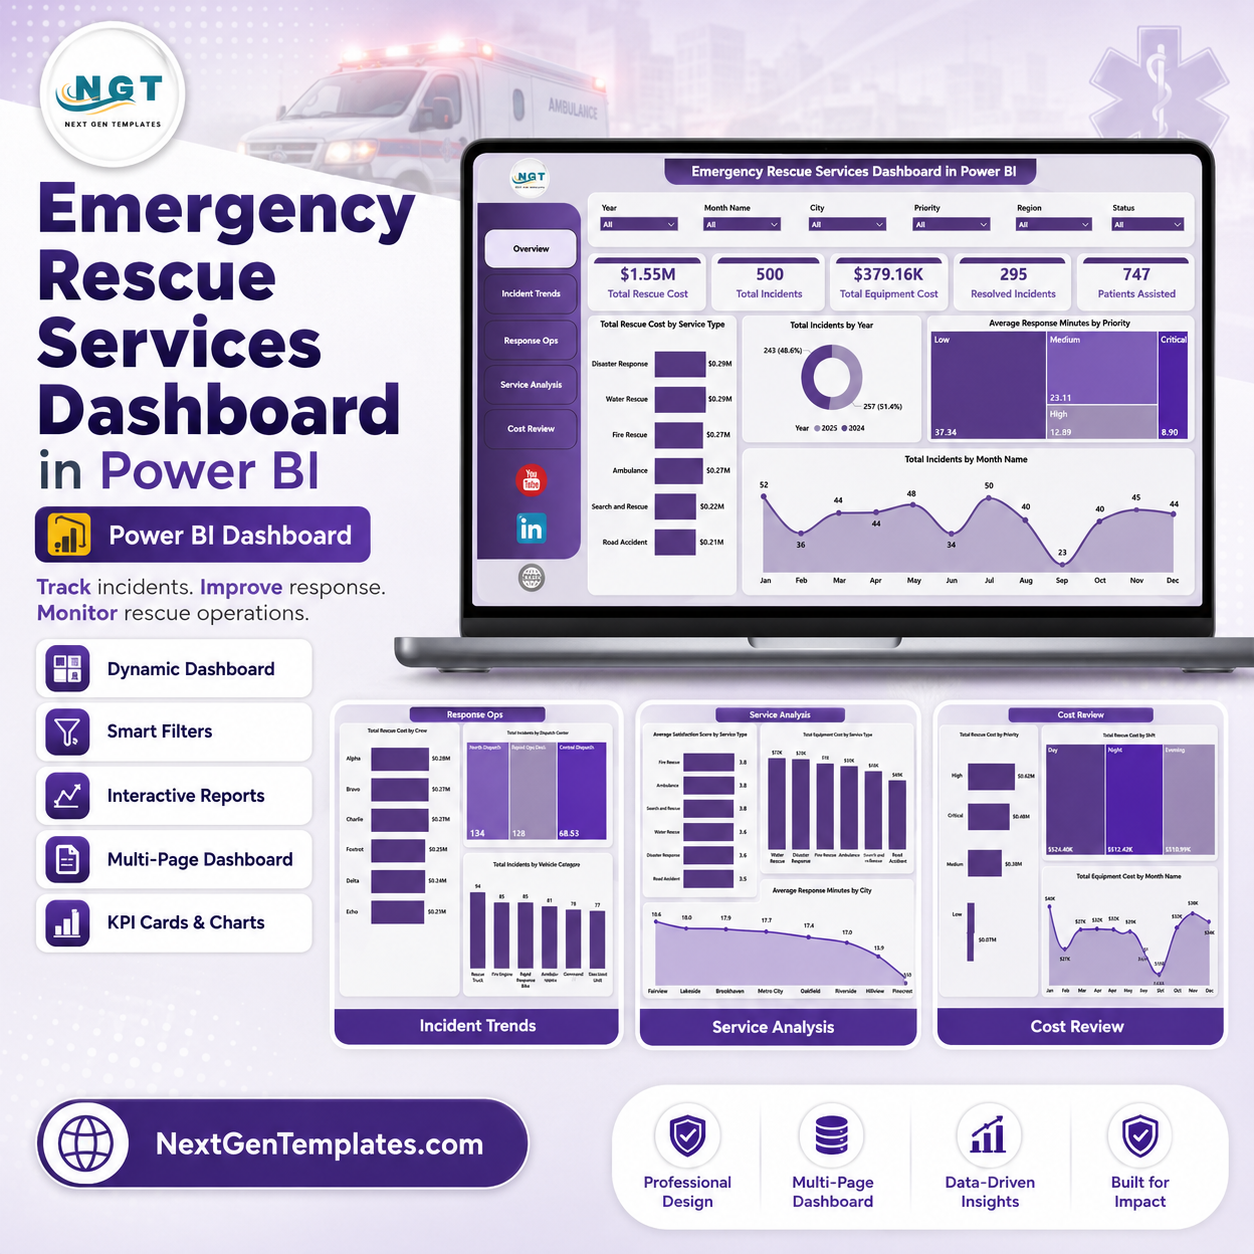

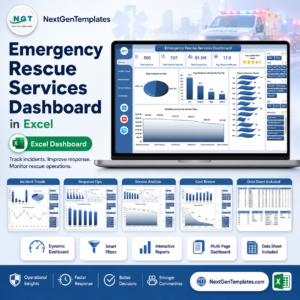
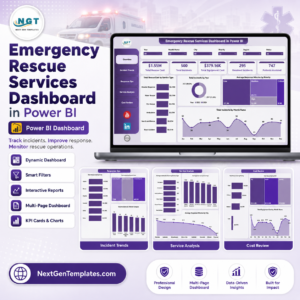
Emergency Rescue Services Dashboard in Power BI helps EMS leaders, rescue coordinators, fire and rescue departments, dispatch centers, and emergency operations teams turn incident records into clear operational reporting. Emergency response teams often track hundreds or thousands of incidents across service types, regions, shifts, crews, vehicles, dispatch centers, response minutes, resolution minutes, rescue cost, equipment cost, patient assistance, satisfaction score, and incident status. For $17.99 one-time, this editable Power BI dashboard gives you 5 report pages, 5 headline KPI cards, slicers, and ready visuals without a monthly emergency management analytics subscription.
Key Features of Emergency Rescue Services Dashboard in Power BI
- 5 Power BI report pages: Overview, Incident Trends, Response Ops, Service Analysis, and Cost Review.
- 5 high-level cards for Total Rescue Cost, Total Incidents, Total Equipment Cost, Resolved Incidents, and Patients Assisted.
- Interactive slicers to filter by time, region, priority, service type, shift, crew, vehicle, dispatch center, and incident fields.
- Cost, response, resolution, incident category, city, crew, vehicle, service type, and satisfaction visuals for faster review.
- Editable .pbix file that can be customized in Power BI Desktop.
- Built for emergency rescue services, EMS reporting, public safety analytics, and rescue operations review.
- One-time purchase with lifetime access to the downloadable template file.
What’s Inside the Emergency Rescue Services Dashboard in Power BI
1. Overview Page
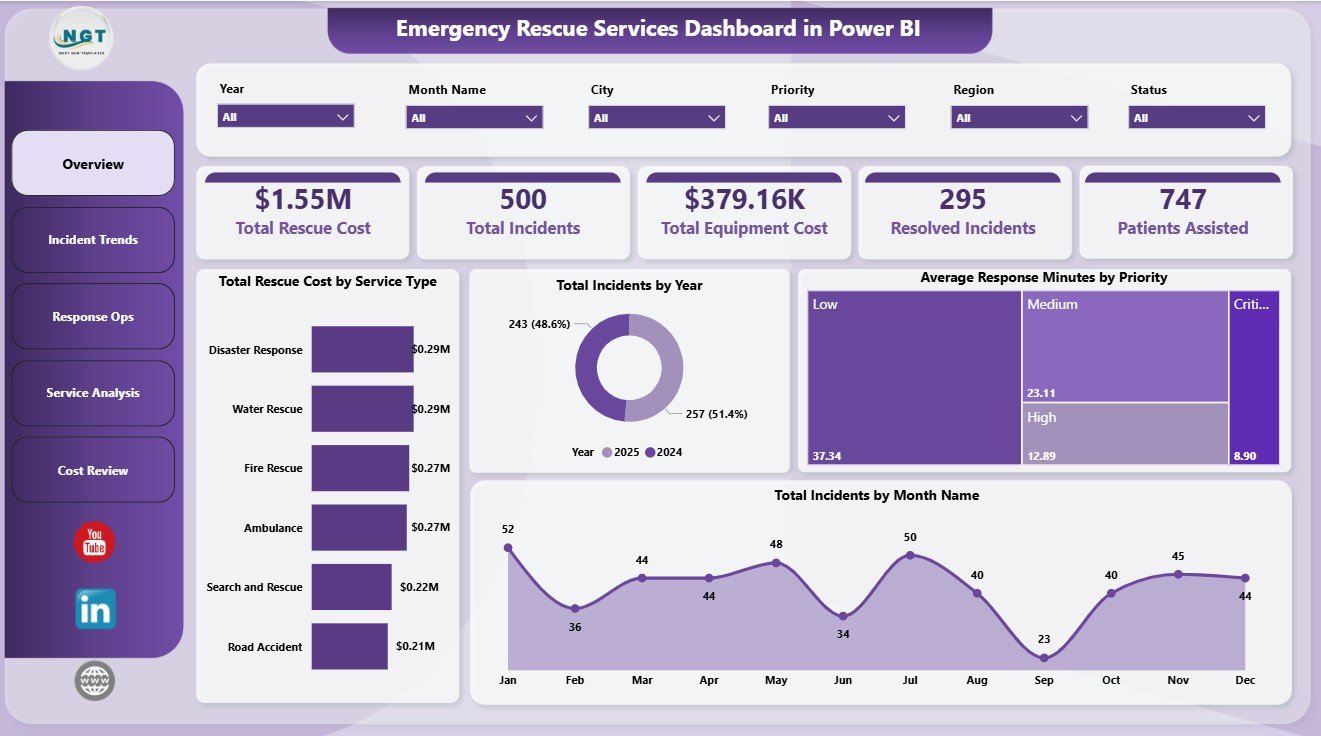
The Overview Page gives leadership a quick summary of emergency rescue activity. The top cards show Total Rescue Cost, Total Incidents, Total Equipment Cost, Resolved Incidents, and Patients Assisted, so users can understand workload, cost, and operational outcomes before drilling into the detailed pages.
Total Rescue Cost by Service Type: This chart compares rescue cost across service categories such as medical, fire, road, water, and other rescue work. It helps budget owners identify which service areas consume the largest share of operational spending.
Total Incidents by Year: This visual shows annual incident volume and makes long-term demand changes easier to spot. Use it for year-end reporting, staffing discussions, and public safety planning.
Average Response Minutes by Priority: This chart compares response speed across priority levels. It helps managers confirm whether urgent incidents are receiving faster response attention.
Total Incidents by Month Name: This visual highlights seasonal patterns in rescue demand. It is useful for planning crew schedules, vehicle readiness, and peak-period coverage.
Emergency Rescue Services Dashboard in Power BI
2. Incident Trends
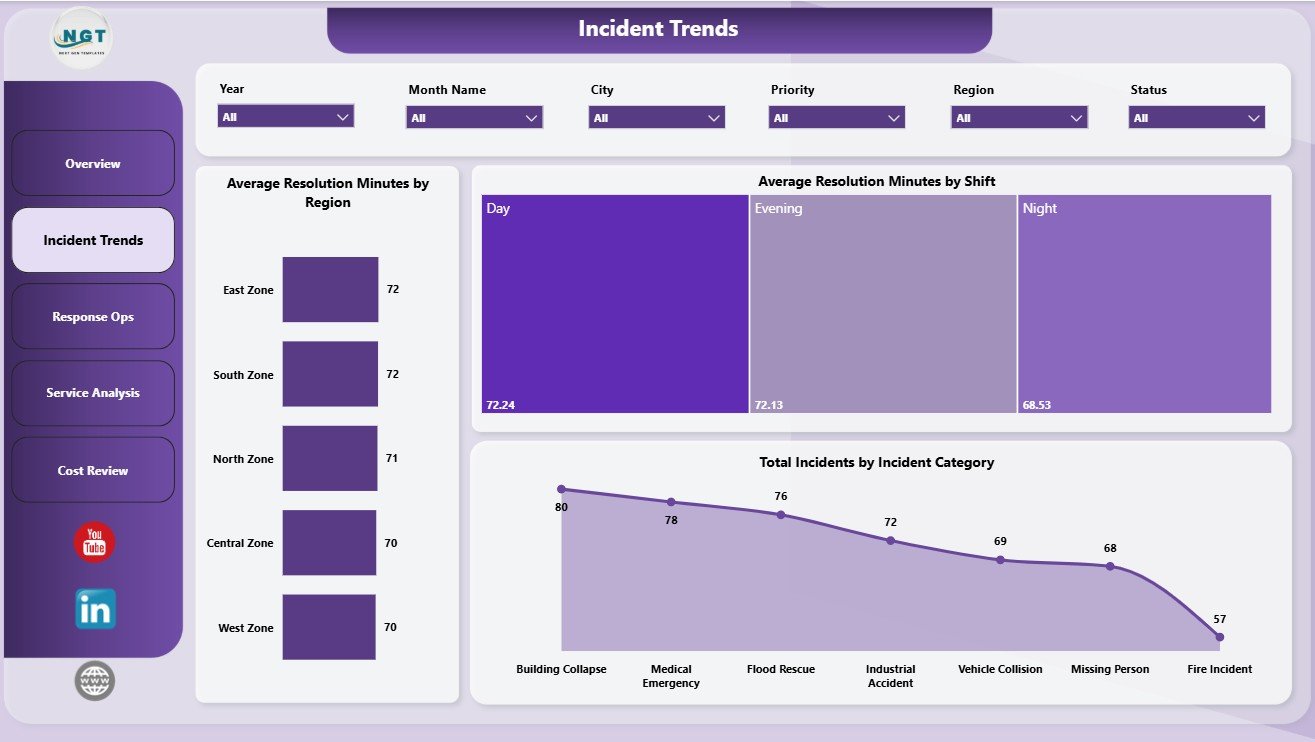
The Incident Trends page focuses on resolution time, regional performance, shift differences, and incident category patterns. Average Resolution Minutes by Region helps managers compare how quickly incidents are closed across service areas. Average Resolution Minutes by Shift shows whether day, evening, or night shifts need additional support, while Total Incidents by Incident Category explains the type of emergencies driving demand.
Incident Trends
3. Response Ops
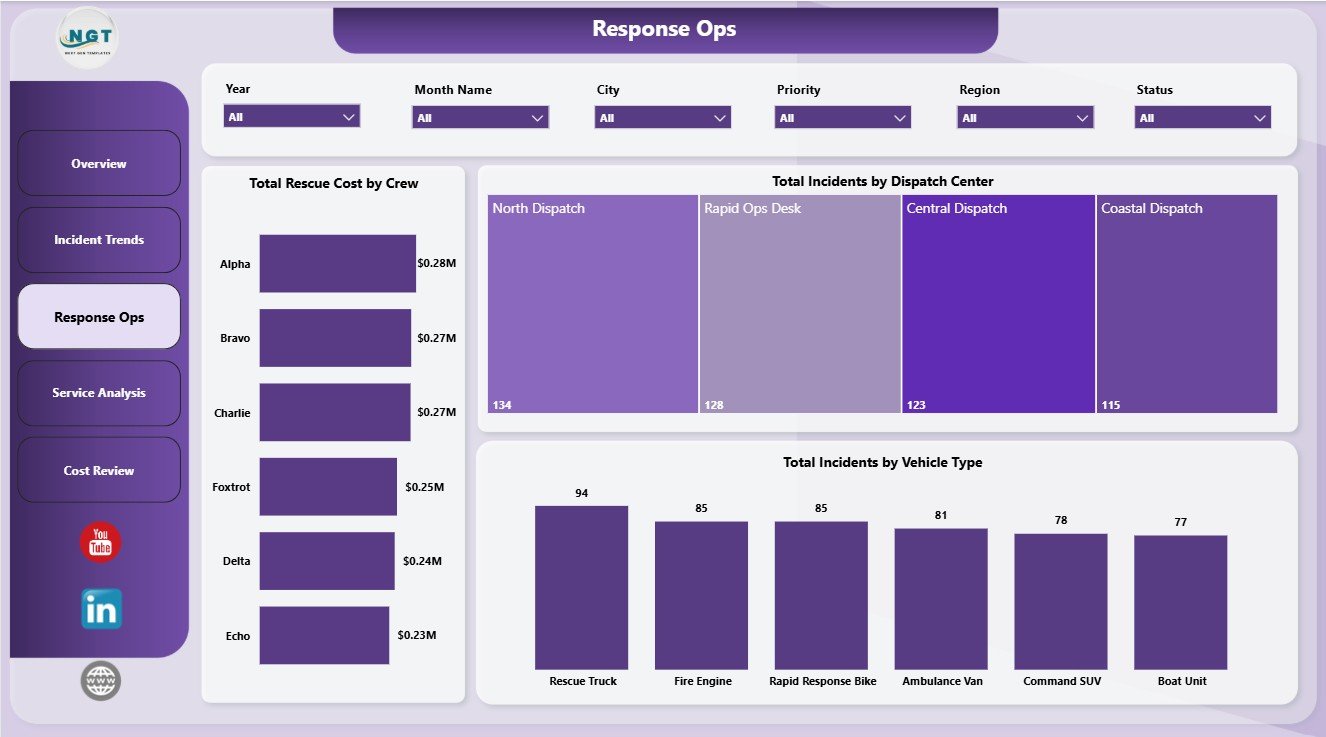
The Response Ops page reviews operational workload and resource usage. Total Rescue Cost by Crew helps identify high-cost rescue teams or workload concentration. Total Incidents by Dispatch Center compares demand across dispatch locations, and Total Incidents by Vehicle Type shows how vehicles are being used across incident activity.
Response Ops
4. Service Analysis
The Service Analysis page gives a closer view of service quality, equipment spend, and city-level response gaps. Average Satisfaction Score by Service Type helps compare user or patient feedback across rescue services. Total Equipment Cost by Service Type shows equipment spending by operational area, and Average Response Minutes by City highlights where response performance may need attention.
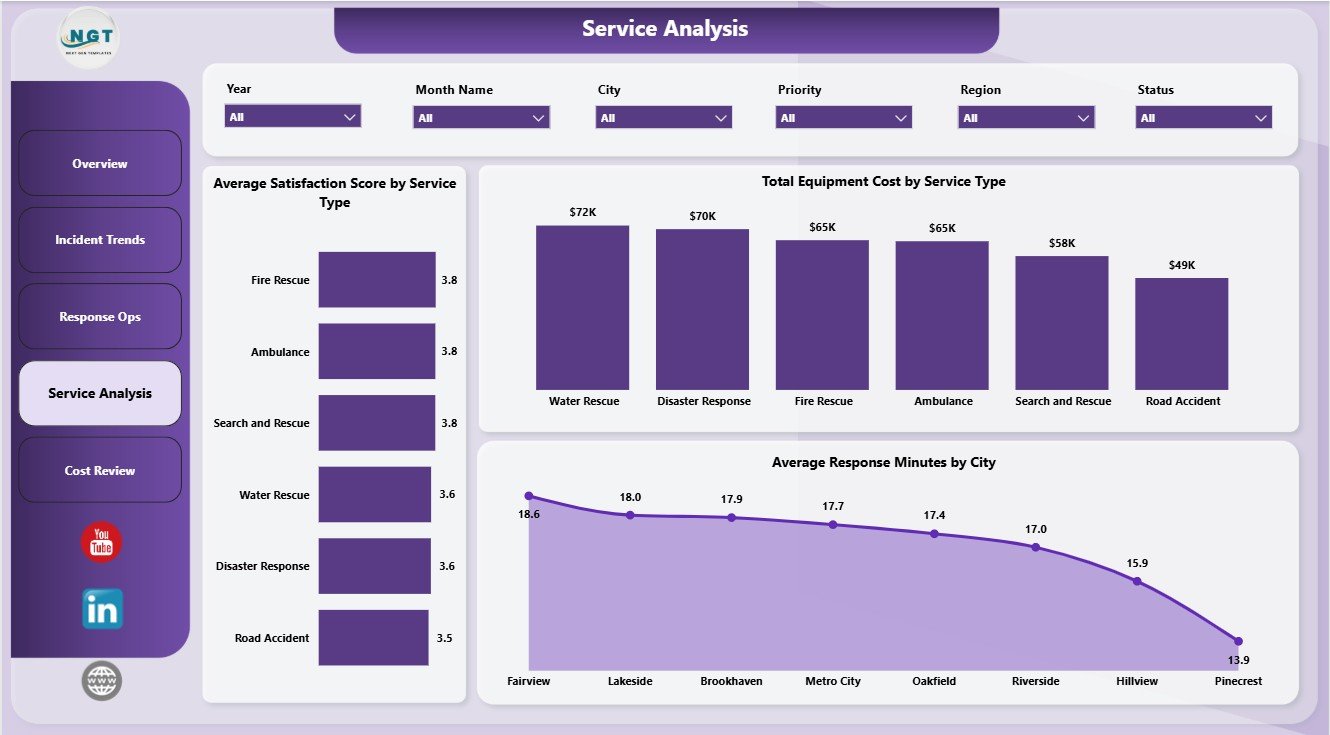
Service Analysis
5. Cost Review
The Cost Review page is designed for finance and operations review. Total Rescue Cost by Priority shows the budget impact of urgent incidents. Total Rescue Cost by Shift compares rescue spending by shift, and Total Equipment Cost by Month Name shows how equipment-related spending changes over the year.
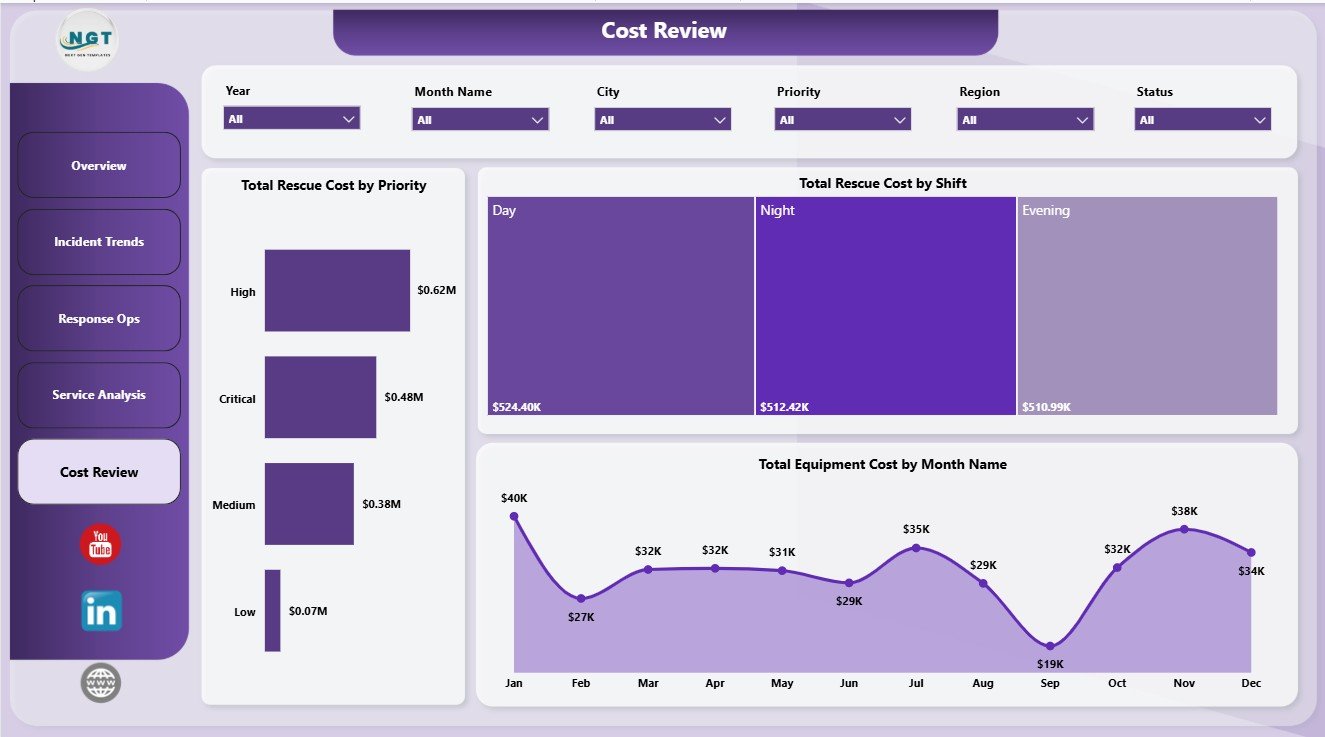
Cost Review
Emergency Rescue Services Dashboard in Power BI vs. Tableau vs. Paid CRM/SaaS – Where This Fits
| Feature | This Power BI Template | Tableau Alternative | Paid Emergency SaaS |
|---|---|---|---|
| Cost | $17.99 one-time | Requires Tableau licensing and build time | Monthly or annual subscription |
| Platform | Power BI Desktop | Tableau Desktop or Cloud | Vendor cloud platform |
| Setup time | Open .pbix, connect data, refresh | Build model and visuals manually | Requires onboarding and configuration |
| Customizable fields | Editable visuals, fields, model, and measures | Editable if built manually | Limited by vendor settings |
| Year-1 cost at 5 users | $17.99 plus any Microsoft licensing | Usually much higher | Often hundreds or thousands |
Who This Template Is For – and Who It’s Not For
This dashboard is for EMS managers, rescue service coordinators, fire and rescue departments, dispatch center analysts, public safety reporting teams, emergency operations centers, healthcare-adjacent response teams, and consultants who need reusable Power BI reporting for incidents, patients assisted, response speed, resolution time, rescue cost, equipment cost, crews, cities, dispatch centers, vehicles, priorities, shifts, and service types.
It is not a live CAD dispatch system, GPS tracking tool, emergency alerting platform, patient-care record system, or incident command application. It works best as an analytics layer when your incident data already exists in a structured table or database.
How to Use the Emergency Rescue Services Dashboard in Power BI
- Download and unzip the product file.
- Open the .pbix file in Power BI Desktop.
- Replace the sample data or connect the report to your own emergency rescue services data source.
- Refresh the report and validate the KPI cards on the Overview Page.
- Use slicers to filter by time period, priority, service type, region, shift, crew, vehicle type, dispatch center, and incident fields.
- Customize visuals, colors, labels, measures, or data connections as needed.
Real-World Use Cases
Ravi, rescue operations chief: Ravi uses the Overview and Incident Trends pages before weekly command meetings to review total incidents, response speed, resolution minutes, and service demand.
Maria, dispatch center manager: Maria uses Response Ops to compare incident volume by dispatch center, crew cost, and vehicle type so she can discuss workload balance with supervisors.
Neha, public safety finance analyst: Neha uses Cost Review and Service Analysis to explain rescue cost, equipment cost, and spending patterns by priority, shift, month, and service type.
Frequently Asked Questions
What is included in this Power BI dashboard?
The .pbix file includes 5 report pages, KPI cards, slicers, and visuals for rescue cost, equipment cost, incidents, resolved incidents, patients assisted, response minutes, resolution minutes, service type, region, shift, crew, dispatch center, vehicle type, city, and priority.
Do I need Power BI Desktop?
Yes. Open the report in Power BI Desktop, which is available from Microsoft. Sharing through Power BI Service may require Microsoft licensing.
Can I use my own emergency rescue data?
Yes. Replace the sample data or connect the report to your own structured incident records and refresh the report.
Can I customize the dashboard?
Yes. You can edit visuals, slicers, fields, colors, measures, pages, and data connections in Power BI Desktop.
Does this replace dispatch software?
No. It is an analytics dashboard, not a live dispatch, GPS, alerting, or incident command system.
Can this be used by fire, EMS, and rescue teams?
Yes. The structure is suitable for EMS, fire rescue, road rescue, water rescue, emergency operations, and similar public safety teams that track incident-level data.
About the Author
Built by PK – Microsoft Certified Professional with 15+ years of Excel, Google Sheets, and Power BI experience. Founder of NextGenTemplates, reaching 300K+ subscribers across YouTube channels. Every template is hand-built and tested before release.
Explore Related Templates
- Emergency Rescue Services Dashboard in Excel
- Electric Utility Maintenance Dashboard in Power BI
- Disability Support NGOs Dashboard in Power BI
- Browse Power BI Dashboard Templates
Download the Emergency Rescue Services Dashboard in Power BI and turn rescue incident data into clear reporting for response, service, cost, crew, dispatch, and patient-assistance decisions.
Last updated: June 8, 2026.
Watch the step-by-step video tutorial:
Compatibility and Requirements
- Works in Power BI Desktop, which is free from Microsoft. The file is an editable .pbix report.
- Microsoft explains the install in Get Power BI Desktop.


























Reviews
There are no reviews yet.